ISM(ISM Manufacturing Index)

To seize trading opportunities in forex or stock markets, understanding key economic indicators is crucial. The ISM Manufacturing Index, with its leading nature, is highly valued by investors.
This article explains the definition, significance, and market impact of the ISM Manufacturing Index, with diagrams for quick comprehension.
Key Takeaways
- What the ISM Manufacturing Index measures and why 50 is the critical threshold
- How PMI is calculated (weighted average of 5 sub-indices) and when it is released
- Specific impact patterns on the U.S. dollar, equities, and commodity markets
- How to use ISM data releases in forex trading strategies
1. What Is the ISM Manufacturing Index?
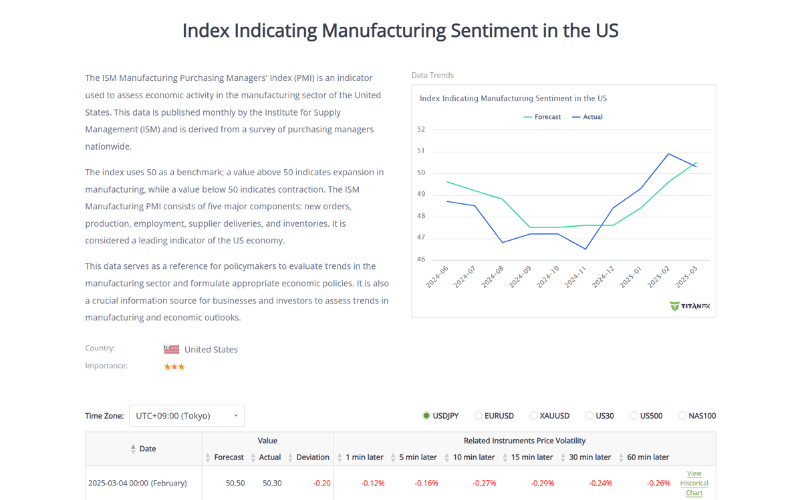
The ISM Manufacturing Index, published monthly by the Institute for Supply Management (ISM), is a key economic indicator that reflects the overall health of U.S. manufacturing.
Founded in 1915, the ISM is a globally respected authority in procurement and supply management, and its survey data is widely used in economic and market analysis.
The index surveys around 400 U.S. manufacturing firms, covering 10 areas, though reports typically focus on 9:
- New Orders
- Backlog of Orders
- New Export Orders
- Imports
- Production
- Supplier Deliveries
- Inventories
- Employment
- Prices
- Customers’ Inventories (less commonly highlighted)
Note: While the market often focuses on 9 key areas, the ISM Manufacturing Index includes all 10, with Customers’ Inventories gauging end-market inventory levels. Depending on needs, analysis can stick to the 9 or include all 10.
Considered a leading indicator of U.S. economic activity, it’s compiled from questionnaires sent to procurement and supply managers. The most watched component is the Purchasing Managers’ Index (PMI), a composite derived from five weighted sub-indices:
- New Orders
- Production
- Employment
- Supplier Deliveries
- Inventories
In everyday use, “ISM Manufacturing Index” typically refers to the PMI. However, the full ISM report also includes prices, imports, and exports for deeper insights.
Release Schedule: Published on the first business day of each month at 10:00 AM ET (11:00 PM GMT+8, or 10:00 PM GMT+8 during Daylight Saving Time).
2. Calculation and Components of the ISM Manufacturing Index
How It’s Calculated
The ISM Manufacturing Index is expressed as a percentage (0–100), based on five key indicators, each weighted at 20%:
- New Orders: Tracks changes in market demand.
- Production: Measures manufacturing output.
- Employment: Gauges labor market activity.
- Supplier Deliveries: Longer delivery times often signal rising demand.
- Inventories: Reflects business stock levels.
Formula:
- ISM Manufacturing Index = (New Orders × 0.2) + (Production × 0.2) + (Employment × 0.2) + (Supplier Deliveries × 0.2) + (Inventories × 0.2)
Each indicator is scored from survey responses: “improved” (×1), “unchanged” (×0.5), “worsened” (×0), with the sum forming the index.
The 50 Threshold
- Above 50: Indicates manufacturing expansion, boosting optimism, potentially strengthening the USD and lifting stocks.
- Below 50: Signals contraction, fostering pessimism, possibly weakening the USD and pressuring stocks.
3. Why Is the ISM Manufacturing Index So Important?
A Leading Indicator
The index is a “leading indicator” due to manufacturing’s sensitivity to economic cycles, foreshadowing shifts before lagging indicators like GDP. For instance, rising new orders suggest future production and consumption growth, while falling inventories may indicate demand recovery.
A U.S. Economic Barometer
As the world’s largest economy, the U.S. relies on manufacturing (about 11% of GDP) for jobs, exports, and supply chains. The index not only reflects domestic conditions but also hints at global demand trends, making it valuable for export-driven economies.
Ties to Other Indicators
Paired with the ISM Non-Manufacturing Index (services PMI), it paints a fuller economic picture. It’s also closely linked to stock markets, USD exchange rates, and Federal Reserve policy expectations.
4. Impact of the ISM Manufacturing Index on Markets
Market Reactions to Index Levels
| Index Level | Stock Market | USD | Commodities |
|---|---|---|---|
| Above 50 | Optimism lifts indices like the S&P 500 | Growth expectations boost USD demand | Rising demand lifts oil, metals prices |
| Below 50 | Recession fears may drag stocks down | Risk aversion or rate-cut bets weaken USD | Falling demand softens prices |
Real-World Examples
- November 2023 Data (Released 12/1): Index at 46.7 (below expected 47.6); USD/JPY dropped ~50 pips in 5 minutes, reflecting slowdown concerns.
- March 2024 Data (Released 4/1): Index rose to 50.3, ending 16 months of contraction (beat 48.3 forecast), lifting U.S. stocks and the USD.
Indirect Impact on Japan
Japan, a manufacturing powerhouse, exports cars, machinery, materials, and electronics to the U.S. A strong ISM signals increased U.S. production, boosting demand for Japanese components and capital goods, aiding exports and profits.
It also affects JPY rates and Bank of Japan policy expectations. A robust U.S. manufacturing sector and rising rate expectations could weaken JPY, benefiting exporters but potentially stoking inflation.
Indirect Impact on Taiwan
Taiwan’s export-driven economy is highly sensitive to U.S. demand. A rising ISM suggests U.S. manufacturing growth, increasing demand for Taiwanese electronics, semiconductors, and machinery, a boon for exports.
Conversely, a falling ISM signals a U.S. slowdown, curbing demand for Taiwanese goods, which may pressure Taiwan’s export orders and PMI.
Indirect Impact on Europe
U.S. manufacturing trends (via the ISM Index) also affect Europe, especially Germany and the Eurozone’s manufacturing and exports.
Impact on Germany and Eurozone Manufacturing
Europe, led by Germany, excels in cars, machinery, chemicals, and industrial goods, often tied to U.S. supply chains. A rising ISM boosts U.S. demand, lifting European high-end manufacturing and capital goods exports.
A falling ISM, however, slows U.S. manufacturing, reducing European export orders, particularly for durable goods, pressuring Germany’s PMI and Eurozone performance.
Impact on European Currencies and Markets
ISM data influences EUR and GBP trends. A strong U.S. manufacturing outlook may signal Fed tightening, strengthening USD and weakening EUR/GBP, aiding European exporters but raising import costs.
A weak ISM raises recession fears, denting global confidence and potentially hitting European stocks and business sentiment.
5. Frequently Asked Questions
Q1: Where can I find the latest ISM Manufacturing Index?
Check the ISM website (ismworld.org) for real-time data or use platforms offering economic indicators like GDP, rates, and employment.
Latest U.S. ISM Manufacturing Index
Q2: What’s the difference between ISM Index and PMI?
The ISM Index, from ISM, focuses on U.S. manufacturing; PMI, from firms like S&P Global, covers multiple countries, with preliminary and final releases, differing slightly in scope and methodology.
Q3: Does a high index always mean economic recovery?
Not necessarily. It must be analyzed with sub-indices (e.g., new orders, employment) and other data (e.g., non-farm payrolls). A rise with shrinking orders might just be a short-term bounce.
Q4: Why do investors care so much about this index?
Its early release, comprehensive data, and ability to signal economic turning points make it a key driver for forex, stock, and bond market decisions.
6. Summary
The ISM Manufacturing Index, released monthly by the Institute for Supply Management, tracks U.S. manufacturing health via five metrics like new orders and production, with 50 as the expansion/contraction divide.
Published on the first business day of each month, this leading indicator shapes USD, stock, and commodity market trends.
To stay ahead, monitor its releases and pair it with technical analysis for sharper trading decisions.
Related Articles
Titan FX Research. We produce educational content for investors, covering a wide range of financial instruments including forex, commodities (crude oil, precious metals, agricultural products), stock indices, U.S. equities, and digital assets.
Primary Sources (by category)
- Official Data: Institute for Supply Management (ISM) — Manufacturing PMI Report
- Analysis: OANDA — ISM Manufacturing Index; Nomura Asset Management
- Statistics: Bureau of Economic Analysis — GDP; Bureau of Labor Statistics — Employment