

NZD (New Zealand Dollar)

The New Zealand dollar (NZD, nicknamed the Kiwi) is New Zealand's legal tender, issued and managed by the Reserve Bank of New Zealand (RBNZ). It is a classic commodity currency whose exchange rate responds to dairy and other agricultural exports, the RBNZ's Official Cash Rate (OCR), demand from China, and global risk sentiment, and it is the major currency that moves most closely with the Australian dollar.
Among the major currencies, the New Zealand dollar has the smallest economy behind it, yet it is often one of the liveliest movers. Its swings are usually driven by a handful of well-defined forces: dairy auction prices, the central bank's stance on rates, the state of the Chinese economy as its largest export market, and whether investors are in the mood to take risk. Each of these can be tracked through public data, which makes the NZD a good currency for learning fundamental analysis.
This article covers the New Zealand dollar's basics and history, its character as a commodity currency and a risk currency, the five factors that move the exchange rate, the 2025–2026 policy cycle as a worked example, and the practical side of trading it: which pairs to choose, when it trades, what it costs, and which tools help.
- The NZD replaced the New Zealand pound in 1967 and has floated freely since 1985; the BIS 2025 survey puts its daily turnover at about US$147 billion, roughly 1.5% of global forex trading
- Food and fibre make up about 80% of New Zealand's goods exports, and dairy nearly half of that, so Global Dairy Trade (GDT) auction prices are a reference indicator specific to the NZD
- China is New Zealand's largest export market, and Chinese demand and data feed directly into the currency
- The RBNZ reviews the OCR seven times in 2026 and eight times a year from 2027; consecutive hikes in July and September 2026 took the OCR from 2.25% back to 2.75%
- The NZD is a risk currency that tends to come under selling pressure when risk aversion rises; it moves closely with the AUD, and AUD/NZD shows the relative strength of the two
- Titan FX offers seven NZD pairs, including NZD/USD, AUD/NZD, and NZD/JPY, each with its own set of drivers to watch
- 1. What Is the New Zealand Dollar (NZD)? The Kiwi and the Basics
- 2. History: From the 1967 Launch to the 1985 Float
- 3. What Makes the NZD Different? Commodity Currency, Risk Currency, and the AUD Link
- 4. Why Does the NZD Rise and Fall? The Five Biggest Drivers
- 5. How RBNZ Rates Move the NZD: The 2025–2026 Policy Cycle
- 6. How to Trade the NZD: Choosing Between NZD/USD, AUD/NZD, and NZD/JPY
- 7. New Zealand Dollar FAQ
- 8. Conclusion
1. What Is the New Zealand Dollar (NZD)? The Kiwi and the Basics
The New Zealand dollar (NZD) is New Zealand's official currency. Its ISO 4217 code is NZD, its symbol is NZ$ or $, and one dollar is divided into 100 cents. Beyond New Zealand itself, it is also used in the Cook Islands, Niue, Tokelau, and the Pitcairn Islands.
The market calls it the Kiwi, after the bird on the one-dollar coin, and the NZD/USD pair is often referred to simply as "the Kiwi." The currency is issued and managed, and monetary policy set, by the Reserve Bank of New Zealand (RBNZ).
The NZD's weight in the forex market is far larger than New Zealand's economy. According to the Bank for International Settlements' 2025 Triennial Survey, the NZD trades about US$147 billion a day, 1.5% of global forex turnover (on the convention that both sides of every trade sum to 200%), and the NZD/USD pair alone accounts for about US$118 billion. That makes it one of the world's actively traded major currencies rather than an emerging-market currency.
2. History: From the 1967 Launch to the 1985 Float
The New Zealand dollar was introduced on July 10, 1967, replacing the New Zealand pound at two dollars to the pound as part of decimalization. It was initially pegged to the US dollar and later to a basket of currencies, with the rate set by the government.
In March 1985 New Zealand floated the dollar, leaving the exchange rate to market supply and demand as part of the economic reforms of the 1980s. The Reserve Bank of New Zealand Act 1989 established the RBNZ's independence and its price-stability mandate, making New Zealand the first country to adopt inflation targeting, and in March 1999 the RBNZ introduced the Official Cash Rate (OCR) as its main policy tool, which it still uses today.
Since the float, the NZD has fallen sharply in the Asian financial crisis of 1997, the global financial crisis of 2008, and the early stage of the 2020 pandemic, and rebounded each time as risk sentiment and commodity prices recovered. Those episodes point to the same thing: whether global investors are willing to take risk has a large effect on the currency.
3. What Makes the NZD Different? Commodity Currency, Risk Currency, and the AUD Link
A commodity currency built on farm exports, above all dairy
New Zealand is an agricultural exporter. According to the June 2026 forecast by the Ministry for Primary Industries (MPI), food and fibre exports for the year to June 2026 are about NZ$64.3 billion, roughly 80% of goods exports; dairy accounts for about NZ$28.6 billion, close to half of that, with meat and wool at about NZ$14.1 billion and horticulture at about NZ$9.5 billion.
Export income rises and falls with the world prices of these products, and the NZD follows, which is the defining trait of a commodity currency. Where the Australian dollar tracks iron ore and the Canadian dollar tracks crude oil, the NZD's commodity is dairy.
A risk currency that moves with global sentiment
The NZD is a textbook risk currency. When investors are optimistic, money flows into higher-yielding and commodity-linked assets and the NZD tends to rise; when risk aversion takes over, money returns to the US dollar, the yen, and the Swiss franc, and the NZD tends to come under heavy selling pressure. Knowing how to read market sentiment matters especially for a currency like this.
There are two reasons. New Zealand's economy is small and export-dependent, so a slowing world economy leads the market to price in weaker export income. And because the NZD was for many years one of the higher-yielding major currencies, it was widely used in carry trades; when risk aversion rises, those positions are unwound and the selling tends to arrive all at once.
Tightly linked to the Australian dollar
New Zealand and Australia are neighbors with similar economic structures, both rely on commodity exports to China, and their central banks often lean the same way, so the NZD and AUD have been highly positively correlated for a long time. NZD/USD and AUD/USD usually move in the same direction, and the relative strength of the two shows up in the AUD/NZD cross.
Two practical points follow. Holding NZD and AUD positions in the same direction at the same time can leave you doubly exposed to the shared factors—the US dollar, commodities, and risk sentiment—which the Correlation Matrix will confirm. And AUD/NZD lets you watch the relative strength of the two currencies while stripping out much of the noise from the US dollar as the common quote currency.
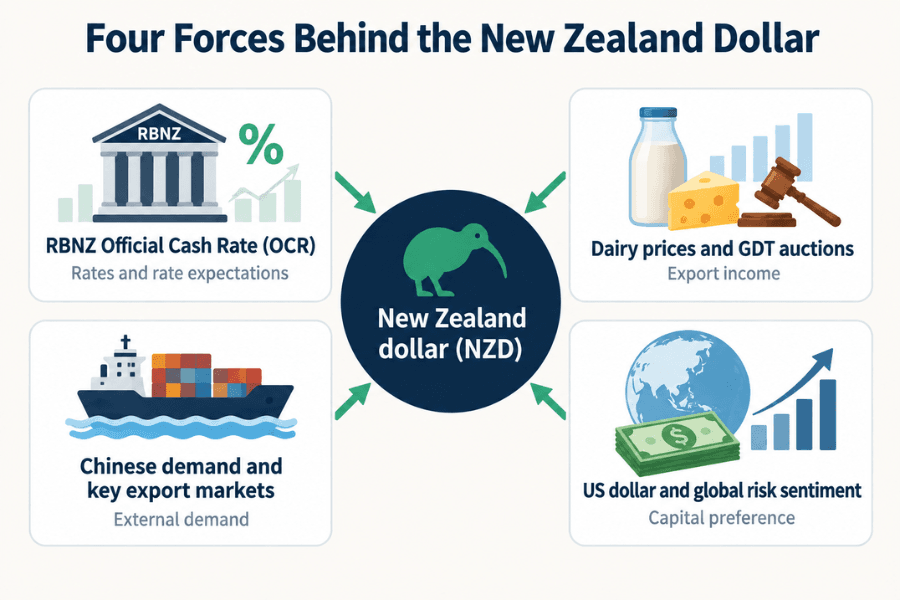
4. Why Does the NZD Rise and Fall? The Five Biggest Drivers
Driver 1: The RBNZ's Official Cash Rate (OCR)
The RBNZ's policy rate is called the Official Cash Rate (OCR). Its Monetary Policy Committee reviews it on a fixed schedule—seven times in 2026, and eight times a year from 2027—with the goal of keeping consumer price inflation between 1% and 3%, centered on 2%. The direction of the OCR sets the interest-rate gap between the NZD and other currencies: expectations of hikes usually lift the NZD, expectations of cuts weigh on it.
An OCR decision is one of the important events that can move the NZD in the short term, but the market pays even more attention to the statement and the Monetary Policy Statement's description of the future rate path. The gap between the actual decision and what the market expected is what produces the reaction. RBNZ meeting dates and other central banks' decisions can be followed on Central Bank Watch.
Driver 2: Inflation, growth, and jobs data
Most of New Zealand's key economic data is published quarterly, less often than in the United States or Japan, so each release carries more weight. CPI above the target band strengthens rate-hike expectations, while GDP and employment data show the strength of the economy and how much room the central bank has. Release dates are listed on the New Zealand economic indicators page.
| Data | Frequency | What it means for the NZD |
|---|---|---|
| OCR decision | 7 times in 2026, 8 a year from 2027 | Sets the direction of the rate gap; the rate path in the statement matters more than the decision itself |
| Consumer price index (CPI) | Quarterly (moving to monthly from 2027) | Inflation above the target band strengthens hike expectations |
| GDP | Quarterly | Shows the strength of the economy and the central bank's room to move |
| Employment data | Quarterly | One of the RBNZ's policy inputs; a weakening labor market is usually negative for the NZD |
| Goods trade balance | Monthly | Direct evidence on exports and Chinese demand |
| GDT dairy price index | Twice a month | The reference indicator for dairy export prices |
Driver 3: Dairy prices and the GDT auctions
Dairy is New Zealand's largest single export. Global Dairy Trade (GDT) has provided market reference prices for dairy products since 2008; its auctions are held on the first and third Tuesday of each month, and the results are published as a price index. A rising index means the outlook for export income and farm incomes has improved, and the market reassesses New Zealand's fundamentals accordingly.
Keep in mind that the direction is not automatic. If dairy prices rise because of a supply shortage, or alongside weakening global demand, the NZD does not necessarily strengthen, and the direction of several consecutive auctions matters more than any single result.
Driver 4: Chinese demand and the main export markets
According to Stats NZ, China is New Zealand's largest export market, followed by Australia, the United States, the EU, and Japan. China's PMI, import data, and property-market news affect the exchange rate through the chain of Chinese demand, New Zealand exports, and the NZD; when major Chinese data is released, currencies with deep trade links to China such as the AUD and NZD tend to draw attention.
Driver 5: The US dollar and global risk sentiment
NZD/USD is the NZD's main pair, and the strength of the US dollar itself decides its direction just as much: Federal Reserve policy, US Treasury yields, and the US stock market sometimes affect NZD/USD more than New Zealand's own data does. When analyzing NZD/USD, separate the US-dollar-side drivers from the NZD-side drivers, and add the risk sentiment described in section 3.
5. How RBNZ Rates Move the NZD: The 2025–2026 Policy Cycle
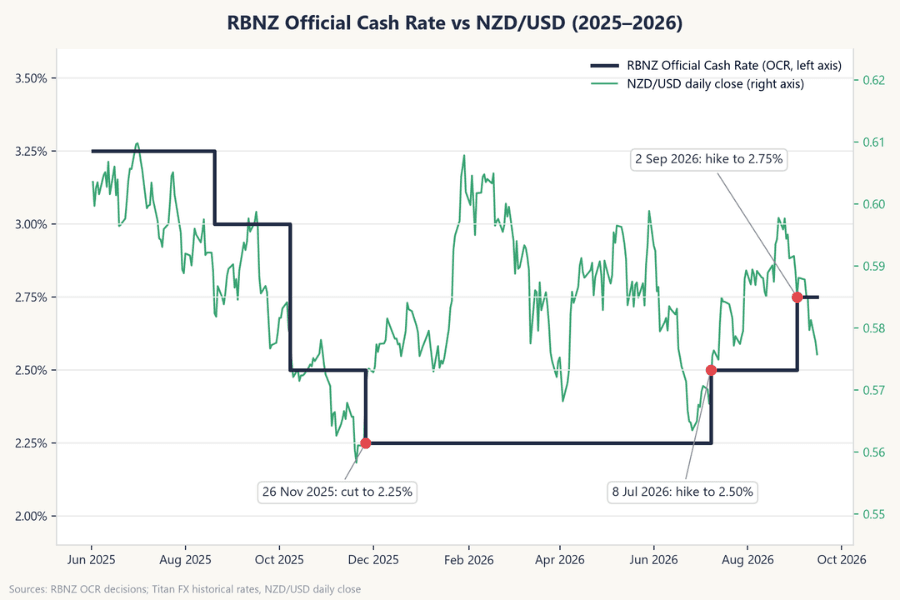
A real policy cycle makes the factors above easier to see. The RBNZ began cutting rates in August 2024, took the OCR down to 2.25% in November 2025, then paused and held that level until mid-2026. Over this stretch the NZD's yield advantage shrank noticeably, and carry trades such as NZD/JPY lost some of their appeal.
The picture reversed in the first half of 2026. The conflict in the Middle East pushed fuel prices up, and New Zealand's annual consumer price inflation rose to 4.1% in the June 2026 quarter, above the 1% to 3% target band. The RBNZ raised the OCR by 25 basis points to 2.50% on July 8, 2026—the first hike since May 2023—and by another 25 basis points to 2.75% on September 2, a decision reached by consensus and accompanied by the statement that the future path of the OCR is not predetermined.
Exports were strong over the same period. According to Stats NZ, goods exports for the year to June 2026 reached NZ$84.0 billion, up NZ$7.8 billion on the previous year, and exports of milk powder, butter, and cheese in June 2026 alone came to NZ$2.05 billion, 16% higher than a year earlier. Rising rates and record exports were the two fundamental supports for the NZD in this period; how much of that support showed up in the exchange rate was decided by the US dollar and global risk sentiment.
As of September 2026 the OCR stands at 2.75%, with the next decision scheduled for October 28, 2026. For the latest rate and meeting dates, check the RBNZ website and the economic calendar.
6. How to Trade the NZD: Choosing Between NZD/USD, AUD/NZD, and NZD/JPY
Choosing a pair
Titan FX offers seven NZD currency pairs. NZD/USD is the most actively traded NZD pair and usually one of the cheapest to trade; AUD/NZD reflects the relative strength of New Zealand and Australia; NZD/JPY is sensitive to shifts in the rate gap and in risk sentiment. The main drivers to watch for each pair are summarized below, and each has its own introductory article.
| Pair | Main drivers to watch | Introductory article |
|---|---|---|
| NZD/USD | NZD fundamentals plus the US dollar, the Fed, and global risk sentiment | NZD/USD Explained |
| AUD/NZD | Australian and New Zealand rates, commodity exports, and relative growth | What Is AUD/NZD? |
| NZD/JPY | The NZD-JPY rate gap plus global risk sentiment | What Is NZD/JPY? |
| EUR/NZD | ECB-RBNZ policy differences plus euro-area and New Zealand growth | What Is EUR/NZD? |
| GBP/NZD | BoE-RBNZ policy differences; historically among the more volatile pairs | What Is GBP/NZD? |
| NZD/CAD | Policy differences plus the dairy-versus-energy export backdrop | What Is NZD/CAD? |
| NZD/CHF | New Zealand-Swiss policy differences plus risk sentiment | What Is NZD/CHF? |
If NZD/USD is your main pair, start with its introductory article above to understand the pair's character, then go to the instrument page when you need the live quote, multi-timeframe technical readings, and trading conditions. Historical rates are available in the exchange rate database, with data back to 2000.
NZD/USD instrument page: live rates and technical analysis NZD/USD historical rates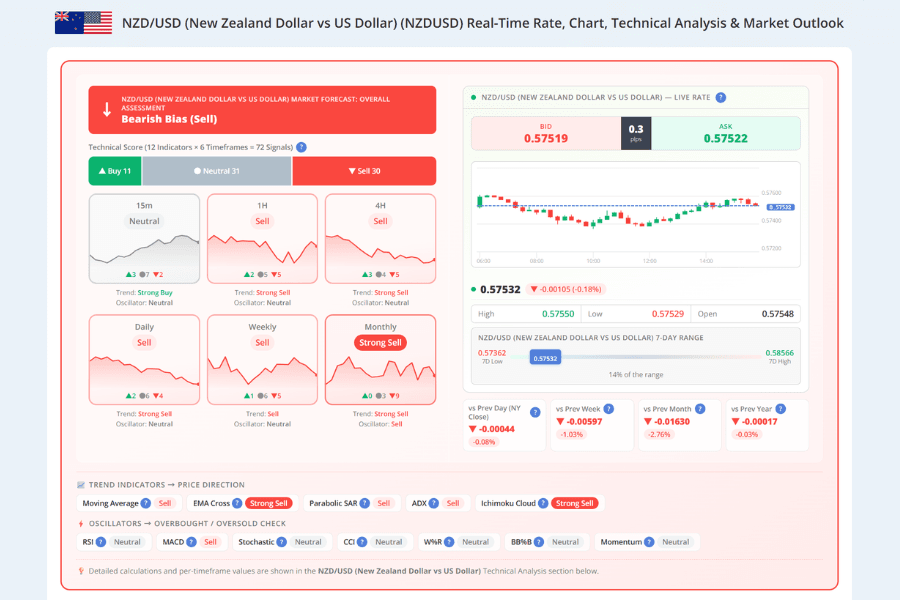
Trading hours
New Zealand is the first forex market to open each week; trading begins on Monday morning in Wellington. New Zealand's economic data and RBNZ decisions are released during the Asian session. Volume is larger in the European and US sessions, but the moves there are driven mostly by the US dollar and overall risk sentiment. The character of each session is covered in Forex Trading Hours.
Around the Monday open and in the early hours outside the Asian session, liquidity in NZD pairs thins out, spreads widen temporarily, and major news can produce gaps. Factor this in before holding a position over the weekend.
Costs and risks
Holding a position overnight incurs a swap. The swap on an NZD pair depends not only on the two countries' rate gap but also on the broker's adjustments, so treat the daily figures in the swap calendar as the actual sign and amount. The rate gap is a common source of return in NZD trading, but when risk sentiment turns, the exchange-rate loss usually dwarfs the interest earned.
The NZD is more volatile than most major currencies, especially around GDT auctions, RBNZ decisions, and Chinese data releases. Checking event times in advance on the economic calendar and sizing positions to the volatility is basic discipline for trading the NZD. To judge the NZD's own strength, the Currency Strength Meter compares it with the other seven major currencies separately, so you do not mistake a US dollar move for an NZD move.
7. New Zealand Dollar FAQ
Q1: Are the New Zealand dollar, the NZ dollar, and the Kiwi the same currency?
Yes. All three names refer to New Zealand's legal tender, code NZD. "NZ dollar" is simply the short form, and "Kiwi" is the market's nickname. The currency you see on bank rate boards, forex platforms, and in the news is the same one.
Q2: Why is the NZD called the Kiwi?
Because the one-dollar coin carries New Zealand's national bird, the kiwi. Over time the market adopted the name for the currency, and the NZD/USD pair is often called the Kiwi as well. It belongs to the same family of nicknames as the Aussie for the Australian dollar and the Loonie for the Canadian dollar.
Q3: What mainly moves the NZD exchange rate?
Five things: the RBNZ's Official Cash Rate and rate expectations, inflation and economic data, dairy export prices (the GDT auctions), demand from China and the other main export markets, and the US dollar together with global risk sentiment. Compared with the US dollar, the euro, and the yen, the NZD market has less depth, so price swings can be larger when liquidity is thin or around events.
Q4: Why do the NZD and the AUD so often move together?
Because New Zealand and Australia both depend on commodity exports to China, run on similar economic cycles, and their central banks often lean the same way, the two currencies have been highly positively correlated for a long time. NZD/USD and AUD/USD usually move in the same direction, and the relative strength of the two shows up in AUD/NZD. Holding both in the same direction can leave you heavily exposed to the same US-dollar, commodity, and risk-sentiment factors, so count them together when sizing positions.
Q5: Is the NZD suitable for carry trades?
It depends on the rate gap at the time. The NZD was for many years one of the higher-yielding major currencies, and NZD/JPY is a classic carry pair, but the gap changes with policy: when the OCR fell to 2.25% in 2025 the yield advantage shrank noticeably, and it only began to recover with the hikes of 2026. The main risk in a carry trade is the exchange rate itself; in a risk-off episode, the NZD can give back months of interest income in a matter of days.
8. Conclusion
The NZD's fundamentals can be understood along four lines: dairy and other export prices affect trade income, the RBNZ's OCR affects rates and market expectations, China and the other main export markets affect external demand, and global risk sentiment affects investors' appetite for risk-sensitive currencies like the NZD. All four can be tracked through public data, each on a known release schedule.
In trading, separate the US-dollar-side and NZD-side drivers when analyzing NZD/USD; use AUD/NZD to watch the relative strength of New Zealand and Australia, and NZD/JPY to watch shifts in the rate gap and risk sentiment. The NZD moves more than most major currencies, so checking event times in advance and sizing positions to the volatility is what turns its liveliness into an advantage rather than a risk.
Further Reading
- What Is AUD/USD and How to Trade It? A Beginner's Guide
- RBA (Reserve Bank of Australia)
- Forex Fundamental Analysis: Concepts, Objectives, Influencing Factors, and Analytical Methods
- How to Choose a Currency Pair: Screening with the Currency Strength Meter and Four More Tools
- How to Check Swap Points: Reading the Columns, the Triple-Charge Day and Holding Cost
Titan FX Trading Strategy Lab. We produce investor-education content covering forex, commodities (crude oil, precious metals, agricultural goods), stock indices, US equities, and digital assets.
Primary Sources (by Category)
- Central bank and policy: Reserve Bank of New Zealand (RBNZ) — OCR decisions (raised to 2.50% on July 8, 2026 and to 2.75% on September 2, 2026), the 2026–2027 decision calendar, the OCR framework and inflation target, and the history of the monetary policy framework
- Official statistics: Stats NZ — Overseas merchandise trade, June 2026 (annual exports of NZ$84.0 billion, ranking of export markets, dairy exports); Ministry for Primary Industries (MPI) — Situation and Outlook for Primary Industries, June 2026 (food and fibre exports of NZ$64.3 billion, dairy NZ$28.6 billion)
- Market structure: Bank for International Settlements (BIS) — 2025 Triennial Central Bank Survey of foreign exchange markets (NZD turnover and share); Global Dairy Trade — auction mechanism and price index