

What Is the Gold-Silver Ratio? Historical Ranges, Drivers, and How to Trade It
- The gold-silver ratio is the gold price divided by the silver price — about 66 as of August 2026
- The long-term normal band is roughly 55-80; extremes hit 125 in March 2020 and 31 in 2011
- The ratio works as a gauge of monetary fear versus industrial demand
- A high ratio means silver is relatively cheap; a low ratio means gold is relatively cheap
- Mean reversion has no timetable: watch structural drift, carry costs, and silver volatility
1. What Is the Gold-Silver Ratio?
The gold-silver ratio is the price of gold divided by the price of silver — the number of ounces of silver it takes to buy one troy ounce of gold. With gold at $4,650 and silver at $70, the ratio is about 66: one ounce of gold is worth roughly 66 ounces of silver.
There is no "correct" level for the ratio. Its value lies in relative comparison: placing today's reading inside its historical range tells you which metal is relatively expensive and which is relatively cheap. You can check the live reading and its history on the Titan FX gold-silver ratio tool, which is calculated from the daily closes of XAUUSD and XAGUSD on Titan FX.
2. Historical Ranges: What Counts as High or Low
For most of the past few decades the ratio has traded inside a 55-80 band — call it the normal zone. What matters are the departures from it:
| Period | Ratio | Background |
|---|---|---|
| April 2011 | ~31 (historic low) | Silver mania; silver approached $50 |
| March 2020 | ~125 (all-time extreme)* | Pandemic panic: money fled to gold while silver crashed with risk assets |
| 2025 | Peak ~105 | Gold led on central-bank buying and safe-haven demand; silver lagged |
| Early 2026 | Briefly ~45 | A sharp silver rally compressed the ratio |
| August 2026 | ~66 | Silver stabilized; the ratio returned to the normal zone |
*The 2020 figure comes from external historical data (our tool's chart does not cover 2020-2023).
A recurring pattern stands out: extremes are rarely about gold being "too expensive" — they happen when silver is oversold in a panic or snaps back in a catch-up rally. After the ratio topped ~105 in 2025, a silver surge driven by solar and semiconductor demand squeezed it to ~45 in early 2026 before it settled around 66 — both extremes inside a single year.
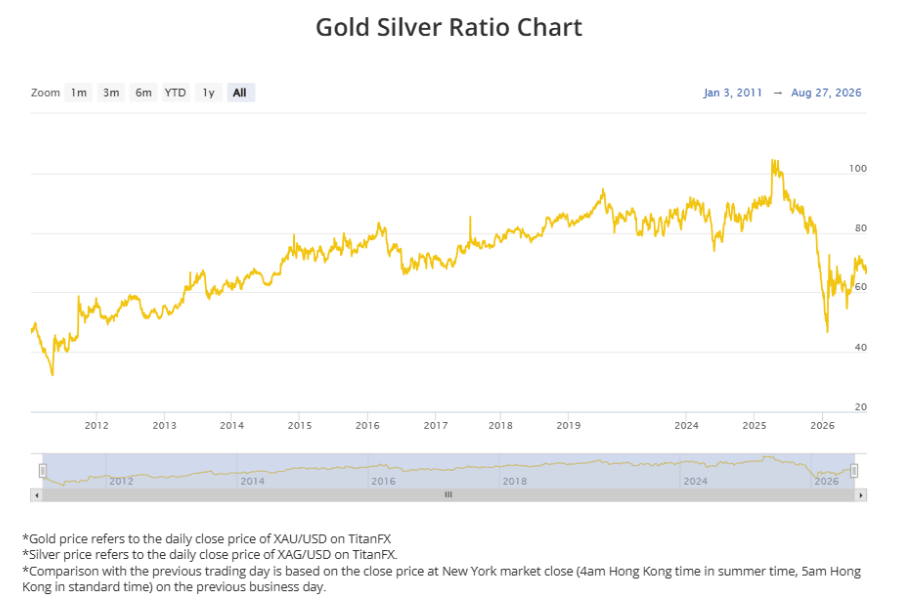
You do not need precise numbers — just three layers: 55-80 is normal, above 90 silver looks clearly cheap, above 120 is a historic extreme.
3. What Drives the Ratio?
The key is that gold and silver have very different personalities:
- Gold is a monetary asset. Its price is set mainly by safe-haven demand, US real yields, the dollar, and central-bank buying; industrial use is marginal.
- Silver is half an industrial metal. Solar panels, semiconductors, and EVs account for over half of demand, so silver tracks the business cycle — and swings harder than gold.
That difference dictates how the ratio moves:
- Panic and recession push the ratio up: money hides in gold while silver sells off on industrial-demand fears (March 2020 is the textbook case).
- Recovery and industrial booms pull it down: reviving demand lifts silver, and its smaller market means it typically outruns gold (the 2025-2026 solar and chip-driven silver rally).
In short, the ratio is a gauge of monetary fear versus industrial appetite. Mine supply (most silver is a by-product of copper, lead, and zinc mining, so supply reacts slowly to price) and futures positioning also matter — track the latter with the gold COT report and silver COT report.
4. How to Read Relative Value with the Ratio
A practical reading comes in three steps:
Step 1: locate the current value inside the range. Open the gold-silver ratio tool: it shows the live ratio calculated from Titan FX daily closes, the change versus the prior session, and the historical chart below.
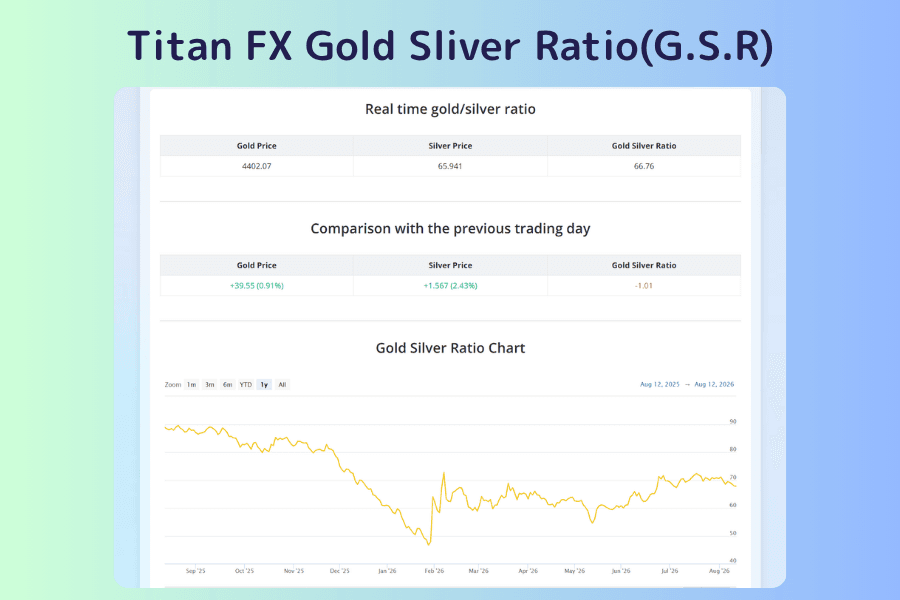
Step 2: check the trend. A high ratio still rising means the panic or gold-led move is not over — do not rush to fade it. Only when the ratio rolls over from a peak can you read it as "silver's discount is starting to close."
Step 3: confirm with fundamentals. A decline backed by improving industrial demand (solar installations, a chip-cycle upturn) or fading risk aversion is far more durable than a purely technical bounce.
One caution: "silver is relatively cheap" does not mean "silver will rise." The gap can also close through gold falling. The ratio describes the relationship between the two metals, not an absolute direction.
5. Trading the Ratio: The Mean-Reversion Strategy
Because the ratio tends to gravitate back toward its band, it supports a classic relative-value (mean-reversion) trade:
| Setup | Position | Logic |
|---|---|---|
| Ratio at a historic high (90+) and rolling over | Long XAGUSD + short XAUUSD | Bet on silver catching up; profit as the ratio falls |
| Ratio at a historic low (40 or below) | Long XAUUSD + short XAGUSD | Bet on gold catching up; profit as the ratio rises |
The paired structure hedges out the overall direction of precious metals — whether both metals rise or fall, the trade wins if the ratio converges as expected. A simpler one-leg version (for example, just buying silver as a high ratio rolls over) carries more directional risk but is cheaper and easier to run.
When executing with CFDs, size the two legs by roughly equal notional value, not equal lots, or the hedge will be lopsided. The margin calculator helps with position sizing.
6. Risks and Limitations
The strategy looks conservative, but the risks are real:
- The ratio can stay stretched for years. Silver has moved from the monetary era into the industrial era, so the "average" itself drifts over time — reversion has no timetable. The ratio held above 80 for more than two years in 2018-2020.
- Carry costs eat returns. A pair trade ties up double margin, and swap charges on the short leg add up over long holding periods. Check both instruments' swap terms before entering.
- Silver is far more volatile than gold. In stressed markets its daily swings can be more than twice gold's, so the silver leg needs stricter stop discipline.
- Extremes can get more extreme. In March 2020 the ratio blew through an "already high" 100 to reach 125. Fading a panic requires surviving further expansion first.
Trade Precious Metal CFDs with Titan FX
Titan FX offers gold, silver, platinum and palladium CFDs — up to 1,000:1 leverage on gold (XAU/USD) and 500:1 on silver and others, with tight spreads and long/short flexibility.
7. FAQ
Q1. What is a normal gold-silver ratio?
Roughly 55-80, where it has spent most of the past few decades. Above 90, silver looks clearly cheap relative to gold; above 120 is a historic extreme (about 125 in March 2020). Below 40, gold is the relatively cheap metal (about 31 in 2011, about 45 in early 2026).
Q2. Should I buy silver whenever the ratio is high?
Not automatically. A high ratio only says silver is cheap relative to gold — the gap can close through gold falling, and the ratio can stay high or go higher for a long time. Wait for the ratio to turn down and confirm with fundamentals such as industrial demand or easing risk aversion.
Q3. How do I actually trade the ratio?
The ratio itself is not a tradable instrument. It is expressed by trading both metals: for example, at a high ratio, long XAGUSD and short XAUUSD with roughly equal notional value to hedge direction. A single-leg trade is possible but carries more directional risk.
Q4. Why did the ratio spike to 125 in March 2020?
In the initial pandemic panic, money rushed into gold while silver was dumped alongside risk assets on fears of collapsing industrial demand. The two metals moved in opposite directions, driving the ratio to a record. Massive stimulus then fueled a silver rebound that brought the ratio back down.
Q5. Is the ratio useful for short-term trading?
No. Its mean reversion plays out over months or years, and short-term moves are close to random. Treat it as a medium- to long-term allocation and relative-value gauge — for short-term traders it is at best a supplementary sentiment thermometer.
8. Conclusion
The gold-silver ratio is the price of gold expressed in ounces of silver — a gauge of monetary fear versus industrial appetite. Panic pushes it up; industrial booms pull it down. Read it in three steps — position in the range (normal zone 55-80, about 66 in August 2026), then trend, then fundamentals — and it becomes a practical relative-value compass. Just remember: reversion has no deadline, and carry costs and silver's volatility are part of the trade. Start by getting familiar with the live reading and history on the gold-silver ratio tool.
Further Reading- What Is Silver vs US Dollar (XAGUSD)? A Complete Trading Guide
- What Is Gold CFD Trading?
- Gold COT Report
- Silver COT Report
Titan FX Trade Strategy Research Lab covers forex (FX), commodities (oil, precious metals, agricultural products), stock indices, US equities, and crypto assets — producing educational content for retail investors across asset classes.
Primary Sources (by Category)
- Official and market data: LBMA precious metals prices; CME gold and silver futures specifications; CFTC Commitments of Traders reports
- In-house tools: Titan FX gold-silver ratio tool; XAU/USD and XAG/USD live charts
- Educational resources: Investopedia and BabyPips guides on the gold-silver ratio and relative-value trading