Gini Coefficient
The Gini coefficient measures how unevenly income or wealth is distributed across a population. A value closer to 0 suggests more equal distribution, while a value closer to 1 signals greater concentration.
This article explains how the Lorenz curve is used to understand the Gini coefficient, how to read the levels, and why inequality can affect consumption, GDP, policy risk and financial markets.
- What the Gini coefficient measures and how to read 0 to 1
- How the Lorenz curve explains the calculation
- How inequality affects consumption, GDP and policy risk
- What investors should avoid when using the Gini coefficient
1. What Is the Gini Coefficient?
1-1. Origin and Core Concept
The Gini Coefficient was introduced by the Italian statistician Corrado Gini in the early 20th century to measure inequality in income or wealth distribution.
Its focus is not on how fast an economy grows, but on whose hands the growth actually lands in.
If a country's income were perfectly equal, everyone earning the same, the Gini is 0. If income is heavily concentrated in a small group with everyone else earning very little, it approaches 1 (sometimes 100 in a 0–100 scale).
- Higher = wider gap
- Lower = more even distribution
What makes the indicator important is that it highlights a fact that's often missed: GDP can rise without society becoming more balanced.
1-2. Lorenz Curve and Calculation Principle
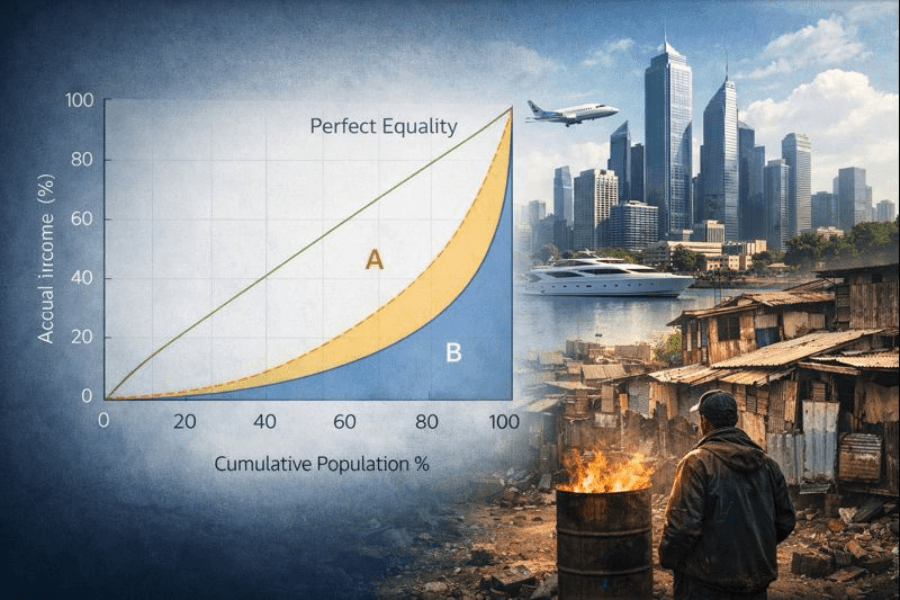
The core of the Gini Coefficient comes from the "Lorenz Curve."
Picture the whole population ranked from lowest to highest income:
- X-axis: cumulative share of population
- Y-axis: cumulative share of income
If income were perfectly equal, the curve is a 45-degree line, 20% of people hold 20% of income, 50% hold 50%, and so on.
The real world does not look like that. The actual curve bends downward, showing income concentrating into higher-income groups.
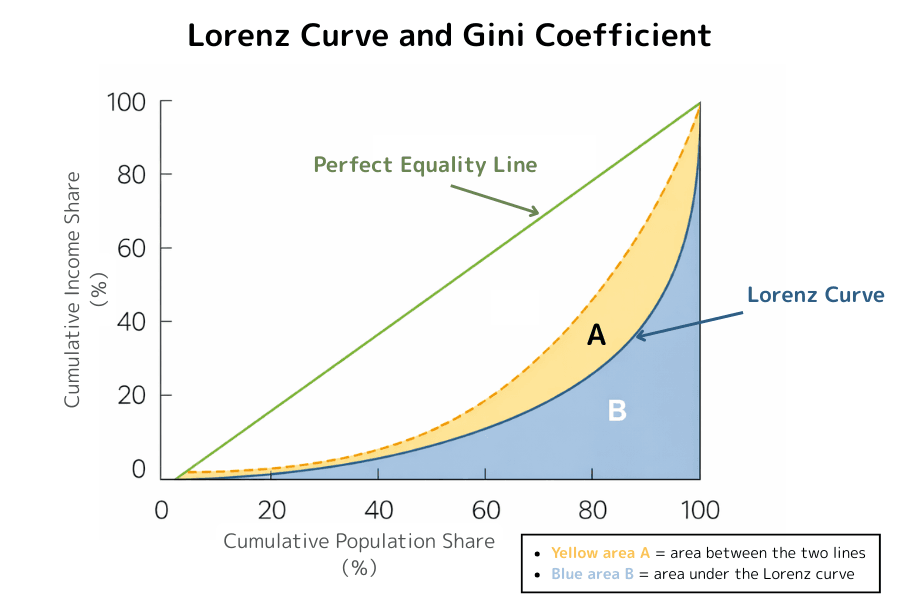
What the Gini Coefficient measures is the gap between the "ideal equality line" and the "actual income curve".
Simplified:
Gini = A ÷ (A + B)
Where:
- A: area between the equality line and the actual curve
- B: area under the actual curve
If the two lines overlap, A is 0 and the Gini is 0. The wider the gap, the larger A relative to B, and the closer the Gini gets to 1.
It is not counting how many rich people there are; it is measuring how much overall distribution deviates from equal. That's why it has become the most common international tool for comparing inequality.
1-3. Reading the Ranges
There is no absolute standard, but market research commonly groups the ranges as:
| Gini Coefficient | Distribution | Structural Implication |
|---|---|---|
| 0–0.3 | Relatively even | Higher social stability |
| 0.3–0.4 | Reasonable gap | Common across mature economies |
| 0.4–0.5 | Wider gap | Rising policy/social pressure |
| 0.5+ | Highly unequal | Potential structural risk heating up |
Note that tax systems and social welfare clearly affect the number. "Pre-tax" vs "after-tax" Gini often differ in the same country, reflecting the effect of government redistribution policy.
2. The Coefficient and Macroeconomic Structure
The Gini Coefficient isn't just a social metric, it mirrors an economy's industrial structure and stage of development.
As economies transition from agriculture to industry and on to services and finance, distribution changes tend to be structural rather than linear.
2-1. Early Development: Gaps Widen
In takeoff phases, capital and technology concentrate in a few cities and industries.
People who enter high-value industries first see their incomes grow much faster than others. Gaps widen quickly across regions, skill sets, and capital holders.
A rising Gini in this phase is a byproduct of economic transition.
That's why many fast-growing emerging markets also grapple with worsening inequality.
2-2. Policy Adjustment and Redistribution
Once the economy stabilizes, governments typically use tax and public spending to adjust:
- Progressive income tax
- Social insurance
- Public investment in education and health
This "rise then fall" pattern fits the inverted-U hypothesis proposed by economist Simon Kuznets.
But it is not a guaranteed path. In highly financialized environments with rising asset prices, the gap can widen again.
2-3. Capital Returns and Industry Structure
Deeper down, the Gini Coefficient reflects the split between "labor income" and "capital income."
The more an economy depends on:
- Tech and platform industries
- Financial-market expansion
- Rising asset prices
The larger the benefit for asset owners, while pay-only earners see relatively limited gains. That structural difference tends to push up inequality.
In other words, behind the Gini Coefficient sits the combined outcome of industry concentration, capital-market depth, and institutional design.
It is both a social issue and a snapshot of economic maturity and policy balance capability.
3. What Happens to Markets When Income Gaps Widen?
A higher Gini looks like a statistic, but it quietly reshapes market structure.
As income concentrates in higher earners, the fruits of growth stop flowing evenly. The extra income of high earners flows more into savings and investment than into daily consumption. If spending among middle and lower earners stagnates, domestic-demand momentum becomes asymmetric.
The result is often "bifurcated consumption": premium brands, luxury services, and asset-management industries thrive on one side, while mass-market competition intensifies and margins compress on the other. Corporate profit mixes change, and capital naturally gravitates to industries with pricing power and asset characteristics.
As capital concentrates, financial markets tend to benefit first. Stocks, real estate, and private markets are better able to absorb excess liquidity, lifting asset prices. That boom can look like economic strength, but it doesn't always sit on broad-based income growth, sometimes it sits on the expanding balance sheets of asset owners.
A gap by itself doesn't always create immediate risk. But when social perception diverges from data, the probability of policy intervention rises. Tax hikes, regulation, minimum-wage adjustments, and wealth redistribution all become political options. For markets, this is often where real uncertainty originates.
Distribution structure eventually shows up in markets through consumption, asset prices, and policy direction.
4. Blind Spots Beyond the Number
As widely used as it is, the Gini Coefficient is not a full-picture answer.
It measures "ratio," not "living standard." A society can be relatively evenly distributed yet have low overall incomes; another can have a wider gap but most people live decently. The Gini number alone cannot draw complete conclusions about wellbeing or prosperity.
It is also not particularly sensitive to changes in the middle class. Market stability often depends on a large middle layer, but the Gini more easily reflects how far apart the two ends stretch rather than whether the middle is shrinking.
Another commonly overlooked point: most statistics use "income" rather than "wealth." In environments where asset prices rise for years, the wealth gap can widen faster than the income gap. Focusing only on an income-based Gini risks underestimating latent imbalance.
So treat the Gini Coefficient as a starting point for structural observation, not a conclusion. It reminds you to pay attention to how growth is distributed, but to understand a society's real condition you still need other indicators and a longer-term view.
5. Conclusion
The Gini Coefficient matters not because it forecasts recession or tells you whether the stock market will rise.
What it really reveals is a deeper question: whether the fruits of economic growth are being widely shared.
When the gap remains manageable, markets can keep progressing through innovation and efficiency. But when income and wealth concentrate for too long, the tension between growth and stability gradually surfaces.
For investors, a high Gini Coefficient can signal asset-market booms and capital returns, while also meaning that policy-pivot and structural-adjustment risks are accumulating.
This is a structural issue, not a moral one.
- A healthy economy needs growth
- A stable society needs distribution
The Gini Coefficient doesn't give standard answers. It offers a vantage point. When the number drifts far from balance for long, markets typically respond through policy, price, or cyclical adjustments.
Further Reading
- What Is Engel's Coefficient?
- What Is the Depression Effect?
- What Is the Effective Exchange Rate?
- What Is the Greater Fool Theory?
Titan FX's financial market research and analysis team produces investor education content across a wide range of financial instruments, including foreign exchange (FX), commodities (crude oil, precious metals, and agricultural products), stock indices, U.S. equities, and crypto assets.
Primary Sources by Category
- Income-distribution and inequality statistics: World Bank, OECD, national statistical agencies.
- International-organization and macro materials: IMF, United Nations statistical materials.
- Supporting data: FRED and public statistical databases.