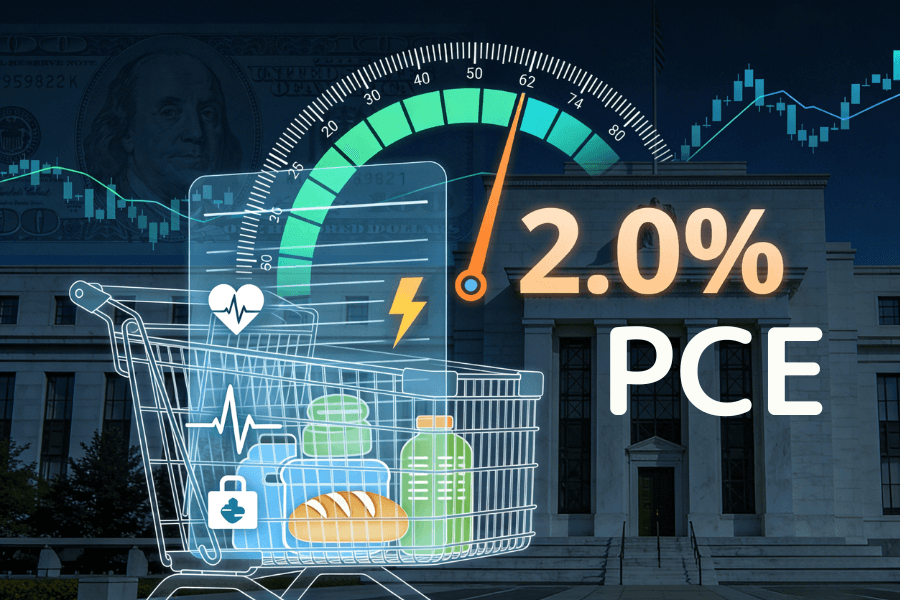
PCE (Personal Consumption Expenditures Price Index)
In debates over US inflation and rate policy, the PCE Price Index comes up again and again from the Federal Reserve and the market — its importance arguably exceeds the CPI that most investors know better. This is not because PCE data is more "sensitive," but because, by design, it sits closer to actual consumer behaviour and better fits the needs of policy judgment.
For investors, the real value is not memorising the number from one PCE release, but understanding why the Fed chooses PCE as its inflation compass, and how the market revises rate expectations through PCE. Once you grasp this, PCE stops being a term in a headline and becomes a key indicator for reading the direction of policy and the market's reaction.
This article starts with the basic definition of PCE, explains the difference between core and headline PCE, compares the structural design of PCE and CPI, explains why the Fed favours PCE, and summarises how the market reads it along with practical questions.
- PCE Price Index: An inflation gauge from the US Bureau of Economic Analysis (BEA) measuring overall price changes in households' actual consumption.
- Core PCE: The version excluding food and energy; less volatile, and the Fed's main gauge of the medium-to-long-term inflation trend.
- The Fed's 2% target: Refers specifically to core PCE at roughly 2% year-on-year — a key reference for the policy direction.
- PCE vs CPI: PCE weights adjust dynamically with consumer behaviour, capture the substitution effect, and cover more (including third-party-paid items like healthcare).
- How the market reads it: What matters is deviation from expectations and the 2% target, which revises rate-cut/hike bets and the US dollar.
1. What Is PCE? The Core Data for Reading Inflation's Temperature
Basic Definition: What the PCE Price Index Is
The PCE Price Index (Personal Consumption Expenditures Price Index), also called the personal consumption expenditures price index or the PCE deflator, is an inflation gauge compiled by the US Bureau of Economic Analysis (BEA). It measures the change in the overall price level when US households buy goods and services.
Unlike simply comparing listed prices, PCE focuses on price changes arising from "actual consumer behaviour," so it stays closer to the price pressure across the whole economy. In the Fed's policy analysis, PCE is treated as an important basis for assessing price stability and the inflation trend.
Scope: What PCE Actually Measures
The core concept of PCE is "consumption spending that actually occurs," not a single price on a household bill. As long as it is related to household consumption — whether paid by the consumer directly or covered by a third party — it may be included in PCE.
Take healthcare: the medical insurance premiums an employer pays for employees are not paid out of pocket by the individual, yet they are part of household consumption and are therefore counted in PCE. This coverage lets PCE reflect more fully the consumption structure actually operating in the economy — one reason it is so representative in inflation analysis.
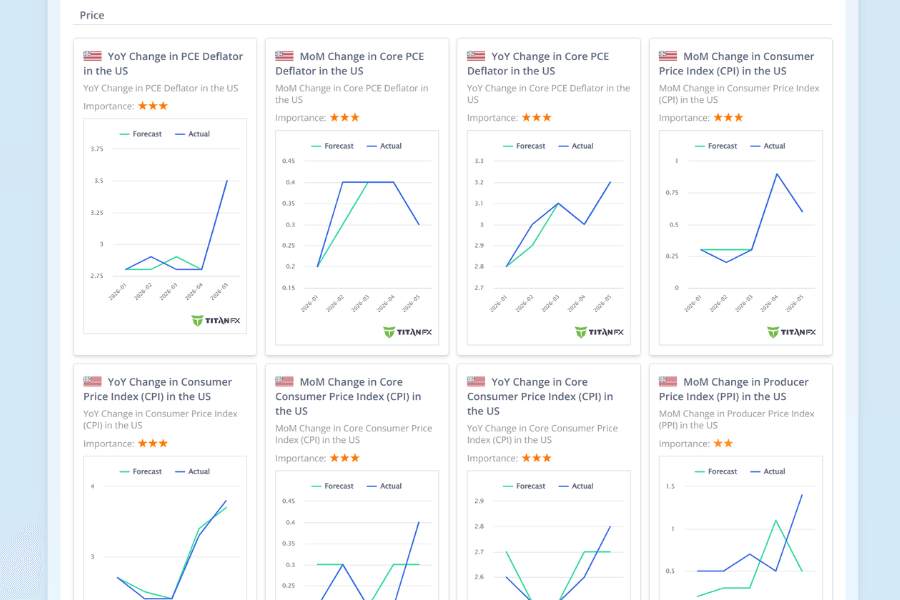
2. What Is the Difference Between Core PCE and Headline PCE?
Before reading PCE data, distinguishing "headline PCE" from "core PCE" helps avoid misjudging the inflation direction. The two measure the same target, but their uses and reading emphasis differ.
| Item | Headline PCE | Core PCE |
|---|---|---|
| Includes food and energy | Yes | No |
| Volatility | Higher, with clear short-term swings | Lower, with a relatively steady trend |
| Main focus | Actual cost-of-living pressure | Medium-to-long-term inflation trend |
| Policy relevance | Supporting observation | The Fed's main reference |
Headline PCE: The Inflation Gauge Reflecting Actual Spending Pressure
Headline PCE covers all consumption items, including food and energy prices, so it shows the price changes households actually face in daily life. When oil or food prices rise sharply, headline PCE usually reflects that pressure first, close to people's intuitive sense of living costs.
However, because food and energy prices are easily affected by weather, geopolitics, and short-term supply and demand, headline PCE swings more, and a short-term rise or fall does not necessarily mean the inflation trend has fundamentally changed.
Core PCE: A Tool for Watching the Medium-to-Long-Term Trend
Core PCE builds on headline PCE by excluding food and energy, aiming to reduce the noise of short-term price swings so the data better reflects structural inflation pressure.
This makes core PCE especially suited to watching whether inflation stays high or is cooling, rather than being swayed by a single month's price move.
3. Why Does the Fed Favour PCE Over CPI?
Before understanding the Fed's inflation judgment and rate decisions, you need to clarify the fundamental design differences between PCE and CPI. It is precisely these structural differences that give PCE higher reference value in policy analysis.
Key Differences Between PCE and CPI
The table below summarises the core differences between PCE and the CPI in compilation and purpose, quickly showing why they hold different positions in policy use.
| Item | PCE Price Index | CPI Consumer Price Index |
|---|---|---|
| Compiling agency | US Bureau of Economic Analysis (BEA) | US Bureau of Labor Statistics (BLS) |
| Weighting method | Adjusts dynamically with consumer behaviour | Fixed weights, adjusted less often |
| Measurement angle | Actual consumption spending | Household out-of-pocket spending |
| Housing-related weight | Relatively low | Relatively high |
| Role in Fed policy | Core policy gauge | Supporting observation gauge |
The Substitution Effect: PCE Is Closer to Actual Behaviour
One of the most important differences between PCE and CPI is whether they reflect adjustments in consumer behaviour — the often-cited "substitution effect."
When a good's price rises, consumers often switch to cheaper substitutes — for example, buying chicken when beef gets expensive. PCE weights adjust with these behavioural changes, so they reflect the shift in actual spending. By contrast, CPI weights are more rigid and, when prices move fast, may overstate inflation's real impact on living costs.
For policymakers, whether this behavioural change can be captured directly affects the read on inflation pressure.
A Consumption Structure with Broader Coverage
Another strength of PCE is that its scope sits closer to the overall economic structure. Beyond items households pay for themselves, PCE also includes third-party-paid spending, especially in healthcare.
Because healthcare is a large share of US consumption and most costs are not paid directly by individuals, PCE reflects price changes in the economic system more completely, avoiding the omission of key spending items. This is also an important consideration for the Fed when assessing inflation.
What the Fed's 2% Inflation Target Means
The Fed's long-term inflation target refers specifically to core PCE at roughly 2% year-on-year, not CPI or other inflation gauges. This figure is treated as a reference point for price stability and an important basis for the market's read on monetary policy.
So when the market watches PCE data, the focus is not only the level but whether core PCE keeps deviating from the 2% target range and whether the direction of that deviation is changing. This is exactly why PCE holds such a key position in policy communication and managing market expectations.
4. How Does the Market Read PCE Data?
More than the number itself, financial markets care whether PCE changes the existing inflation and rate expectations.
The Core: Whether the Data Deviates from Consensus
Before PCE is released, the market has usually formed a rough consensus through economic forecasts, official comments, and other inflation data. What really moves the market is whether the actual result is clearly above or below this expectation.
If the data moves only slightly and stays within what the market is mentally prepared for, the price reaction tends to be limited. Conversely, when the result breaks the prior view, it triggers a repricing of assets. That is why the same PCE year-on-year rate can spark completely different moves at different times.
A Common Reaction Pattern: Linked to Rate Expectations
In most cases, the market uses PCE data to reassess the Fed's policy stance.
When PCE comes in above expectations, it suggests inflation may be cooling more slowly than hoped; the market tends to read this as rates staying high for longer, the US dollar strengthening relatively, and stocks and bonds coming under pressure. Conversely, if PCE is below expectations, it is seen as a signal of slowing inflation, rate-cut expectations rise, and risk assets tend to find support more easily.
This reaction is not formulaic; it rests on the policy backdrop and market sentiment at the time.
PCE's Actual Position in the Market
In practice, PCE is not a standalone trigger that drives the market, but an important reference used to "correct direction." Investors usually watch PCE alongside employment data, wage growth, and Fed officials' comments to confirm whether the inflation trend is genuinely turning.
That is why PCE is more like a calibrator of rate expectations than the sole trigger of short-term moves.
5. Frequently Asked Questions About the PCE Price Index
Q1: When is PCE released?
PCE is usually released at the end of each month, covering the prior month's data. Because it comes out later than CPI, it is more of a policy-oriented reference indicator.
Q2: If PCE is released late, why is it still so important?
Although it is less timely, PCE carries greater weight in Fed policy. The market watches PCE not to trade first, but to judge whether the medium-term inflation trend has changed.
Q3: Do investors need to watch PCE every day?
No. PCE is suited to observing the inflation direction and policy environment, not for frequent short-term tracking. Most investors only need to interpret it on release, combining expectations and the trend.
Q4: Where can I find the latest PCE data?
Investors can check the latest PCE and core PCE data on the US Bureau of Economic Analysis (BEA) website — the most authoritative official source. You can also use the economic indicators list provided by Titan FX to quickly view US PCE, core PCE, and other key inflation indicators, and compare them with expectations and historical trends.
See US Personal Consumption Expenditures Price Index (PCE), year-on-year | Titan FX Economic Indicators
6. Summary
The PCE Price Index is not a tool for predicting short-term moves, but an important basis for the Fed's judgment of the inflation trend and rate policy. Its value lies in reflecting the actual consumption structure, capturing the substitution effect, and using core PCE as the policy reference point for price stability.
For investors, the key to understanding PCE is not the level of a single number, but watching whether core PCE keeps deviating from the Fed's 2% inflation target, and whether that deviation is widening or narrowing. These changes often affect the market's expectations for rate hikes or cuts more than the surface data does.
Read alongside other inflation, employment, and policy signals, PCE helps investors view market volatility more rationally and distinguish short-term noise from the medium-term trend. This is the real reason PCE is seen in financial markets as a "policy thermometer" rather than just an economic data point.
Further Reading
- What Is CPI (Consumer Price Index)?
- What Is Inflation?
- What Is the Fed (Federal Reserve)?
- What Is the US Dollar (USD)?
Titan FX Research. Investor-education content covering forex (FX), commodities (oil, precious metals, agricultural products), stock indices, US equities, and crypto assets across global markets.
Primary Sources by Category
- Official data: US Bureau of Economic Analysis (BEA) PCE statistics; Federal Reserve FOMC statements and Summary of Economic Projections (SEP)
- Comparison gauge: US Bureau of Labor Statistics (BLS) CPI data
- Market data: Titan FX economic indicators page; PCE commentary from major financial media