What Is the S&P/TSX 60 Index (CAN60)? Components & Trading Guide
CAN60 is the flagship index tracking the performance of the Canadian stock market. Launched by S&P Dow Jones Indices in 1998, it comprises the 60 largest and most liquid companies listed on the Toronto Stock Exchange (TSX). From Royal Bank of Canada and Enbridge to Shopify, these constituents span 11 major sectors including financials, energy, and materials, representing approximately one-third of the total Canadian stock market capitalization.
For CFD traders, CAN60 offers the most direct channel for participating in the Canadian market. The index is driven by multiple factors including global commodity prices, Bank of Canada monetary policy, U.S.-Canada trade relations, and the Canadian dollar exchange rate, providing abundant trading opportunities. This article provides a comprehensive analysis of CAN60's trading logic, covering the index definition, constituents, price drivers, and practical trading methods.
What Is the S&P/TSX 60 Index (CAN60)?
The S&P/TSX 60 Index is a Canadian stock market benchmark launched in 1998 by S&P Dow Jones Indices, one of the world's leading index providers. In CFD trading, the S&P/TSX 60 Index uses CAN60 as its trading symbol.
The index selects the 60 largest and most liquid companies listed on the Toronto Stock Exchange (TSX), covering 11 major sectors including financials, energy, materials, industrials, and utilities. It represents approximately one-third of the total Canadian stock market capitalization and serves as a key indicator for measuring the core performance of the Canadian economy.
| Item | Details |
|---|---|
| Official Name | S&P/TSX 60 Index |
| Trading Symbol | CAN60 (CFD) |
| Launch Year | 1998 |
| Index Provider | S&P Dow Jones Indices |
| Weighting Method | Free-float market capitalization weighted |
| Number of Constituents | 60 |
| Review Frequency | Quarterly |
All CAN60 constituents are listed on the Toronto Stock Exchange and denominated in Canadian dollars. Unlike the U.S. S&P 500 (US500), which tracks large-cap U.S. companies, CAN60 focuses on core blue-chip stocks listed in Canada, directly reflecting the Canadian economic structure where financials and energy dominate.
Index Methodology and Constituents
Selection Criteria
CAN60 constituent selection follows these criteria:
| Criteria | Description |
|---|---|
| Registration | Must be registered in Canada and listed on the TSX |
| Market Cap Threshold | Based on volume-weighted average price (VWAP) over the preceding 10 trading days, must represent at least 0.04% of the index's total market value |
| Liquidity Requirement | Annualized turnover ratio must reach 0.50 (0.25 for dual-listed stocks) |
| Quarterly Review | Constituent adjustments conducted quarterly, with results announced within 10 days of review |
Representative Constituents by Sector
CAN60 covers the core sectors of the Canadian economy. Below are representative companies from each sector.
Financials
The financial sector carries the largest weight in CAN60 at approximately 30-35%:
| Company | Sub-sector |
|---|---|
| Royal Bank of Canada (RBC) | Commercial Banking |
| Toronto-Dominion Bank (TD) | Commercial Banking |
| Bank of Nova Scotia (Scotiabank) | Commercial Banking |
| Bank of Montreal (BMO) | Commercial Banking |
| Canadian Imperial Bank of Commerce (CIBC) | Commercial Banking |
| Manulife Financial | Insurance/Financial Services |
| Sun Life Financial | Insurance/Financial Services |
| National Bank of Canada | Commercial Banking |
Energy
| Company | Sub-sector |
|---|---|
| Enbridge Inc. | Pipeline Transportation |
| Canadian Natural Resources | Oil & Gas |
| Suncor Energy | Oil & Gas |
| TC Energy Corporation | Pipeline Transportation |
Materials
| Company | Sub-sector |
|---|---|
| Barrick Gold Corporation | Gold Mining |
| Nutrien Ltd. | Agricultural Fertilizers |
| Teck Resources Limited | Diversified Mining |
Industrials
| Company | Sub-sector |
|---|---|
| Canadian National Railway (CN) | Rail Transportation |
| Canadian Pacific Kansas City (CPKC) | Rail Transportation |
| Thomson Reuters Corporation | Information Services |
| Waste Connections Inc. | Waste Management |
Consumer & Technology
| Company | Sub-sector |
|---|---|
| Loblaw Companies | Retail |
| Alimentation Couche-Tard | Convenience Stores |
| Canadian Tire Corporation | Retail |
| Shopify Inc. | E-commerce Technology |
Telecommunications
| Company | Sub-sector |
|---|---|
| BCE Inc. | Telecommunications |
| Rogers Communications | Telecommunications |
The above represents 25 key constituents. The complete 60-stock list is available from S&P Dow Jones Indices or Globe and Mail.
Sector Composition Characteristics
CAN60's sector composition distinctly reflects Canada's resource-driven economic profile:
-
Financial sector dominance: Banks and insurers led by RBC and TD account for approximately 30-35% of the index weight, reflecting Canada's robust financial system
-
Energy and materials dependency: Energy stocks such as Enbridge and Suncor, along with materials stocks such as Barrick Gold, hold significant weight, making the index highly correlated with global commodity prices
-
Sector diversification: Covering 11 major sectors, the index provides risk-dispersed investment opportunities
-
International connectivity: Most constituents are multinational enterprises with high correlation to U.S. and global markets
Key Price Drivers
1. Global Economy and Commodity Prices
Canada is a major exporter of energy and raw materials, making CAN60 highly sensitive to movements in oil, natural gas, and metals prices.
- Rising oil prices directly benefit energy constituents (such as Enbridge, Suncor), pushing the index higher
- Increases in metals and agricultural commodity prices boost the materials sector (such as Barrick Gold, Nutrien)
- Global economic conditions affect commodity demand, indirectly influencing CAN60's trajectory
2. Canadian Domestic Economy
GDP, employment rates, consumer confidence, and other macroeconomic data affect financial and consumer sector performance.
- Domestic infrastructure investment policies support revenue growth for industrial stocks (such as CN, CPKC)
- Increased consumer spending drives the retail and consumer goods sectors
3. U.S. Economic Dynamics
The United States is Canada's largest trading partner, with approximately 75% of Canadian exports flowing to the U.S.
- U.S. economic growth drives export demand for Canadian energy and materials companies, pushing the index upward
- U.S. recession or trade policy changes (such as steel and aluminum tariffs) may suppress CAN60 performance
- Many constituents (such as CN, Shopify) have significant U.S. operations or are dual-listed, meaning U.S. market performance directly affects their earnings
4. Monetary Policy and Exchange Rates
The Bank of Canada's (BoC) interest rate policy and the CAD/USD exchange rate influence corporate financing costs and export competitiveness.
- CAD depreciation benefits export-oriented companies (energy, materials) but increases import costs
- CAD appreciation favors importers but may weaken export competitiveness
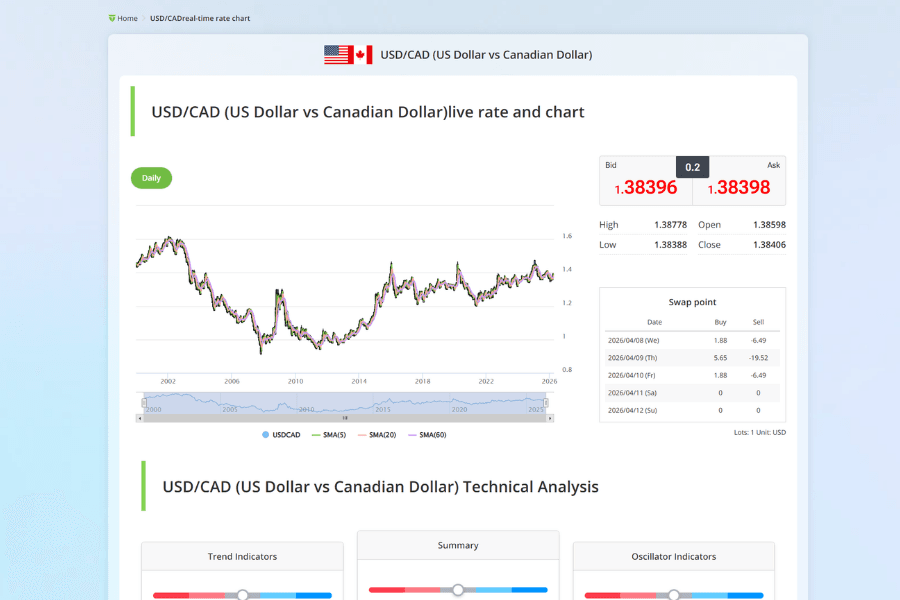
The USD/CAD exchange rate is a key reference for assessing Canadian dollar strength and Canada's export competitiveness. Federal Reserve interest rate policy also indirectly affects the USD/CAD rate, which in turn impacts CAN60 constituent earnings.
5. Market Capital Flows
- Foreign investor inflows into Canadian financial and energy sectors drive the index upward
- Global investor sentiment affects capital allocation to North American markets
- U.S. and Canadian economic cycles are highly synchronized, with U.S. prosperity driving Canadian corporate earnings growth
Use Titan FX's Economic Calendar to track the release times and market expectations of important Canadian and U.S. economic data in real time.
Index Comparison and Trading Strategies
CAN60 vs US500 vs US30
| Item | CAN60 (S&P/TSX 60) | US500 (S&P 500) | US30 (Dow Jones Industrial Average) |
|---|---|---|---|
| Constituents | 60 large-cap Canadian companies on TSX | 500 large-cap U.S. companies | 30 blue-chip U.S. companies |
| Sector Focus | Financials (30-35%), Energy, Materials | Technology (30%+), Healthcare, Financials | Industrials, Financials, Technology |
| Commodity Sensitivity | High (large energy + materials weighting) | Medium-low | Low |
| Currency Factor | CAD-denominated, affected by USD/CAD | USD-denominated | USD-denominated |
| Volatility | Medium | Medium | Medium |
| Titan FX Symbol | CAN60 | US500 | US30 |
Key Trading Strategies
-
Commodity correlation: CAN60 has a high correlation with oil and gold price movements. Rising oil price cycles typically benefit CAN60, and combining energy market analysis with index trading can yield effective strategies
-
U.S.-Canada economic cycle: As Canada's largest trading partner, U.S. economic expansion typically drives Canadian corporate revenue growth, pushing CAN60 higher. Conversely, a U.S. economic slowdown creates downward pressure
-
Currency dynamics: When the CAD depreciates, Canadian exporters benefit, and CAN60's energy and materials sectors may strengthen. When the CAD appreciates, import-related consumer stocks may outperform
-
North American market linkage: CAN60 shows relatively high correlation with U.S. stock indices (US500, US30), and global risk events have a transmission effect across North American markets
How to Trade CAN60 on Titan FX
On the Titan FX platform, the S&P/TSX 60 Index is available under the trading symbol CAN60, supported on both MT4 and MT5 platforms. Trading is conducted as CFDs (Contracts for Difference) with leverage of up to 500x. You can also trade directly in your browser using WebTrader.
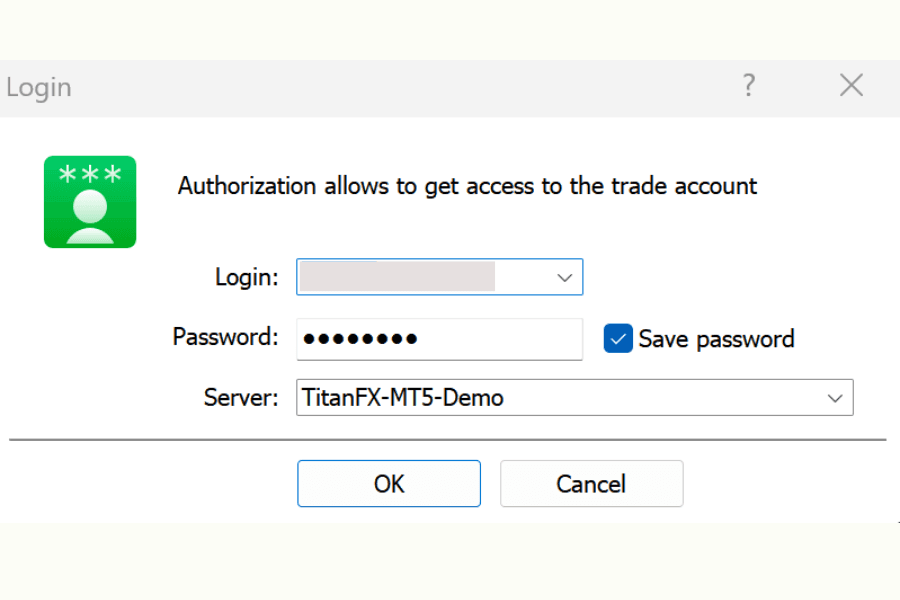
Step 1: Log in to Your Trading Account
Open a Titan FX trading account (Zero Standard or Zero Blade), complete the deposit, then download the MT4 or MT5 platform and log in with your account credentials.
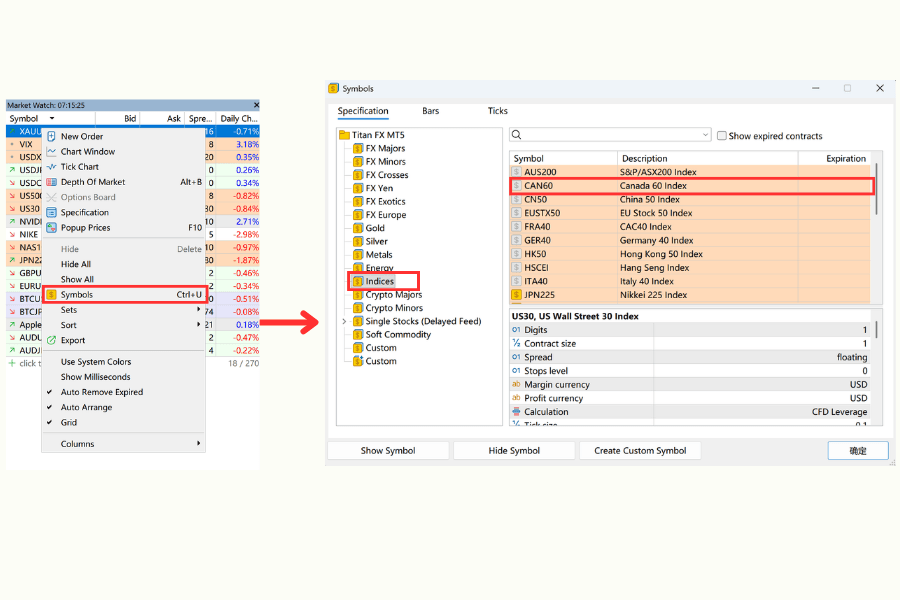
Step 2: Add CAN60 to Market Watch
Right-click in the Market Watch window, select "Symbols," expand the "Indices" category, find CAN60, and double-click to add it to your quotes list.
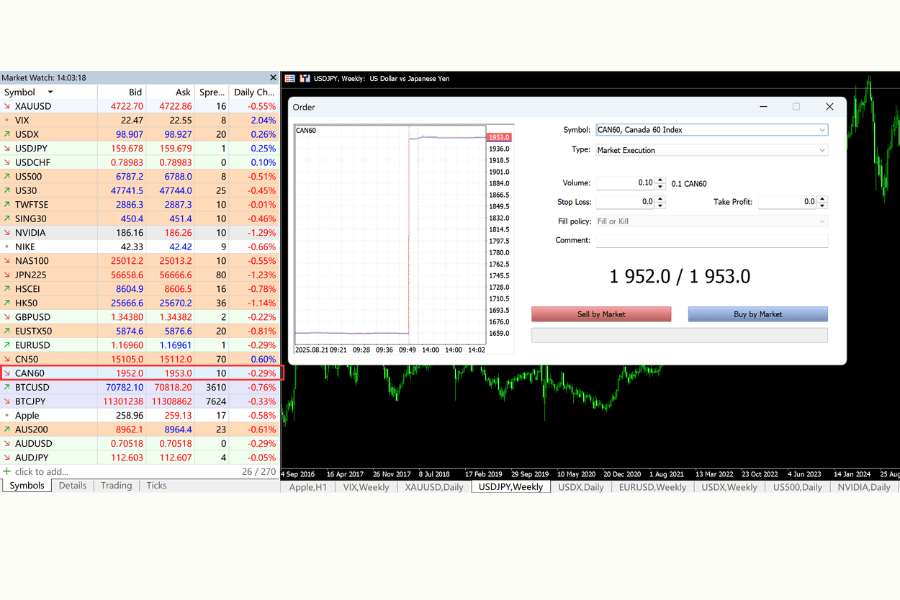
Step 3: Start Trading
Double-click the CAN60 quote or open a chart to access the order entry screen. Enter the lot size (minimum 0.01 lots), select buy or sell direction, set your stop loss and take profit, then execute the trade.
Titan FX offers a free demo account, allowing you to practice CAN60 trading and platform operations in a risk-free environment.
Trading Hours
CAN60 trading hours are divided into two sessions:
| Time Zone | Winter Time (GMT+2) | Summer Time (GMT+3) |
|---|---|---|
| MT4/MT5 Server | 09:00-16:15, 16:30-23:30 | 09:00-16:15, 16:30-23:30 |
| Taiwan/Hong Kong/Beijing (GMT+8) | 15:00-22:15, 22:30-05:30 next day | 14:00-21:15, 21:30-04:30 next day |
| Japan (GMT+9) | 16:00-23:15, 23:30-06:30 next day | 15:00-22:15, 22:30-05:30 next day |
Titan FX Analysis Tools
Titan FX provides a range of analysis tools to help traders assess CAN60's technical outlook:
- Support & Resistance: Identify key price levels for CAN60 to assess breakout or reversal potential
- Order Book (Position Info): View the distribution of pending orders and long/short ratios from other traders
- Trend Analysis: Determine whether CAN60 is in an uptrend, downtrend, or range-bound phase
- RSI Analysis: Identify overbought or oversold conditions to support reversal timing decisions
- Volatility Heatmap: Understand CAN60's volatility patterns across different trading sessions
- Percentage Change Ranking: Compare CAN60's real-time performance against other indices
- Swap Calendar: Check CAN60's overnight interest rates
- Dividend Calendar: Track the impact of constituent dividend ex-dates on CFD accounts
- Margin Calculator: Calculate required margin and appropriate position sizes
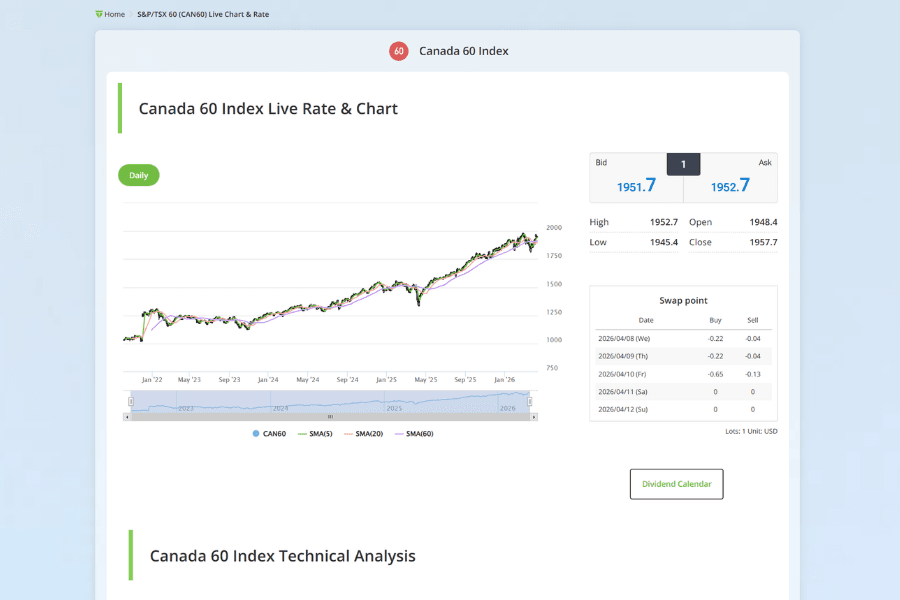
For the latest trading conditions and spreads, please refer to the official page.
For the latest trading conditions and live prices, please refer to the CAN60 instrument page.
Start Trading the CAN60 Index Trade CAN60 CFDs on Titan FX with up to 500x leverage, low spreads, and the flexibility to go long or short. Both Zero Standard and Zero Blade accounts support index CFD trading (Zero Micro accounts do not support index CFDs).
FAQ
What is the difference between the CAN60 Index and the S&P 500? Which is more suitable for Asian investors?
Both are large-cap indices, but their sector compositions differ significantly. CAN60 is dominated by financials and energy, reflecting Canada's resource-driven economic structure, while the S&P 500 carries a higher technology weighting and is more influenced by U.S. domestic demand and innovation. If you are bullish on commodities and the North American infrastructure export market, CAN60 offers higher relevance. If you prefer technology and growth stocks, U.S. stock indices may be a better fit.
Under what market conditions is CAN60 trading most favorable?
The following scenarios present attractive opportunities for CAN60 trading:
- Rising oil and metal prices: Directly benefit the energy and materials sectors (such as Enbridge, Barrick Gold)
- Stable U.S.-Canada economic expansion: Drives revenue growth for banks and industrial stocks
- Rising market risk appetite with foreign capital flowing into North America
With CFD tools, you can execute both long and short positions, participating in market movements regardless of direction.
What are the advantages and risks of CAN60 CFDs compared to ETF investing?
Advantages: Supports leverage and short-term trading, enhancing return flexibility. Both long and short positions are available, making it effective for volatile market conditions. No actual shareholding is required, providing high trading flexibility.
Risks: High leverage amplifies potential losses, making stop-loss settings essential. No dividend distributions (unlike ETFs). Profits and losses are affected by spreads and overnight fees.
New traders are recommended to start with a demo account to familiarize themselves with trading procedures and risk management.
Summary
The S&P/TSX 60 Index (CAN60) is the most representative benchmark index on the Toronto Stock Exchange, bringing together core enterprises across financials, energy, materials, industrials, and other sectors. With its sector diversification, high liquidity, and market representativeness, CAN60 is an ideal choice for participating in the Canadian market.
Global economic growth, commodity price trends, and Canadian domestic policy provide growth momentum for the index, while energy price volatility, interest rate policy changes, and U.S.-Canada trade relations are risk factors that require attention. Traders should closely monitor global and Canadian economic conditions, particularly trends in the energy and financial sectors.
Use Titan FX's CAN60 live quotes and charts page to stay on top of market developments, and refer to the S&P 500 (US500) trading guide and Dow Jones Industrial Average (US30) trading guide for more North American market index trading strategies.