What Is the Cup and Handle Pattern? How to Spot It and Trade Breakouts
The cup and handle earned its name from its shape: a rounded bottom that looks like a teacup, followed by a slight drift lower that resembles the cup's handle. William O'Neil popularized it, and it has since become one of the most widely watched breakout setups among technical traders.
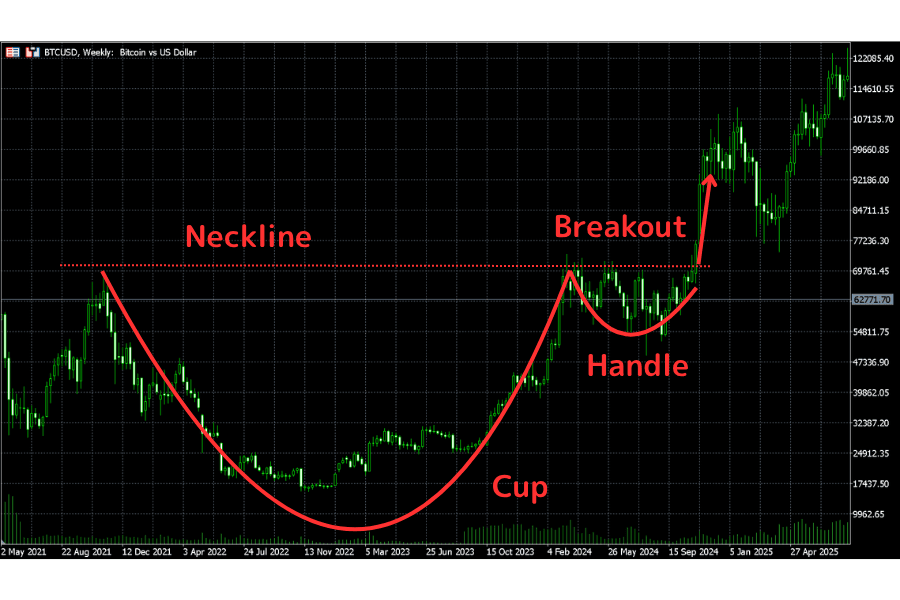
Although O'Neil developed the pattern around growth stocks, its logic is not limited to equities. Because it is fundamentally a form of price action analysis, the cup and handle shows up across stocks, forex, futures, and cryptocurrency—any market with price and volume data. At its core, the pattern captures a familiar sequence: an uptrend pauses, profit-taking is absorbed, supply is consumed, and buyers gradually regain the upper hand.
This article walks through the pattern's definition and formation, its standard structure and key features, how to identify a valid setup, entry and exit planning, common failure modes, and the questions traders ask most—so you can add it to your toolkit with a clear framework.
- The cup and handle is a bullish continuation pattern, usually appearing within an existing uptrend.
- It has two parts: a rounded, U-shaped cup and a short consolidation handle.
- Healthy patterns show a reasonable pullback, shrinking volume, and a volume surge on breakout.
- A trade plan combines the breakout level, a stop below the handle, and a measured price target.
- False breakouts, thin volume, and a weak broader market are the main risks to watch.
- 1. What Is the Cup and Handle Pattern? A Quick Primer
- 2. The Standard Structure and Key Features
- 3. How It Forms and the Market Psychology Behind It
- 4. How to Identify a Valid Cup and Handle
- 5. Entry, Stop-Loss, and Price Target
- 6. Why the Pattern Fails: Common Risks and Traps
- 7. Cup and Handle FAQ
- 8. Summary
1. What Is the Cup and Handle Pattern? A Quick Primer
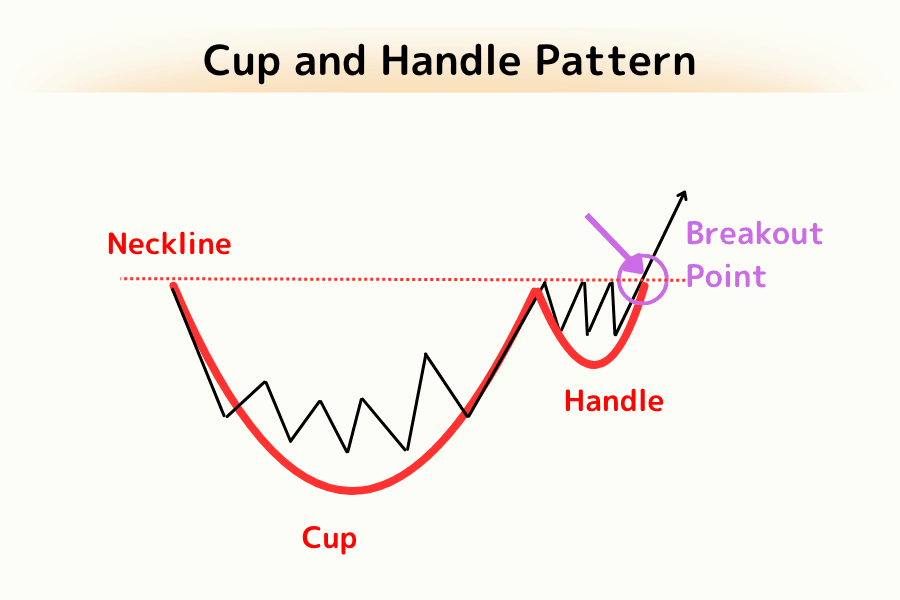
The cup and handle is a classic price consolidation pattern whose outline resembles a teacup. It is built from two components—the cup and the handle—and it typically appears after an existing uptrend rather than in a prolonged downtrend.
In technical analysis, the setup is classified as a bullish continuation pattern. After a stretch of pullback and sideways trade, selling pressure is gradually worked off. Price then challenges the previous high, pauses briefly to consolidate, and breaks higher—a sequence that often suggests buyers are ready to take back control.
Many strong stocks have carved out a cup-and-handle-like base before launching their main advance. That track record is why so many traders treat the pattern as a useful lens for spotting breakout moves and continuation opportunities.
Feature 1: It's a trend-continuation pattern
The cup and handle usually forms within an ongoing uptrend, not a long-term bear market. After an initial rally, price enters a consolidation phase where the market spends time absorbing earlier profit-taking. Once supply stabilizes, the door opens for the next leg higher.
That said, the pattern does not guarantee that price will rise. You still need to weigh it alongside volume, the broader trend, and how price behaves after the breakout.
Feature 2: It blends chart shape with market psychology
The cup and handle is more than a shape on a chart—it maps the changing psychology of market participants. From profit-taking to the absorption of selling pressure, to buyers stepping back in and chasing the breakout, each stage corresponds to a recognizable behavior. That link to real market dynamics is part of what gives the pattern analytical value.
Feature 3: It works across many markets
Beyond equities, the cup and handle also shows up in forex, futures, and crypto. Because it is essentially price action analysis, it can be applied to most markets that produce price and volume data.
Keep in mind, though, that volatility, liquidity, and trading hours differ from one market to the next, so reliability varies. In practice you should read the pattern in the context of each market's characteristics and pair it with disciplined risk control.
2. The Standard Structure and Key Features
Not every chart that looks like a cup is a valid cup and handle. To reduce the risk of misreading the setup, it helps to understand its typical structural features and to confirm them against the trend, volume, and post-breakout price action.
Feature 1: A rounded, U-shaped cup
A standard cup shows a U-shape or rounded bottom rather than a sharp V-reversal. The rounded base signals that the market has spent time consolidating, that selling pressure has been steadily absorbed, and that the supply structure is relatively stable.
In O'Neil's classic framework, the cup's retracement often falls in a reference range of roughly 12% to 33%, and it can take anywhere from several weeks to several months to form. The exact figures still depend on the market environment, volatility, and the characteristics of the instrument.
Feature 2: A shallow handle pullback
The handle is a small consolidation zone on the right side of the cup. Its job is to absorb the short-term selling pressure that tends to appear as price approaches the prior high.
As a rule of thumb, a healthy handle should not pull back too deeply—a common guideline is to keep it within one-third of the cup's height. A pullback that runs deeper may indicate that selling pressure is still heavy, which lowers the pattern's reliability.
Feature 3: The handle is short-term
While the cup often takes weeks or months to develop, the handle is usually a much shorter consolidation.
If the handle drags on too long, or price keeps grinding lower within it, that can point to a lack of momentum and a weaker eventual breakout. So when you read the handle, look beyond its shape to its duration and price stability.
Feature 4: Volume dries up, then surges on the breakout
Volume is an important confirming indicator for the cup and handle. Generally, volume can be heavier during the left side of the cup as price corrects, then contracts through the base and the handle as selling pressure fades.
When price breaks above the handle's high on expanding volume, the breakout signal carries more weight. Even so, a volume surge does not guarantee success—you still want to see price hold above the key resistance zone after the break.
Feature 5: It usually appears in an uptrend
A classic cup and handle mostly forms after an existing uptrend, consistent with its role as a bullish continuation pattern.
If the longer-term trend is in a bearish alignment, a similar-looking structure tends to carry less weight. When you evaluate the pattern, confirm that the broader market, the sector trend, and the instrument's own price structure all support a continuation higher.
With the structure clear, we can look at how the pattern forms and what shift in market psychology it reflects.
3. How It Forms and the Market Psychology Behind It
The cup and handle draws so much attention from technical traders because it captures a complete arc—from correction, to consolidation, to renewed strength.
Stage 1: Profit-taking begins
After a rally, some investors choose to lock in gains. Selling pressure builds, and price slips into a corrective phase. Sentiment tends to shift from optimism to a wait-and-see stance, and the appetite to chase price fades.
Stage 2: Selling pressure is absorbed
As price drifts lower, the pool of willing sellers gradually thins out and the market settles into consolidation. This is the market working off the profit-taking that had accumulated, with shares moving into the hands of more patient holders.
Stage 3: Buyers return
Once the market grows more comfortable with the price, buying interest can pick up and confidence slowly recovers. Price often works its way back toward the prior high, reflecting a mood that is turning from cautious to constructive.
Stage 4: A final test—the handle
Near the previous high, some holders still decide to sell, so the market usually pauses for a brief consolidation—this is the handle. If price can stay relatively steady here, it suggests selling pressure is easing and the market is storing up energy for the next move.
Stage 5: The breakout continues the trend
Once buyers absorb the remaining supply, price has the chance to break higher. From a psychology standpoint, this is where sidelined capital may start to engage and consensus turns more optimistic—which is why the breakout is often read as a signal that the uptrend may continue.
4. How to Identify a Valid Cup and Handle
Once you understand the basic structure, the next step is judging whether a given pattern is actually worth trading. Plenty of charts look like a cup and handle, but they don't all carry the same reliability—so knowing what to check matters.
Check 1: Is the cup depth reasonable?
An ideal cup shows a gentle U-shape or rounded bottom. A cup that is too shallow may mean the base hasn't consolidated enough; one that is too deep can suggest the instrument is still caught in a weaker, downward structure.
As a general reference, the cup's correction often lands somewhere between 12% and 33% of the prior advance. Treat that as a classic benchmark, not a hard rule, and read it alongside the market's volatility and the instrument's own behavior.
Check 2: Is the handle pullback too deep?
The handle's main role is to absorb selling pressure near the prior high, so its pullback shouldn't be excessive.
A healthy handle typically stays within one-third of the cup's height. If it retraces further than that, selling pressure may still be heavy, and the stability of any subsequent breakout tends to suffer.
Check 3: Does the volume fit the pattern?
Volume is a key confirming clue. Through the cup and handle, volume usually contracts; when price breaks above the handle's resistance, a simultaneous expansion in volume adds weight to the signal.
This "dry up on consolidation, surge on breakout" behavior is one hallmark of a healthier pattern. Even so, volume is a supporting tool—read it together with the trend direction and how price acts after the break.
Check 4: Is it forming in an uptrend?
The cup and handle is a bullish continuation pattern at heart, so it suits markets that are already trending higher.
If the broader trend is still bearish, a similar structure tends to have weaker follow-through after a breakout. Don't focus only on the local pattern—track the broader market, the sector, and the individual instrument together.
Check 5: Is the breakout near the prior high?
The ideal breakout point usually sits near the high on the right side of the cup—that is, around the handle's upper edge and the prior-high resistance zone.
When price clears the resistance formed by the prior high and the handle's upper edge, it suggests buyers have absorbed most of the supply and the move can attract fresh capital. Whether price then holds above that level remains a key test of whether the pattern is valid.
5. Entry, Stop-Loss, and Price Target
After you've identified a cup and handle, the questions that matter most are when to enter, where to place your stop, and how to estimate a target. A sound entry-and-exit plan is often more valuable than simply spotting the pattern.
Entry: a breakout above the handle's resistance
The most common entry comes as price breaks above the handle's upper resistance zone.
Many traders wait for a closing price to hold above the breakout level, or for a slight retest, before entering—an approach that lowers the risk of an intraday false breakout. If volume expands clearly on the break, the signal is more reliable.
Stop-loss: just below the handle low
Even a textbook cup and handle can fail. A reasonable stop sits below the handle low or the nearest clear support. Once price breaks that key support, the logic of the pattern has been invalidated, and protecting capital takes priority.
A useful discipline here comes straight from O'Neil himself: cut losses mechanically once price falls roughly 7% to 8% below your pivot (buy point), regardless of how promising the setup looked. Deciding your exit in advance—and honoring it—keeps a single failed pattern from turning into an outsized loss.
Price target: a measured move
A common way to project a target is the measured-move method, using the cup's height:
- Measure the vertical distance between the cup's high and its low.
- Add that distance to the breakout point.
For example, if the cup's high is 100, its low is 80, and the breakout occurs at 100, the theoretical target is 120. It's a simple, practical technique for setting a reasonable profit expectation.
The key point: risk-reward still matters
A textbook pattern is no guarantee of profit. When you plan a trade, look past the shape itself and weigh the potential reward against the distance to your stop. When expected reward is clearly larger than the risk taken, the overall strategy tends to have an edge. Chasing a breakout where the target sits barely above your stop rarely pays off over time.
6. Why the Pattern Fails: Common Risks and Traps
The cup and handle is a breakout setup that many technical traders respect, but no pattern is right 100% of the time. Even with a clean structure and a clear breakout signal, a trade can still fail because of the market environment, capital flows, or thin volume. Knowing the common risks helps you plan your risk management ahead of time.
Risk 1: The false breakout
The false breakout is one of the pattern's most common failure modes. After price briefly clears the handle's upper edge, if buyers can't keep pushing it higher, price may drop quickly back below the resistance zone.
This tends to happen when volume is thin, the broader market is weakening, or there's little appetite to chase price. Traders who buy simply because they saw a breakout can be exposed to a sharp reversal.
Risk 2: Insufficient volume
Volume is a key gauge of breakout quality. If volume doesn't expand meaningfully as price breaks out, participation may be lacking and momentum may be too weak to sustain the move. Patterns like this often fade or turn into false breakouts even after a short-term break.
Risk 3: The handle pullback is too deep
The handle is meant to be a short consolidation that absorbs supply near the prior high. If it falls too far—back toward the middle of the cup, for instance—it may signal that selling pressure hasn't been fully worked off and that upside momentum is lacking. In that case, be more cautious about whether price can actually hold above resistance after a break.
Risk 4: A weakening broader market
Even the cleanest technical pattern struggles to fight the overall market direction. If the broader market slides into a clear downtrend, an individual instrument that forms a cup and handle can still be dragged down by market-wide risk. So when you trade this pattern, look beyond a single chart to the broader trend, sector strength, and the market's overall risk appetite.
Understanding these failure modes helps you set stops more carefully and avoid blindly chasing patterns whose structure isn't healthy enough.
7. Cup and Handle FAQ
Q1. Is the success rate high?
The cup and handle is a common breakout pattern, but there's no fixed success rate—it depends on the market environment, whether volume cooperates, the direction of the broader trend, and the strength of the individual instrument.
When the uptrend is clear, volume confirms, and price holds above resistance after the break, the pattern tends to be more reliable. In a weakening market or on thin volume, the odds of failure rise.
Q2. What is an inverted cup and handle?
The inverted cup and handle is the upside-down version of the standard pattern, and it usually appears in a downtrend. Its outline looks like an overturned teacup: the cup forms a rounded top, and the handle is a small rebound-and-consolidation.
When price breaks below the handle's lower edge, it's often read as a signal that the downtrend may continue—making it a bearish pattern. As always, confirm it with volume, the trend direction, and how price behaves after the break.
Q3. Does it always go up?
No. A technical pattern is a probability tool, not a guarantee of profit. Even a clean structure can fail on surprise news, a weakening broader market, thin volume, or a shift in capital flows. That's why you should plan your stop and define your risk tolerance in advance, rather than relying on the pattern alone.
Q4. How does it differ from a rounded bottom?
A rounded top and bottom pattern is built mainly from a pullback and a basing process, and it's typically used to gauge whether a market is turning from weak to strong—more of a bottom-reversal pattern.
The cup and handle adds a short handle consolidation on top of a rounded-bottom or cup structure that is nearly complete. Compared with a plain rounded bottom, the cup and handle usually offers a clearer resistance zone and a more defined breakout point to watch.
Q5. What mistakes do beginners make most?
The most common mistake is entering too early by trying to guess the bottom of the cup, or focusing only on the chart's shape while ignoring volume, the overall trend, and the broader market.
When you're learning to read the pattern, wait to see whether price clearly breaks the handle's upper edge and whether volume confirms, then judge whether the setup fits your trading plan and risk tolerance. Set your stop in advance so that a failed pattern doesn't turn into a growing loss.
8. Summary
The cup and handle is one of the more recognizable bullish continuation patterns in technical analysis. Made up of a cup and a handle, it reflects a market moving from consolidation, through a change of hands, to an attempt at a breakout.
In practice, don't stop at whether the structure looks complete—also watch the change in volume, the direction of the broader trend, the breakout location, and whether price can hold above resistance afterward. When price clears the handle's upper resistance with volume confirming, buyers are often gaining strength.
Still, the cup and handle is not foolproof. False breakouts, thin volume, an overly deep handle pullback, or a weakening market can all derail it. That's why a clear stop-loss mechanism and a solid risk management strategy remain the foundation for trading it consistently.
By understanding how the cup and handle forms, how to evaluate it, and where it commonly fails, you can watch for potential breakouts more systematically—and fold pattern analysis into a complete process for trading decisions and risk management.
Further Reading
- Rounded Top and Bottom Pattern
- What Are Candlestick Charts?
- What Is a Moving Average?
- What Is a Golden Cross?
Titan FX Trading Strategy Lab. We produce investor-education content covering forex, commodities (crude oil, precious metals, agricultural goods), stock indices, US equities, and digital assets.
Primary Sources (by category)
- Pattern & framework: William O'Neil's CAN SLIM method and the classic treatment of the cup and handle
- Technical analysis: General technical-analysis principles on price action, volume, and breakout patterns
- Investor education: Investor education from financial regulators on technical analysis, risk management, and stop-losses