MACD Indicator: Advantages, Disadvantages, and How to Use on MT4/MT5
MACD is one of the most popular technical indicators and is used by traders worldwide. Whether you can get the most out of it, however, depends on understanding its strengths and weaknesses and being able to display and configure it properly on MT4/MT5.
This article will cover the basics and the advantages and disadvantages of MACD and provide guidance to allow you to use it effectively on MT4 and MT5 platforms. Whether you're a beginner or an experienced trader, you’ll find practical insights in this article.
- Components: The MACD line, the signal line, and the histogram
- Advantages: Trend identification, momentum, clear signals, multi-market use
- Drawbacks: Lag, false signals, weak in ranges, not enough on its own
- On MT4/MT5: Built in; you can display it and set the 12/26/9 parameters
- vs. moving average: MA smooths price; MACD measures momentum via two EMAs
- 1. Overview of the MACD Indicator and Its Components
- 2. Advantages of the MACD Indicator
- 3. Disadvantages of the MACD Indicator
- 4. How to Use MACD Indicator on MT4/MT5 Platforms
- 5. Difference Between MACD and Moving Average (MA)
- 6. Free Custom Indicators Provided by Titan FX (MT4/MT5)
- 7. Frequently Asked Questions (FAQ)
1. Overview of the MACD Indicator and Its Components
The MACD indicator is a momentum-tracking tool based on moving averages, which is broadly used in the analysis of market trends and momentum. It facilitates traders to identify the uptrend and downtrend of the market, as well as the potential timing of buying and selling, through the calculation of the difference between two Exponential Moving Averages (EMA) of different time periods.
MACD indicator is composed of three key components:
MACD Line:
Demonstrates the difference between a short-term EMA (typically 12 days) and a long-term EMA (typically 26 days).
Signal Line:
A 9-day EMA of the MACD line, is used to smooth the data of MACD to provide clearer trading signals.
Histogram:
Demonstrates the difference between the MACD line and the signal line, allowing traders to see the strength and changes in trends in a straightforward manner.
Learn More About the Basics of the MACD Indicator2. Advantages of the MACD Indicator
As a multifunctional trading tool, MACD has several significant advantages as follows.
1.Trend Identification:
The MACD is an excellent trend tracking tool, which can identify and confirm the trend of the market and its persistence effectively.
2.Momentum Capture:
Traders can capture changes in market momentum by observing the crossing of the MACD line and the signal line, which helps timely entry and exit decisions.
3.Easy to Interpret:
The graphical interface of the MACD is user-friendly, both beginners and experienced traders can easily interpret its signal.
4.Multi-Market Applicability:
The MACD can be utilized in various markets, such as stocks, FX, and futures markets, its versatility makes it a powerful tool for diversified portfolios.
5.Clear Signals:
The buy and sell signals provided by MACD are relatively clear, which reduces the uncertainty in trading decisions.
3. Disadvantages of the MACD Indicator
Despite the outstanding performance of MACD in many perspectives, there are also some limitations, so traders need to be cautious about the following.
1.Lagging Nature:
As a tool based on historical data, lag to a certain extent exists in MACD, which may contribute to the delay of signals to the actual changes in the market.
2.Frequent False Signals:
In highly volatile markets or markets without trends, the MACD may generate misleading signals, leading to incorrect trading decisions.
3.Dependence on Market conditions:
The MACD performs best in markets with obvious trends, and its performance in oscillating markets may not be ideal and needs to be combined with other indicators to enhance accuracy.
4.Needs for Additional Confirmation:
Although the MACD provides signals for trading, it alone may not be enough to make the best trading decision. It is better to use it in combination with other technical tools, such as price action strategies or other indicators, or with other chart modes to ensure the effectiveness of the signal.
4. How to Use MACD Indicator on MT4/MT5 Platforms
On MT4/MT5 platforms, the default setting of the MACD indicator is to display a gray histogram and a red signal line.
Generally, most other charting software displays the MACD by two lines, which makes some users more used to that displaying style. If a user prefers the displaying style of two lines, customization or download of other indicators will be needed to realize the intended visual appearance.
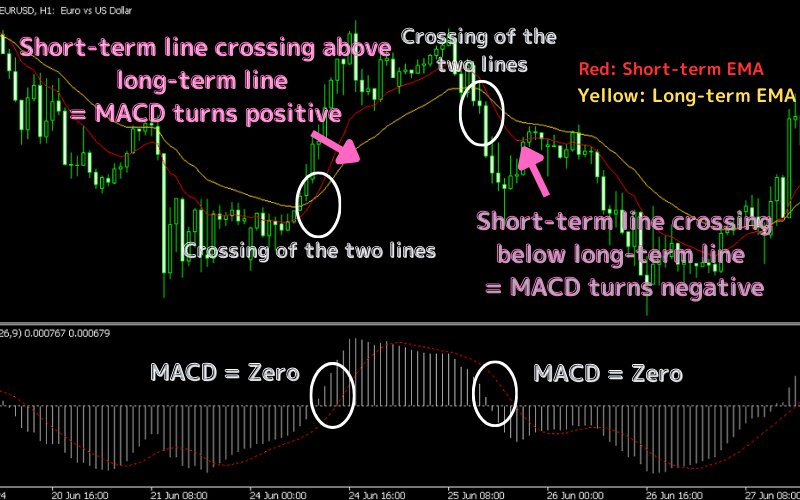
The MACD indicator reflects the difference between the short-term EMA and the long-term EMA.
As shown in the above graph, a 12-period EMA (red) and a 26-period EMA (yellow) are shown in the main chart, while the MACD indicator set based on the same periods is shown in the window of the sub-chart.
When the short-term EMA (generally with a period of 12-day) crosses above the long-term EMA (generally with a period of 26-day), the MACD value turns positive, indicating that the short-term trend is stronger than the long-term trend, which may be taken as a buy signal.
On the contrary, when the short-term EMA crosses below the long-term EMA, the MACD value turns negative, indicating that the short-term trend is weaker than the long-term trend, which may be taken as a sell signal.
At the crossing point of two EMA lines, the MACD value is zero, which demonstrates that the market is in equilibrium.
5. Difference Between MACD and Moving Average (MA)
MACD and Moving Average (MA) are both commonly used tools in technical analysis, and they also both analyze the trends of the market according to historical price data. However, their structures, purpose, and methods of use are significantly different.
1. Basic Definition and Construction
Moving Averages:
MA is the simple or exponential smooth average of market price, used to smooth the price data to identify the direction of price trends. MA can be Simple Moving Average (SMA) or Exponential Moving Average (EMA), etc.
MACD:
MACD is composed of the difference between two EMAs, specifically, the difference between 12-day fast EMA and 26-day slow EMA. Besides, MACD also includes a signal line (a smoothed fast EMA, generally the 9-day EMA) and a histogram, which shows the difference between MACD line and signal line.
2. Purpose and Application
Moving Averages:
MA is mainly used to determine the presence and direction of trends, as well as potential levels of support and resistance. It is directly derived from price data, and it reflects the average performance of price.
MACD:
MACD is more used for the identification of the strength, direction, and potential changes in trends (acceleration or deceleration). MACD provides a more detailed view of the direction and momentum of trends, which helps traders capture the timing of entry and exit, especially through the observation of the crossing of MACD line and signal line, and the changes of the histogram.
3. Signal Type
Moving Averages:
MA generates rather simple signals, mainly the crossing of price and MA. For example, the price crossing above MA may indicate a signal of buying; while the price crossing below MA may indicate a signal of selling.
MACD:
MACD generates more complex signals, including the crossing of MACD line and Signal Line (Golden Cross and Death Cross), the crossing of MACD lines and Zero Line, and the divergences of Price and MACD, which provide more details about changes in market momentum.
4. Sensitivity to Market Conditions
Moving Averages:
In highly volatile markets or markets without obvious trends, MA may not be effective enough, because it easily produces misleading signals.
MACD:
Although the MACD is also influenced by market conditions, its structure which combines Fast Line, Slow Line, and Histogram makes it more reliable in various market conditions, especially while identifying trend change and the weakening of momentum.
6. Free Custom Indicators Provided by Titan FX (MT4/MT5)
Titan FX offers traders a variety of free custom indicators designed for the MT4/MT5 platforms. These indicators are carefully crafted to help traders optimize their trading strategies and enhance decision-making accuracy. Whether you are a beginner or an experienced trader, these tools provide robust support to improve your trading performance.
Simply register for a free Titan FX trading account to download and use these indicators. Opening an account with Titan FX is quick and straightforward, requiring no submission of identity or address verification documents.
Multi-Timeframe MACD (Titan_Multi_MACD)
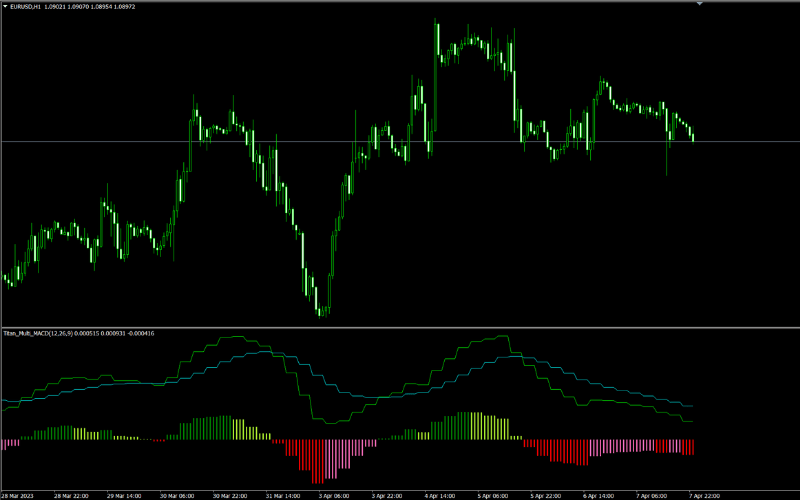
The Multi-Timeframe MACD indicator not only displays the MACD for the current chart's time period but also shows the MACD for longer time frames.
Additionally, this indicator shows a histogram representing the difference between the MACD and the signal line. The histogram's color changes based on the previous candle's increase or decrease, allowing you to track subtle changes in the histogram.
Multi-Timeframe RSI (Titan_Multi_RSI)
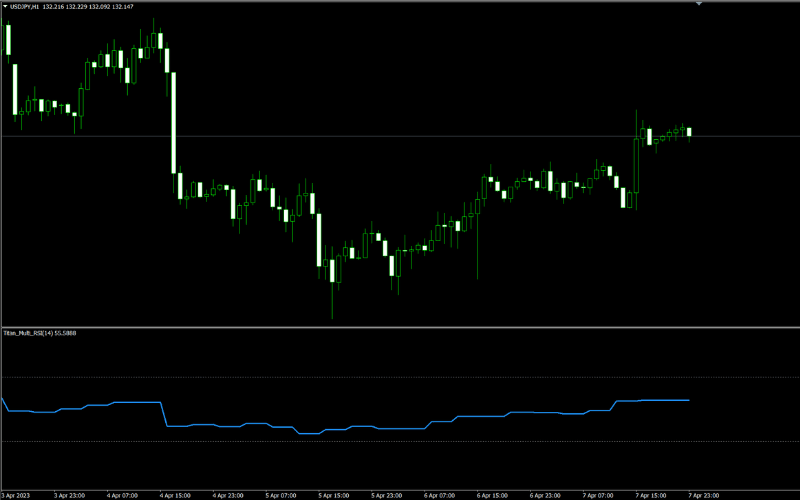
The Multi-Timeframe RSI indicator shows the RSI for the current chart's time period, as well as the RSI for longer time frames.
By analyzing overbought and oversold market conditions on longer time frames, it helps identify potential trend reversals, especially when there is divergence between price movements and RSI development. This can facilitate more efficient analysis.
7. Frequently Asked Questions (FAQ)
Q1. What is the MACD made up of?
It has three parts: the MACD line (the difference between a short- and long-term EMA), the signal line (a 9-day EMA of the MACD line), and the histogram, which shows the gap between the two.
Q2. What are the main advantages of MACD?
It makes trends and their persistence easy to judge, and crossovers between the MACD and signal lines reveal momentum shifts. It is visually clear and works across stocks, forex, and futures.
Q3. What are the drawbacks of MACD?
Because it is based on past data it lags, and it produces more false signals in volatile or ranging markets. It is not enough on its own, so combine it with price action or other indicators.
Q4. How does MACD differ from a moving average (MA)?
An MA smooths price itself to show trend direction, whereas MACD uses the gap between two EMAs to measure momentum, flagging turning points through crossovers and the histogram.
Further Reading
Titan FX Trade Strategy Research Lab covers forex (FX), commodities (oil, precious metals, agricultural products), stock indices, U.S. equities, and crypto assets — producing educational content for retail investors across asset classes.
Primary Sources (by Category)
- Reference: Investopedia — MACD
- Platform: MetaQuotes — MT4 / MT5