 Home
Home- Investment Guide: Strategies for Stocks, Forex, and Metals
- The 1-2-3 Pattern: Reversals, Entries, and Stops
The 1-2-3 Pattern: Using Price Structure to Spot Reversals and Entries
In technical analysis, many traders focus on indicator crossovers and numerical readings but overlook price action itself — what the market is actually doing.
The 1-2-3 Pattern is an analytical framework that focuses on price action itself. It relies on no indicators and reads trend-reversal signs purely from the "structure" of highs and lows. Because it tracks changes in highs and lows, traders use it to organize market structure without adding extra indicators.
This article starts from the core concept, breaks down bullish and bearish 1-2-3 structures, explains how to translate them into entries, stops, and risk control, and finishes with a comparison to the 2B pattern — so you can build an objective, repeatable framework for reading market structure.
- Why the 1-2-3 pattern focuses on changes in highs and lows
- How bullish and bearish 1-2-3 structures are formed
- Where traders usually watch for entries, stops, and volume confirmation
- When the pattern is useful and where false signals can appear
- How the 1-2-3 pattern differs from the 2B pattern
1. What Is the 1-2-3 Pattern? Core Concept
The 1-2-3 Pattern is a chart formation for identifying trend reversals. Built on Dow Theory, it simplifies complex price action into three consecutive price stages. For a trend to change, the market must first break the prior momentum, then test exhaustion, and finally complete a structural break.
Core Idea: Breaking Momentum and Price Structure
The pattern assumes trends don't disappear without reason. In an uptrend, price must maintain higher-lows/higher-highs momentum. Once that momentum starts showing signs of fatigue, the 1-2-3 framework lets you anticipate potential reversal opportunities through the three points.
2. Reading Bullish and Bearish 1-2-3 Patterns
The 1-2-3 Pattern identifies reversals via structural changes across three price points. In practice, combining high–low structure with trendlines improves identification accuracy.
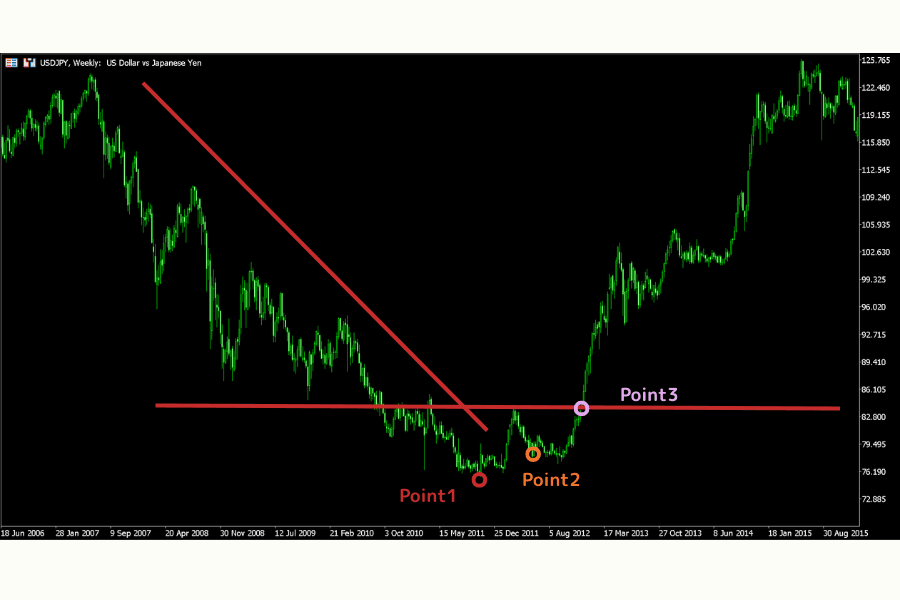
Bullish 1-2-3 (Down to Up)
Used to identify the end of a downtrend and the start of an uptrend. The three conditions:
- Point 1 (New Low): Price makes a clear swing low.
- Point 2 (Higher Low): Price rebounds, then pulls back, but stops above Point 1 — selling pressure is weakening.
- Point 3 (Breakout Confirmation): Price breaks above the high just before Point 2, formally establishing a new uptrend structure.
Within a downtrend, first draw a descending trendline. A break of that trendline is typically the first sign of strength, and when the 1-2-3 structure completes, the reversal signal becomes more credible.
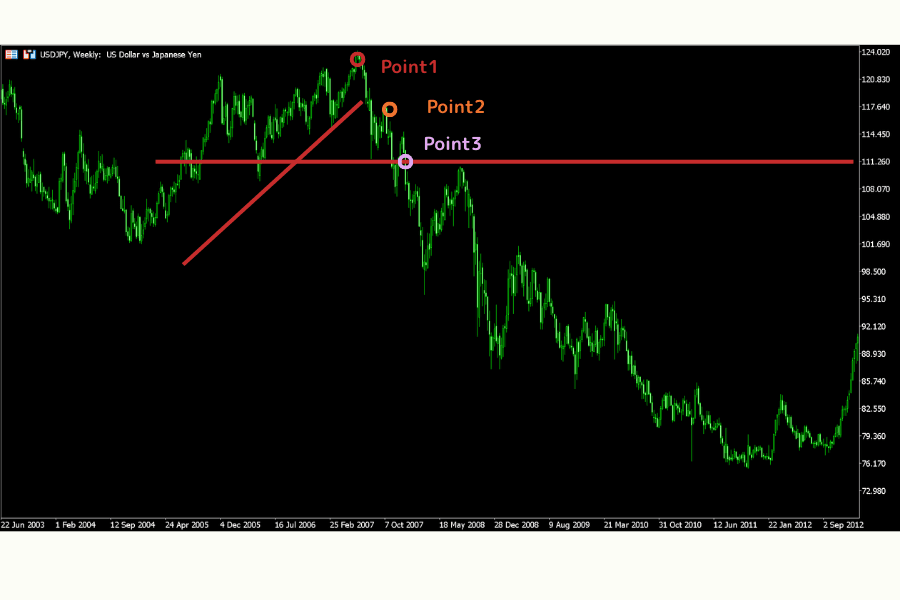
Bearish 1-2-3 (Up to Down)
Used to identify the end of an uptrend and the start of a downtrend. The three conditions:
- Point 1 (New High): Price makes a clear swing high.
- Point 2 (Lower High): Price pulls back, then rebounds, but peaks below Point 1 — buying is weakening.
- Point 3 (Breakdown Confirmation): Price breaks below the low just before Point 2, formally establishing a new downtrend structure.
In an uptrend, draw an ascending trendline. A break below that line means the prior bullish momentum is weakening. If a 1-2-3 structure forms at the same time, the reversal signal gains value.
On a real chart, the three points form a clear "1-2-3" structure. Trendline breaks offer early warning, while the Point 3 break serves as formal confirmation.
3. Practical Guide: Where to Enter and Place Stops
Once you understand the structure, the next step is translating it into trading decisions. Clear entries and stops are the core of risk control.
Trading the Bullish 1-2-3
When price breaks above the high just before Point 2 (Point 3), you can consider a long entry.
If the downward trendline has already been broken beforehand, the market has already given an early strength signal and confidence in the entry rises further.
Stops are typically placed below Point 2 (the higher low), acting as the defensive line should the reversal logic fail.
Trading the Bearish 1-2-3
When price breaks below the low just before Point 2 (Point 3), you can consider a short entry.
If price has already broken the ascending trendline beforehand, momentum has weakened, which reinforces the short case.
Stops are typically placed above Point 2 (the lower high). If price returns above that level, the reversal signal is invalidated.
Enhancing Entry Quality
Beyond structure and trendlines, also watch volume. If volume expands on the Point 3 break, participation is rising and the signal's reliability typically improves.
4. Strengths and Limitations of the 1-2-3 Pattern
In practice, the 1-2-3 Pattern is not a universal solution. Understanding when it's appropriate — and where it struggles — helps keep strategy effective.
Strengths
Strength 1: Clear Structure, Easy to Read
Based on price highs and lows, the "1-2-3 structure" offers a clear framework to judge turns. Beginners can build judgment without leaning on complex indicators.
Strength 2: Consistent Entry and Risk Logic
Entry and stop both sit on the same structural framework, keeping trading decisions consistent. Enter when structure forms; exit when structure breaks — discipline follows naturally.
Strength 3: Favorable Risk/Reward
Entries usually sit near inflection zones; the distance to stop is relatively short while the potential move in the new trend direction is large. That tends to create a favorable risk/reward profile.
Limitations
Limitation 1: Requires Waiting for Confirmation
The pattern emphasizes breakout confirmation, which means traders rarely catch the exact low or high. Signal reliability goes up, but some price space is sacrificed.
Limitation 2: Choppy Markets Create False Signals
In ranging or sideways markets, price often oscillates across key levels, producing signals without follow-through. Without trend context, false trades may multiply.
Limitation 3: Requires Practice Reading Structure
Though conceptually simple, judging highs and lows on real charts isn't always obvious. Inexperience can lead to misreading the structure and affect decisions.
5. Advanced Comparison: 1-2-3 vs 2B Pattern
Once you master the 1-2-3, you will likely hear about a closely related concept — the 2B Pattern. Both are price-action reversal tools, but they differ in risk preference and confirmation.
Characteristics of the 1-2-3 Pattern
Emphasizes entry after confirmation. The reversal is only considered valid after Point 3 formally breaks. This gives a more reliable signal, fitting traders who prefer confirmation and want to reduce false-breakout risk.
Characteristics of the 2B Pattern
The 2B pattern is designed specifically for false breakouts. When price briefly breaks a prior high or low and then snaps back in the opposite direction, a 2B signal forms. It does not wait for a full Point 3 confirmation, so entries come earlier and the potential reward is bigger — but the risk of false signals is also higher.
How to Choose
If you are new to this setup or prefer more confirmation, start with the 1-2-3.
If you have more market experience and can tolerate more false-signal risk, the 2B pattern can give you better entry prices.
In practice, many traders combine the two — 1-2-3 for strong trends, 2B for choppy markets or key inflection zones — rotating based on the environment.
6. Summary: From Shape to Structural Thinking
The 1-2-3 Pattern offers a simple, logical way to identify trend reversals from price structure. Tracking the evolution across Points 1, 2, and 3 lets you clearly see the process of the market moving from its prior momentum into change.
In practice, relying on shape alone is not enough. Combining the 1-2-3 structure with trendline breaks and volume shifts makes signals more reliable and more aligned with actual market momentum.
The real value for investors is not memorizing a specific shape, but learning to read the market in structural terms. Once you can identify when a trend continues and when it turns, decisions become more consistent and the risk of random entries falls.
Over the long run, stable judgment and risk control matter more than any single trade. The 1-2-3 Pattern can be a good starting point for building that framework, helping you build a more stable decision process.
7. FAQ
What does the 1-2-3 pattern confirm?
It checks whether the prior sequence of highs and lows is starting to break, which can point to a potential trend reversal.
Can traders use the 1-2-3 pattern by itself?
It is usually more practical to combine it with higher-timeframe trend context, support and resistance, volume, and a predefined stop level.
Where is the common entry area?
Many traders watch the Point 3 break as confirmation, but some wait for a pullback after the break or for volume confirmation.
How is the 1-2-3 pattern different from the 2B pattern?
The 1-2-3 pattern waits for a structural confirmation. The 2B pattern tries to catch a failed break of a prior high or low earlier.
Further Reading
Titan FX Trading Strategy Research Institute
The financial market research team at Titan FX produces investor education content across a broad range of instruments, including forex (FX), commodities, stock indices, U.S. equities, and crypto assets.
Primary Sources by Category
- Technical analysis and price structure: CME Group - Technical Analysis, CME Group - Support and Resistance, CMT Association - Dow Theory
- Orders and risk management: SEC Investor.gov - Types of Orders, FINRA - Stop Orders