 Home
Home- Investment Guide: Strategies for Stocks, Forex, and Metals
- Stock Market vs Economy: Why Highs Don't Mean Good Times
Stock Market vs Economy: Why a High Index Doesn't Mean You'll Feel It
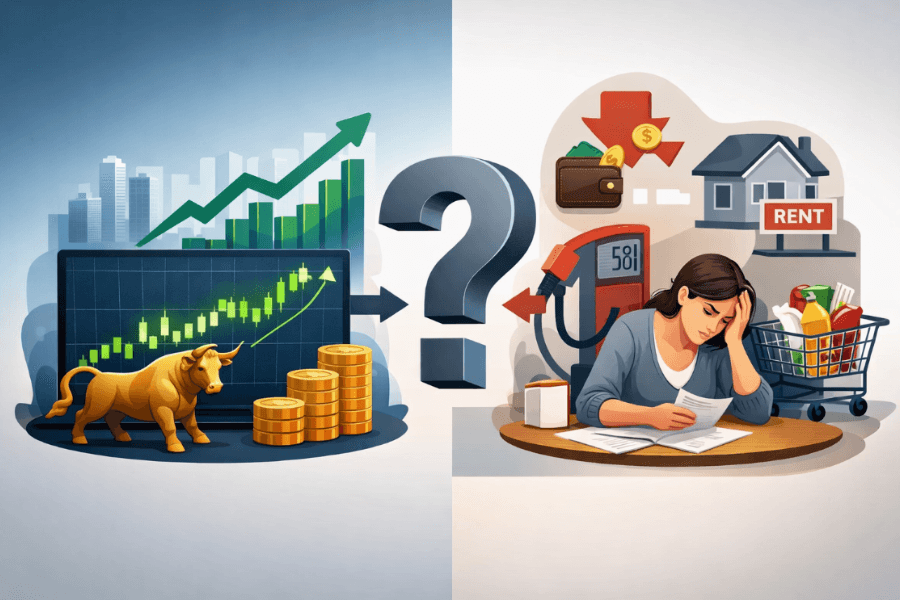
When a major stock index keeps printing record highs, the natural reaction is to assume the economy must be doing well. Yet many households still feel squeezed by rents, groceries, and stagnant pay even on the same day a headline shouts "all-time high." This gap is what economists and Federal Reserve researchers call the stock market – real economy disconnect.
The reason is simple: the stock market and the everyday economy don't measure the same thing. A stock index reflects the market's expectations for future corporate earnings and cash flows, while the lived economy is shaped by wages, employment, inflation, and the cost of living right now. Once you understand that they are looking at different layers, the disconnect stops being a puzzle and starts to look like a structural feature of how markets work.
This article explains why a high stock index does not automatically mean a strong economy, why most people don't "feel" the bull market, and which macro indicators actually capture how the real economy is doing.
- Why a stock index reflects future expectations rather than the current state of the economy
- How a few mega-cap stocks can lift an index even when the broader economy is muted
- Why most households feel the economy through wages, jobs, and prices — not stock returns
- How GDP, CPI, unemployment, wage growth, and PMI together describe the real economy
- How to read the "expectation gap" between Wall Street and Main Street as a trading signal
1. Does a High Stock Index Really Mean a Strong Economy?
Not necessarily. A stock index moves on what investors expect about future corporate profits, interest rates, and capital flows. The economy, by contrast, is what households and businesses are actually living through right now: jobs, paychecks, prices, and consumption.
That distinction is why a market can rally even as growth on the ground feels slow. If investors anticipate stronger earnings, easier monetary policy, or fresh liquidity, equity prices often start moving before the data catches up. By the time wage growth, hiring, and consumer spending visibly improve, the index has typically already priced much of that in.
So when a major index hits a fresh high, the right reading is usually not "the economy has already recovered" but "the market is positioning for the economy to recover." Treating that timing gap as a feature, rather than a contradiction, is the first step toward making sense of price action.
2. Why You Don't "Feel" the Bull Market
For most people, "Is the economy doing well?" is answered by their paycheck, their rent, the grocery bill, and how secure their job feels. None of that lines up neatly with what a stock index measures.
Indices like the S&P 500 or Dow Jones are weighted by market capitalization, which means a small group of mega-cap companies — currently dominated by technology platforms — has an outsized influence on the headline number. When those leaders rally, the index can hit records even while small businesses, cyclical sectors, or wage-sensitive industries are barely treading water. The "market" you read about may not be the market most workers experience.
There is also a wealth-distribution layer. The benefits of rising asset prices accrue mostly to the households that already own stocks, real estate, and other financial assets. For families that depend on labor income, an inflation rate that outpaces wage growth can wipe out any psychological lift from rising index levels. Higher rents, steeper mortgage rates, and faster prices on essentials all compete with — and often outweigh — the abstract good news of "stocks at all-time highs."
Once you put those two factors together — concentrated index leadership and uneven asset ownership — the disconnect stops looking like a paradox. The market and the consumer are reading different parts of the economy at different speeds, and the gap between them is closer to the norm than to an anomaly.
3. Wall Street and Main Street Are Looking at Different Layers
To understand why "high index, sluggish feeling" can happen for years at a time, it helps to separate the two lenses cleanly.
The stock market is a pricing mechanism for future cash flows. Every move in the index aggregates investor expectations about earnings growth, the path of interest rates, and where global capital wants to be deployed. As soon as those expectations shift, prices reset — well before the underlying earnings or jobs numbers actually change. That is exactly why equity markets are commonly treated as a leading indicator of the business cycle.
The real economy moves on a different clock. Hiring, wage negotiations, capacity utilization, and consumer spending take quarters or years to roll over. Even when conditions are clearly improving, the gains often show up first in capital expenditure plans and profit margins, then in employment, and only later in median wages. The lag from "investors expect a recovery" to "the average worker feels the recovery" can be substantial.
This timing mismatch is structural. Through every business cycle, asset prices tend to react first, corporate earnings second, and labor income last — both into expansions and into downturns. That is why a market can be celebrating record highs while a household is still feeling the squeeze of last year's price increases.
For traders, the same gap that frustrates households is also where opportunity lives. Misalignment between what markets are pricing and what data eventually confirms is one of the most consistent sources of repricing — and therefore of volatility — across equities, currencies, and CFDs.
4. Which Indicators Actually Reflect the Economy?
If a stock index alone doesn't capture the economy, what does? A small set of macro indicators, read together, gives a much fuller picture.
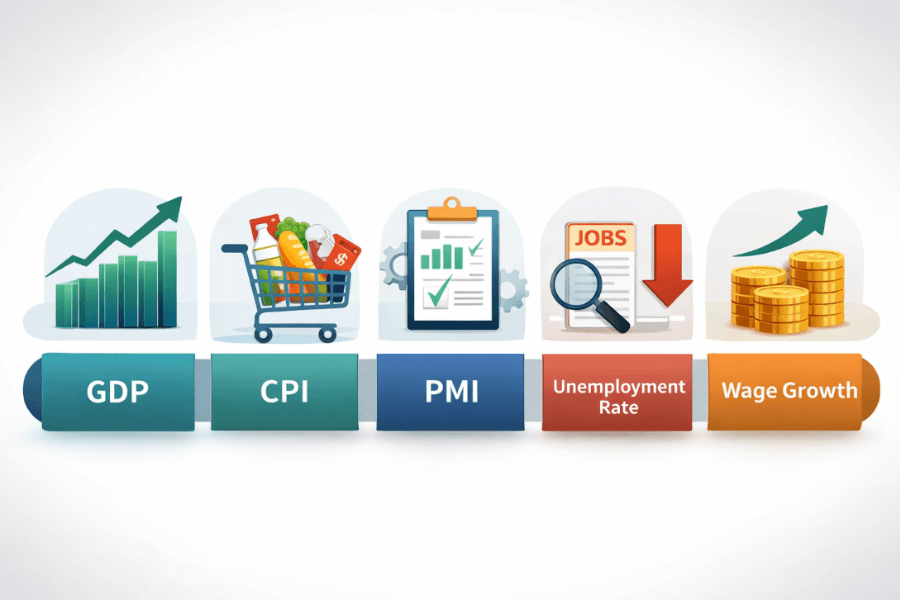
The natural starting point is GDP (Gross Domestic Product). GDP measures the total value of goods and services produced in an economy and is the broadest gauge of growth. Steady real GDP expansion usually points to a healthy combination of consumption, investment, and trade.
Next come inflation indicators, especially CPI (Consumer Price Index). Headline GDP growth can look encouraging, but if prices rise faster than wages, real purchasing power falls — and the household experience of the economy worsens even as nominal numbers improve. Reading GDP and CPI together is what separates "growth on paper" from "growth that feels real."
Labor data is essential too. The unemployment rate, nonfarm payrolls, and average wage growth tell you whether the gains in output are reaching workers. When jobs are stable and pay is rising in real terms, the economy feels strong even if the index is flat. When unemployment ticks higher or wages stall, no all-time-high in equities can paper over the underlying weakness.
Forward-looking surveys close the picture. The ISM and S&P Global PMIs, OECD's Composite Leading Indicators, and similar business-confidence series capture orders, hiring intentions, and supply-chain pressure before they show up in GDP. They are designed to be early-warning signals, and traders use them precisely because they connect "now" to "what's likely next."
These macro releases also drive markets directly. A higher-than-expected CPI print can shift rate-hike expectations and move equities, currencies, and bonds simultaneously. Strong GDP or PMI surprises tend to lift risk appetite. A trader who reads these series alongside the index gains both: a check on whether the rally is supported by fundamentals, and a sense of where the next repricing might come from.
The practical takeaway is to treat the stock index as a window onto market expectations, while using GDP, CPI, PMI, unemployment, and wages to anchor those expectations to the real economy. Once you can see both layers at once, the price action becomes much easier to interpret.
5. FAQ
Q1. If a stock index is at all-time highs, does that mean the economy is definitely strong?
Not necessarily. The index reflects what markets expect about the future, not the present-day state of the broader economy. A rally driven by a few mega-cap leaders, by rate-cut expectations, or by liquidity conditions can lift the headline number even when wages, jobs, or small-business activity are subdued.
Q2. Why don't I feel the gains when the market keeps rallying?
Households experience the economy through wages, employment, prices, and the cost of living, while the stock market reflects the value of corporate earnings and assets. The benefits of rising prices flow primarily to those who already own equities or real estate, so wage-earners may not feel the lift directly. When the index is led by a narrow group of large companies, that gap is even more pronounced.
Q3. Which indicators should I track to gauge the real economy?
Look beyond the index itself. GDP gives you the size and trend of activity, CPI tells you about price pressures, the unemployment rate and wage growth reveal labor-market conditions, and PMIs flag changes in business sentiment before they hit the harder data. Reading these alongside the index helps separate "expected recovery" from "actual recovery."
Q4. Why is the stock market called a leading indicator?
Because prices are set by expectations. Investors continuously price in their best guess about future earnings, rates, and capital flows, so the index tends to move ahead of the economic data. For traders, that lead time is exactly the window in which mispricings emerge — making it a useful tool for thinking about where the business cycle is heading.
6. Bottom Line: A High Index Doesn't Mean Everyone Is Better Off
A stock index near record highs tells you something important: investors collectively expect the future to be brighter than the present. It does not tell you that the economy has already broadened out, or that the typical household is enjoying the same lift. Those are separate questions, answered by separate sets of data.
The reason is structural. Equity indices price expected cash flows, while household economic conditions are set by wages, jobs, prices, and the cost of living. When capital concentrates in a handful of large companies, or when rate cuts and easy liquidity drive multiples higher, the headline number can keep climbing while wage-earners and small businesses lag behind for quarters at a time.
The most useful stance for a trader is to treat the stock index as one signal among several. Pair it with GDP, CPI, PMI surveys, employment, and wages, and the picture stops being "is the market right or wrong?" and starts being "where is the gap between expectations and reality, and how is it likely to close?"
That gap — the persistent expectation difference between Wall Street and Main Street — is also where most of the action lives in equity, FX, and CFD markets. Platforms like Titan FX let you turn macro views into actual positions, so your reading of the disconnect can be tested, refined, and ultimately put to work in the market rather than left as an opinion on the news.
Further Reading
Titan FX's financial market research and analysis team produces investor education content across a wide range of financial instruments, including foreign exchange (FX), commodities (crude oil, precious metals, and agricultural products), stock indices, U.S. equities, and crypto assets.
Primary Sources by Category