 Home
Home- Investment Guide: Strategies for Stocks, Forex, and Metals
- Triangle Patterns: Symmetrical, Ascending, Descending Guide
Triangle Patterns Complete Guide: Symmetrical, Ascending, Descending and Breakout Strategies
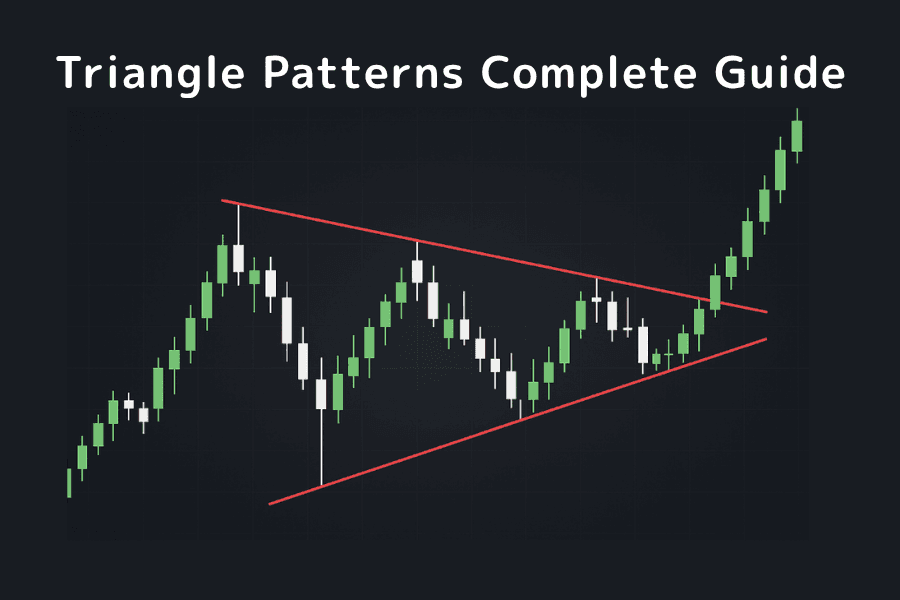
A symmetrical triangle is a chart pattern where lower highs and higher lows converge into a narrowing range; it is typically a continuation pattern, with price tending to break out in the direction of the prior trend.
In technical analysis, the symmetrical triangle is one of the setups traders love to wait on — like a spring being wound tighter and tighter, the longer the standoff lasts, the more powerful the eventual breakout tends to be.
When price action gradually converges and volume declines, it indicates that buying and selling pressure has reached a temporary balance — and the eventual breakout often marks the start of a new directional move.
Whether you trade forex, gold, or index CFDs, triangle patterns help traders identify market structure, anticipate breakout direction, and plan more strategic entries and stop levels.
- Triangles form when price volatility narrows and buying/selling pressure reaches temporary equilibrium — typically appearing in consolidation phases that precede a new trend.
- Three main variants: symmetrical triangle (breakout direction uncertain), ascending triangle (often breaks upward), descending triangle (often breaks downward), distinguished by trend-line slopes.
- Breakout reliability requires volume expansion as confirmation. Conservative traders wait for price to retest the trend line and confirm support/resistance flip — the "second-chance entry."
- Target price calculation: measure the height of the triangle base and project the same distance in the breakout direction.
- Always combine with RSI, MACD or other indicators to filter false breakouts, and place stops clearly inside the opposite trend line.
1. What Is a Triangle Pattern?
A triangle pattern (also called a converging triangle) is a chart formation in which the price range gradually narrows and volatility converges.
When highs progressively trend lower while lows progressively trend higher, the two trend lines converge to the right, forming a triangular structure.
This formation indicates that buying and selling pressure are approaching balance — and as price action narrows, a breakout becomes increasingly imminent.
Based on the slope of the trend lines, triangle patterns fall into three categories:
| Pattern | Structural Features | Common Breakout Direction |
|---|---|---|
| Symmetrical Triangle | Both trend lines converge to the right, forming an isosceles-like shape. | Could break either way; depends on the prior trend's continuation. |
| Ascending Triangle | Horizontal resistance line on top, ascending support line below. | Typically breaks upward. |
| Descending Triangle | Horizontal support line on bottom, descending resistance line above. | Typically breaks downward. |
All three belong to "converging consolidation structures." Despite shape differences, they share the same core meaning — the market is accumulating momentum and waiting for a breakout.
2. The Symmetrical Triangle
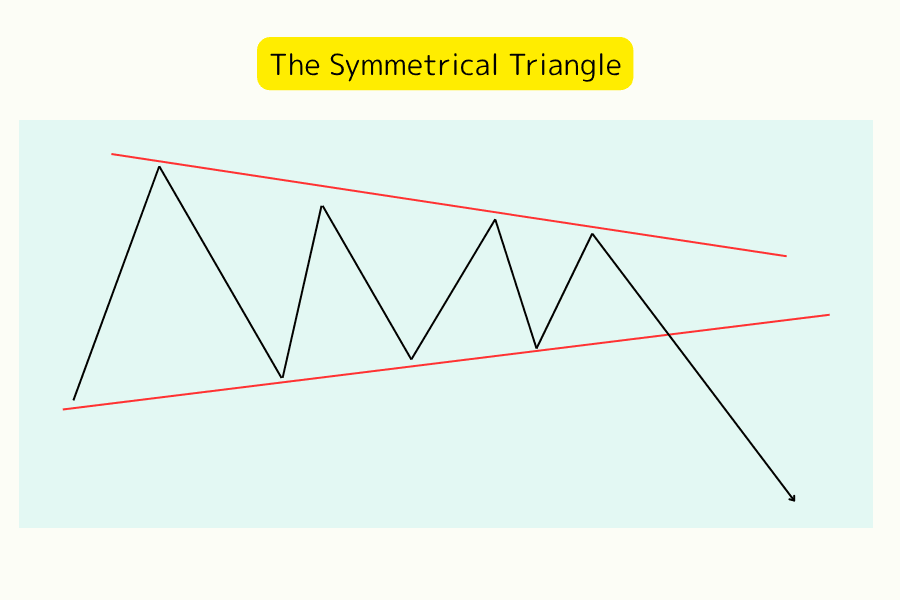
The symmetrical triangle is the most common variant. It is formed by declining highs and rising lows, with the two trend lines converging to the right into a symmetrical triangular structure. The pattern reflects gradual equilibrium between buyers and sellers, rising "wait-and-see" sentiment, and a price action that resumes only when one side gains the upper hand and the converging zone breaks.
A symmetrical triangle can appear during either an uptrend or a downtrend, and the breakout direction is not predetermined.
- When formed during an uptrend, an upside breakout typically extends the prior rally.
- When formed during a downtrend, a downside breakdown typically extends the prior decline.
The illustration below shows a typical symmetrical triangle structure where price oscillates within the converging range and finally breaks downward:
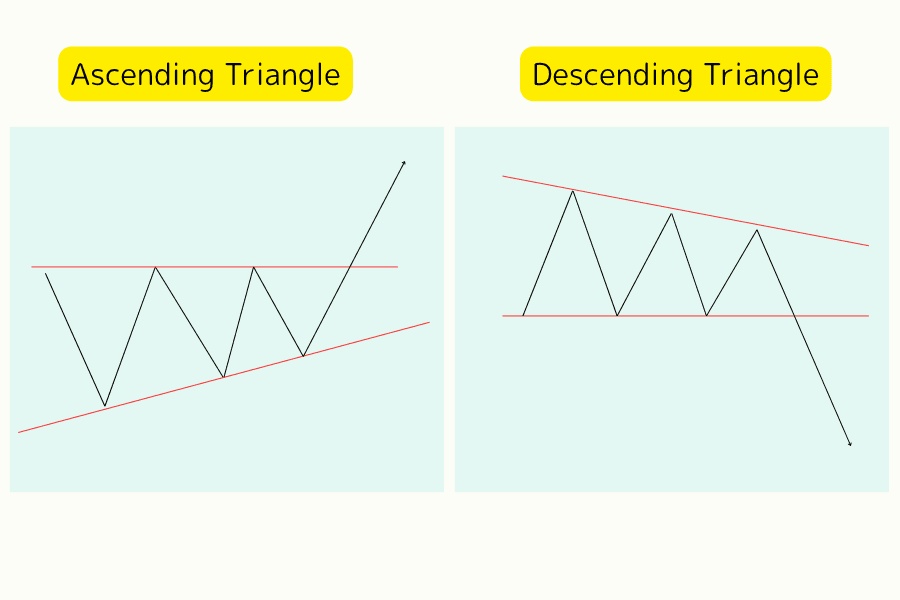
3. Ascending and Descending Triangles
Beyond the symmetrical triangle, the triangle family includes two other common variants — the ascending triangle and the descending triangle.
These two have different structures but share the same meaning: a consolidation phase before breakout, providing important signals of trend continuation.
| Pattern | Structural Features | Market Implication | Common Breakout Direction |
|---|---|---|---|
| Ascending Triangle | Horizontal resistance line on top, ascending support line below. | Buying pressure progressively increases while selling defense remains fixed. | Most often breaks upward. |
| Descending Triangle | Horizontal support line on bottom, descending resistance line above. | Selling pressure progressively increases while buying support gradually weakens. | Most often breaks downward. |
In live trading, breakouts from these triangles typically come with rising volume, indicating the market has chosen a direction. If price retraces to the original trend line and confirms support or resistance flip, that is generally considered the second-chance entry.
4. Trading Strategy and Application
The crux of trading a triangle pattern is the breakout.
Price oscillating within a converging range means the market is in a watch-and-wait phase, while a breakout above (or below) the trend line typically heralds the start of a new directional move.
Traders can build concrete plans around breakout direction and volume changes.
| Strategy Element | Operational Detail |
|---|---|
| Entry Strategy | When price executes a valid breakout of the converging zone with rising volume, this serves as an entry signal. Conservative traders wait for the price to retest the trend line and confirm support/resistance flip before entering. |
| Stop-Loss Placement | Place stops inside the converging zone or on the opposite side of the trend line to protect against false breakouts. For an upside break, place the stop inside the lower support line; for a downside break, inside the upper resistance line. |
| Target Price Calculation | Use the "height of the triangle base" as the measurement unit and project the same distance in the breakout direction to set a target price for estimating potential profit and take-profit zones. |
| Auxiliary Confirmation | Combine with volume, RSI, MACD and other technical indicators to confirm breakout strength and improve signal reliability. |
5. FAQ: Common Questions
Q1. How do triangles differ from other consolidation patterns like flags or rectangles?
The key difference is the shape of the trend lines. Triangle trend lines progressively converge (narrowing the volatility band), while flags are parallel channels (fixed band) and rectangles are horizontal upper/lower boundaries (price oscillates within a fixed range). Triangles indicate that buying and selling pressure are approaching balance, while rectangles and flags suggest distinct support/resistance structures.
Q2. Is the symmetrical triangle's breakout direction really unpredictable?
The chart alone makes direction hard to predict, so combining it with the prior trend direction is recommended — an upside break is more likely during an uptrend, while a downside break is more likely during a downtrend. In addition, whether volume expands at the breakout is the key indicator for telling a real breakout from a false one.
Q3. What is a "false breakout" and how do you avoid it?
A false breakout occurs when price briefly crosses the trend line and then rapidly returns to the converging zone. Common causes include lack of volume confirmation and intra-bar moves around major news releases. To avoid them: wait for a closing-price valid breakout (rather than a temporary intra-bar touch), confirm clear volume expansion, or wait for price to retest the trend line and confirm support/resistance flip before entering.
Q4. Does triangle reliability differ across timeframes (5-minute vs. daily)?
Yes. Generally, the longer the timeframe, the higher the triangle's reliability. Daily triangles represent deeper accumulated pressure, so post-breakout trends tend to extend further. By contrast, 5-minute and other short-timeframe triangles are more vulnerable to noise and have a higher false-breakout rate. Beginners are advised to start observing on 4-hour or daily charts.
Q5. Which financial products can triangle patterns be applied to?
Triangles are a universal chart-analysis tool applicable to major forex pairs, gold, crude oil, stock indices, crypto assets, and any market with sufficient liquidity. In illiquid products, low volume can distort the triangle structure, so triangles should be used cautiously in those cases.
6. Conclusion: The Value of Triangles in Trading
Triangle patterns are well-defined, broadly applicable technical formations that help traders read momentum changes during consolidation and anticipate breakout direction.
Whether symmetrical, ascending, or descending, the core concept is the same — trend continuation and momentum accumulation.
For traders, mastering triangles is not just about pattern recognition — it is about how to combine breakout signals with risk management.
By observing volume changes, waiting for retest confirmation, setting reasonable stops and targets, traders can substantially improve operational consistency.
In forex and CFD trading, triangles serve as an important reference for identifying trend development, helping traders on the Titan FX platform pinpoint entries and exits more precisely and operate within a strategic, disciplined trading workflow.
Further Reading
- What Is Technical Analysis?
- RSI Complete Guide
- MACD Complete Guide
- Forex Trading Strategy: A Complete Guide for Beginners
- Top 10 Mistakes New Forex Traders Make
Titan FX Research and Review Team — covering forex (FX), commodities (oil, precious metals, agricultural products), stock indices, US equities, and crypto assets, producing educational content for retail and institutional investors.
Primary Sources (by Category)
- Academic research: Robert D. Edwards & John Magee, "Technical Analysis of Stock Trends" (1948, classic reference for triangle pattern analysis); Thomas N. Bulkowski, "Encyclopedia of Chart Patterns" (empirical research on chart formations); John J. Murphy, "Technical Analysis of the Financial Markets" (textbook on technical analysis); Andrew W. Lo, "The Adaptive Markets Hypothesis" (Journal of Portfolio Management, 2004).
- Market data and indices: BIS Triennial Central Bank Survey on FX Turnover; CME Group price action data; CFTC Commitments of Traders Reports (COT, long-short positioning).
- Industry and third-party references: Investopedia (Symmetrical / Ascending / Descending Triangle entries); Bloomberg Markets (technical analysis coverage); Reuters; TradingView chart pattern library.
- Company sources: Titan FX internal technical-analysis materials, market research reports, and platform technical-indicator documentation.