Market Capitalization
In the stock market you often hear the term "market cap." It is not just an extension of share price — it is a key measure of a company's total value in the market.
Whether you are a beginner or experienced, understanding what market cap is, how it is calculated, and how to use it in strategy is essential. This article explains the fundamentals and practical use in plain terms.
- Definition: market cap = share price x shares outstanding (total market value)
- Total vs free-float: free-float uses tradable shares only; the basis for most indices
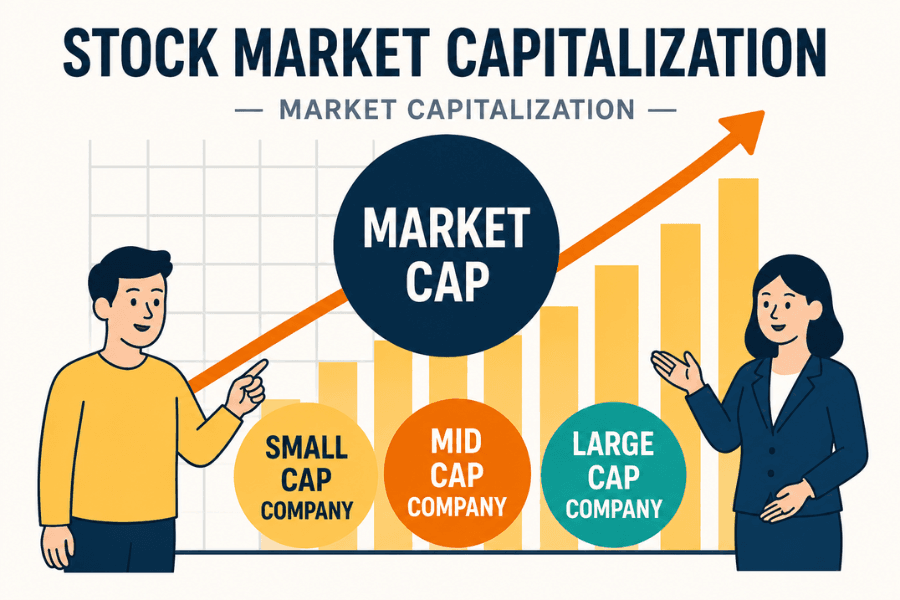
- Three tiers: large-cap (stable), mid-cap (balanced), small-cap (high growth, high risk)
- Investing use: tier-based allocation (e.g. 70/20/10, 50/30/20, 30/30/40)
- Limits: a reference value; pair with P/E, P/B, P/S, EV/EBITDA
1. Definition and Meaning of Market Cap
1-1. The basic concept
Market capitalization (market cap) is a company's total value in the market, calculated simply as "share price x shares outstanding." It reflects how the market values a company and is widely used to compare company sizes.
1-2. Role in company valuation
Market cap is a core size metric in equity markets. Large companies are typically industry leaders with strong capital and brand stability and higher risk resilience; small companies may offer more growth potential but carry higher risk. It also underpins the large/mid/small-cap classification.
1-3. Relationship with company size
Market cap reflects size but a higher figure does not mean better operations — it is influenced by market expectations, industry trends, and investor sentiment. Treat it as one reference and combine it with revenue, profit, and leverage data.
2. How Market Cap Is Calculated
2-1. The basic formula
Market Cap = Share Price x Shares Outstanding
Because the share price moves with trading, market cap is real-time and constantly changing.
Example:
- A company's share price is $50
- Shares outstanding are 200 million
then,
Market Cap = $50 x 200 million = $10 billion
So the company's total market value is $10 billion.
2-2. Free-float market cap
Besides total market cap, "free-float market capitalization" is common. It uses only the shares actually tradable in the market, excluding large-holder, government, and insider holdings.
Free-Float Market Cap = Share Price x Free-Float Shares
Most indices (e.g., MSCI, FTSE) use free-float market cap because it reflects the shares truly participating in trading.
2-3. Other valuation metrics (further learning)
| Metric | Formula | Main use |
|---|---|---|
| P/E Ratio | Price / EPS | Whether price is reasonable vs profit |
| P/B Ratio | Price / book value per share | Price vs book value, asset-heavy firms |
| P/S Ratio | Market cap / sales | Pre-profit or growth companies |
| EV/EBITDA | (Market cap + debt - cash) / EBITDA | Compare true value across capital structures |
Used alongside market cap, these give a fuller view of a company's fair value.
3. Largest Companies by Market Cap (Illustrative)
Based on public TradingView data, here is an illustrative list of the world's largest companies by market cap (market cap changes with the market, so this is an example only).
| Company | Sector | HQ |
|---|---|---|
| Microsoft Corporation | Technology | United States |
| NVIDIA Corporation | Semiconductors | United States |
| Apple Inc. | Electronics | United States |
| Amazon.com, Inc. | Retail | United States |
| Alphabet Inc. | Technology | United States |
| Meta Platforms, Inc. | Technology | United States |
| Saudi Arabian Oil Co. | Energy | Saudi Arabia |
| Broadcom Inc. | Semiconductors | United States |
| Tesla, Inc. | Consumer durables | United States |
| Berkshire Hathaway Inc. | Financials | United States |
| TSMC | Semiconductors | Taiwan |
| Tencent Holdings | Technology | China |
U.S. companies dominate the upper ranks, reflecting the United States' leading position in global capital markets. Taiwan's TSMC, China's Tencent, and Saudi Arabia's Saudi Aramco represent key forces in Asia and the energy sector. Technology firms lead overall, with financials and energy also holding solid market-cap bases.
4. Using Market Cap in Investment Decisions
Market cap is not only a size metric but a key basis for stock selection and asset allocation.
4-1. Classification by market cap
| Tier | Range (guide) | Characteristics |
|---|---|---|
| Large-cap | roughly $10B+ | Stable, low volatility, lower risk |
| Mid-cap | about $2B-$10B | Balanced growth and stability |
| Small-cap | about $250M-$2B | High growth potential, higher risk |
4-2. Market cap and risk
| Type | Traits | Suited investor |
|---|---|---|
| Large-cap | Industry core, stable revenue, resilient but limited upside | Conservative |
| Mid-cap | Growth stage, larger price swings, medium risk/return | Medium-term return seekers |
| Small-cap | High potential and fast growth but news-sensitive, high risk | Aggressive |
4-3. Portfolio allocation
| Profile | Large-cap | Mid-cap | Small-cap |
|---|---|---|---|
| Conservative | 70% | 20% | 10% |
| Balanced | 50% | 30% | 20% |
| Aggressive | 30% | 30% | 40% |
A sensible market-cap mix balances stability and growth while improving portfolio risk control.
5. Market Cap FAQ
Q1. Is a company with a higher market cap always better?
Not necessarily. Large-cap companies tend to be bigger and more stable, but growth can be slower. Small-cap companies may have more upside, but also higher risk.
Q2. Are market cap and share price the same?
No. Share price is the price of one share; market cap is share price times total shares outstanding. Market cap is what truly reflects company size.
Q3. What factors move market cap?
It moves with the share price and is influenced by company performance, industry trends, investor confidence, and the broader economic environment.
Q4. How are large-, mid-, and small-cap defined?
A rough USD guide: large-cap is roughly $10B+, mid-cap about $2B-$10B, and small-cap about $250M-$2B. Thresholds shift by market and over time, so treat them as relative concepts, not absolute rules.
Q5. How does market cap differ from enterprise value (EV)?
Market cap counts only equity (price x shares). Enterprise value = market cap + debt - cash, reflecting the true cost to acquire a company. When comparing firms with different capital structures, EV/EBITDA is usually fairer than market cap alone.
6. Conclusion
Market cap is a key investment-analysis metric that quickly conveys company size and market position. Different tiers suit different investor risk profiles. When investing, combine it with other financial metrics and allocate according to your own goals.
Further Reading
- What Is the P/E Ratio?
- What Is EPS?
- What Is a Stock Market Index?
- What Is GDP?
- What Is Forex Margin Trading?
Titan FX's financial market research and analysis team produces investor education content across a wide range of financial instruments, including foreign exchange (FX), commodities (crude oil, precious metals, and agricultural products), stock indices, U.S. equities, and crypto assets.
Primary Sources by Category
- Market cap and valuation fundamentals: Investopedia (Market Capitalization / Enterprise Value); FINRA (Market Cap)
- Index construction and free float: MSCI / FTSE Russell free-float adjustment general principles
- Ranking source: TradingView World Stocks (changes with the market)