Risk-Reward Ratio
In trading, attention often goes to the "win rate" — many believe that being right often enough guarantees steady profit.
In practice the opposite is common: even with a decent win rate, if each loss is larger than each gain, the long-run result can still be negative.
That is why the risk-reward ratio (also called the profit/loss ratio) is treated as a key part of trading risk management. Before entering, it lets a trader assess how much risk to take and how much potential reward to seek.
This article covers the definition, how to calculate it, its relationship with win rate, and how to plan it practically on MT4/MT5 using charts and tools — helping you build a more disciplined decision process.
- Definition: the risk-reward ratio (profit/loss ratio) compares a trade's potential loss and gain
- Formula: ratio = potential loss ÷ potential gain, measured by entry-to-stop and entry-to-target distance
- Win-rate link: a higher ratio lowers the breakeven win rate but makes the target harder to reach
- Setting it: decide dynamically by market structure and style; fix risk via the stop, back out the target
- On MT4/MT5: visualise stop and target on the chart so structure precedes emotion
1. What Is the Risk-Reward Ratio?
The risk-reward ratio, also called the profit/loss ratio, measures the relationship between the "potential loss" and "potential gain" of a single trade. Put simply, it shows how much risk you take to seek how much possible reward.
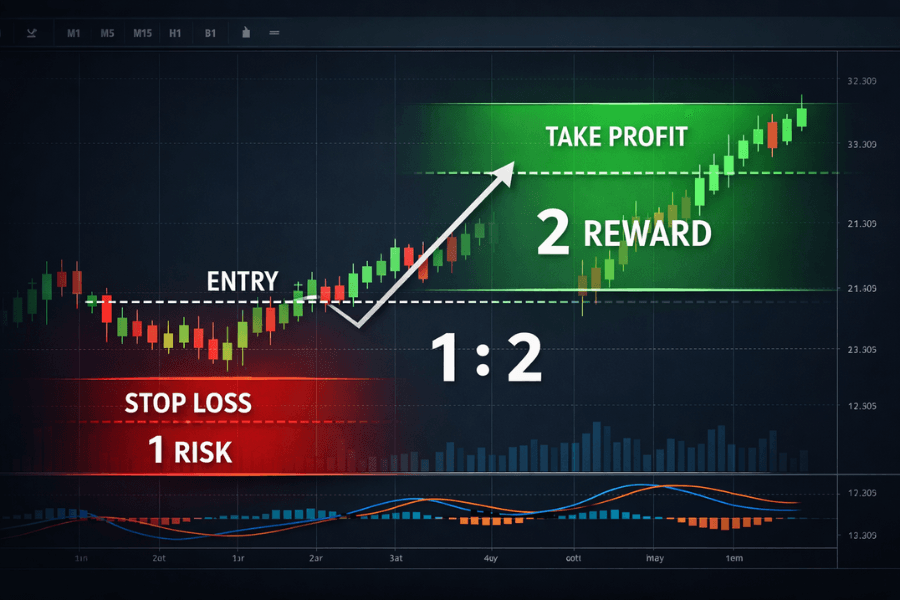
In practice, risk is the distance between the entry price and the stop-loss price, while reward is the distance between the entry price and the take-profit price. For example, a 50-pip stop and a 100-pip target give a 1:2 ratio (risk 1 to seek 2).
Many traders focus on whether the direction is right, but long-run performance depends on the profit/loss structure. A "small wins, big losses" pattern can still net negative even with a non-low win rate. The value of the ratio is making you define stop-loss and take-profit before entry, reducing emotional interference and building consistent risk logic.
Note that the ratio alone does not determine whether a strategy is profitable; it must be observed together with win rate. Only when the two combine reasonably can a strategy have a long-run edge.
2. How to Calculate It
The calculation essentially compares "how much you may lose" and "how much you may gain" in one trade, measured by the distances between entry, stop-loss, and take-profit.
Basic formula:
Risk-Reward Ratio = Potential Loss ÷ Potential Gain
Risk is the distance from entry to stop-loss; reward is the distance from entry to take-profit.
For example, with entry 1.1000, stop at 1.0950 (50 pips), and target 1.1100 (100 pips), risk is 50 pips and reward 100 pips — a 1:2 ratio.
Common ratios include 1:1, 1:1.5, 1:2, and 1:3 or higher. A higher value means greater potential reward, but the price must travel farther, so it is harder to reach.
You can also think in money. A 50-dollar stop and a 100-dollar target is still a 1:2 structure: risking 50 dollars for a 100-dollar opportunity.
Before any trade, set entry, stop-loss, and take-profit explicitly, or the ratio loses practical meaning. Bigger is not automatically better; what matters is whether the target fits market structure and is realistically achievable.
3. Risk-Reward Ratio and Win Rate
In a strategy, win rate and the risk-reward ratio are generally a trade-off. Pursuing a higher ratio (1:3, 1:4) puts the target farther away and harder to reach, so win rate tends to fall; conversely, raising win rate usually means a nearer target, lowering the ratio.
So the key is not simply chasing a high win rate or a high ratio, but finding a balance between the two that can be sustained long-term.
From a breakeven standpoint, the minimum win rate required at each ratio is:
| Risk-Reward | Meaning | Breakeven Win Rate |
|---|---|---|
| 1:1 | lose 1, win 1 | 50% |
| 1:2 | lose 1, win 2 | about 33.3% |
| 1:3 | lose 1, win 3 | about 25% |
| 1:4 | lose 1, win 4 | about 20% |
| 1:5 | lose 1, win 5 | about 16.7% |
Note: these are theoretical breakeven win rates; real trading must also account for spread, slippage, and commission costs.
One important conclusion follows: as long as a single gain exceeds a single loss, a strategy can have positive expectancy even without a high win rate.
For example, at 1:2 a roughly 30% win rate can stay break-even long-term; at 1:3 the required win rate falls further.
But higher is not always better. The farther the target, the lower the probability of reaching it and the harder to execute. Over-idealised settings prevent a strategy from performing stably.
In practice there are two common styles:
- High win rate, low risk-reward: common in short-term trading, accumulating small gains, but single losses must be tightly controlled so one big loss does not erase many small wins
- Low win rate, high risk-reward: common in swing or trend trading, fewer wins but a few big moves drive overall profit
When evaluating a strategy, the focus is not "how many wins" but whether the overall structure is sound. If the ratio-and-win-rate combination forms positive expectancy and can be executed steadily, it has long-term sustainability.
4. How to Set a Reasonable Ratio
Setting the ratio is not just choosing 1:2 or 1:3; it must follow market structure and trading logic. A reasonable ratio rests on the premise that "price has a chance to get there," not merely a numerical advantage.
First, align the ratio with technical structure. Stop-loss usually sits beyond support or resistance, while take-profit can reference the next key range. Forcing a far target where the market has limited room lowers the realisation probability.
Second, requirements differ by style. Short-term trading favours higher win rate, so the ratio often sits at 1:1 to 1:1.5; swing or trend trading widens the target with 1:2 or higher, accepting a lower win rate for overall reward.
Third, pair the ratio with risk control. In practice, fix per-trade risk via the stop distance first, then back out a reasonable take-profit, keeping the structure consistent rather than adjusting targets arbitrarily after entry.
Many traders use tools to assist. They mark key prices on the chart or use a simulator to watch capital change under different risk settings. Titan FX's asset-portfolio simulator can test how different ratios and risk proportions affect the equity curve.
Overall, a reasonable ratio is not a fixed value but is adjusted dynamically with market structure, style, and risk tolerance. The point is not how high it is but whether it is actually executable.
5. Using It on MT4/MT5
The risk-reward ratio does not stay in a formula; it must be shown on the chart to become an executable decision. That is the key value of platforms like MT4 and MT5.
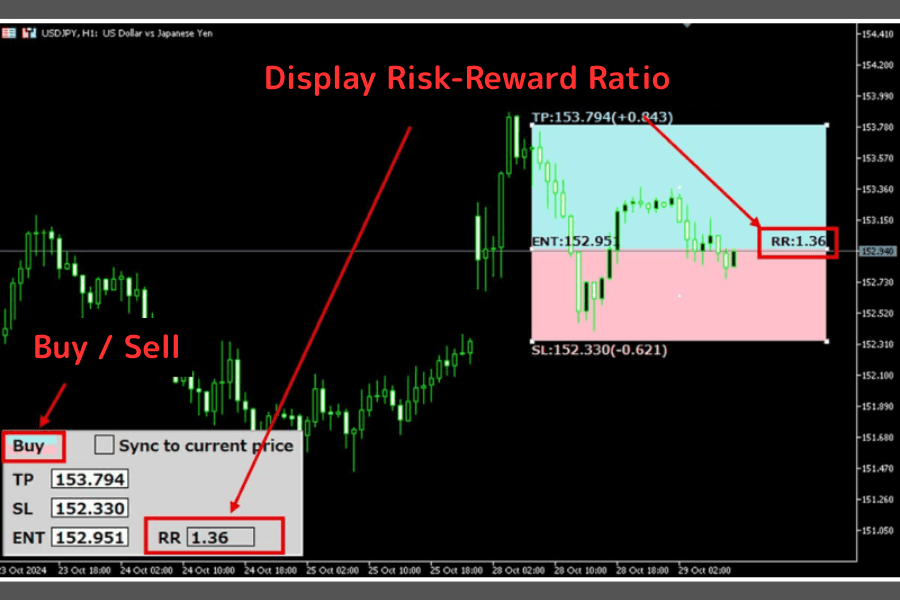
The most basic use is marking "stop-loss" and "take-profit" before entry. The distance between the two prices quickly tells you whether the current ratio is reasonable. If the target distance is clearly smaller than the stop distance, the structure is weak and needs review.
Beyond manual calculation, tools improve efficiency. In Titan FX's MT4/MT5 environment you can use a dedicated indicator, for example RR Assistant, to mark stop and target ranges on the chart and auto-compute the corresponding ratio and risk range.
The advantages of such tools:
- Visualise the ratio and avoid trading on feel
- Confirm before entry whether the trade structure is reasonable
- Adjust the risk proportion together with position control
With chart and tool support, you do not recompute every trade but quickly judge "is this trade worth taking."
Overall, MT4/MT5 is not just an order tool but a key environment for putting the risk-reward ratio into real trading. When each trade defines risk and reward before entry, overall strategy stability improves markedly.
6. Frequently Asked Questions (FAQ)
Q1. Does the risk-reward ratio always have to be 1:2 or higher?
No. 1:2 is a common benchmark but not the only standard. What matters is whether your win rate and risk-reward ratio together form a positive expectancy, not chasing a fixed number.
Q2. Does a high win rate mean a strategy is good?
Not necessarily. A "small wins, big losses" profile can erase profits with a few losers even at a high win rate. Win rate must be assessed together with the risk-reward ratio.
Q3. Why do I often win small and lose big?
Usually the risk-reward ratio is too low, or stop-losses are not enforced. When a single loss exceeds several wins, long-run results turn negative.
Q4. Is a higher risk-reward ratio always better?
No. A higher ratio puts the take-profit target farther away and harder to reach. Unrealistic settings actually lower the overall win rate.
Q5. How should I start practising?
Begin with 1:1 or 1:2, pair it with a fixed stop-loss and position control to build stable discipline, then optimise the structure gradually.
7. Conclusion
The risk-reward ratio is not a single number; together with win rate it forms the core structure of a trading strategy.
What truly matters is not chasing a high win rate or a high ratio, but combining the two into positive expectancy that can be executed steadily.
In real trading, defining stop-loss and take-profit explicitly, paired with chart tools and risk-control methods, lets each trade define risk and reward before entry.
When decisions rest on structure and discipline rather than emotion and intuition, stable long-term results become realistic.
Further Reading
- What Is a Stop Loss?
- What Is Slippage?
- What Is Forex Spread?
- What Is the RSI Indicator?
- What Is the MACD Indicator?
Titan FX Research Hub — investor education across foreign exchange, commodities (oil, precious metals, agriculture), stock indices, U.S. equities, and crypto assets.
Primary Sources (by category)
- Definition and calculation: Investopedia / Babypips (Risk/Reward Ratio); general public knowledge on trading risk management
- Win rate and expectancy: general breakeven win-rate formula (mathematical definition); public trading-education material
- MT4/MT5 usage: MetaQuotes official documentation (general features); Titan FX platform public information