Dividend on Equity (DOE)
As high-dividend strategies draw more attention, relying on dividend yield alone is no longer enough to judge how well a company rewards its shareholders. Share-price swings and short-term profit fluctuations tend to strip surface-level high yields of their meaning. Starting instead from a company's capital structure makes it far easier to see a durable, stable logic of profit-sharing.
Dividend on Equity (DOE) — also known as the "shareholders' equity dividend rate" — is the metric designed to close this blind spot. By tying dividends directly to shareholders' equity, DOE helps investors judge the allocation policy and stability a company exhibits on top of its existing capital base. This guide walks through the definition, calculation, and practical application so you can build a more complete dividend-analysis framework.
1. What Is Dividend on Equity (DOE)?
Dividend on Equity (DOE) measures a company's ability to generate dividends out of its shareholders' equity. More precisely, it reflects the share of actual cash dividends that flow back to shareholders on the base of existing shareholders' equity.
In other words, DOE answers: for every unit of shareholders' equity the company holds, how much dividend is returned to shareholders?
The value of this metric is that it offers a lens distinct from earnings or share price. A company may have stable profits, but if it chooses to retain those funds for expansion, the actual cash returned to shareholders will still be limited. By contrast, DOE directly reflects a company's dividend policy and how it deploys capital.
Compared with dividend yield — which is easily swept around by market prices — DOE provides a relatively stable yardstick, letting investors step away from share-price noise and focus on a company's true ability to deliver returns on shareholders' equity.
2. How Is DOE Calculated?
DOE is not a single-source data point. It is a ratio formed by combining "dividend payouts" with "shareholders' equity." In practice, two forms are used: a total-amount calculation and a per-share calculation.
Basic Formula
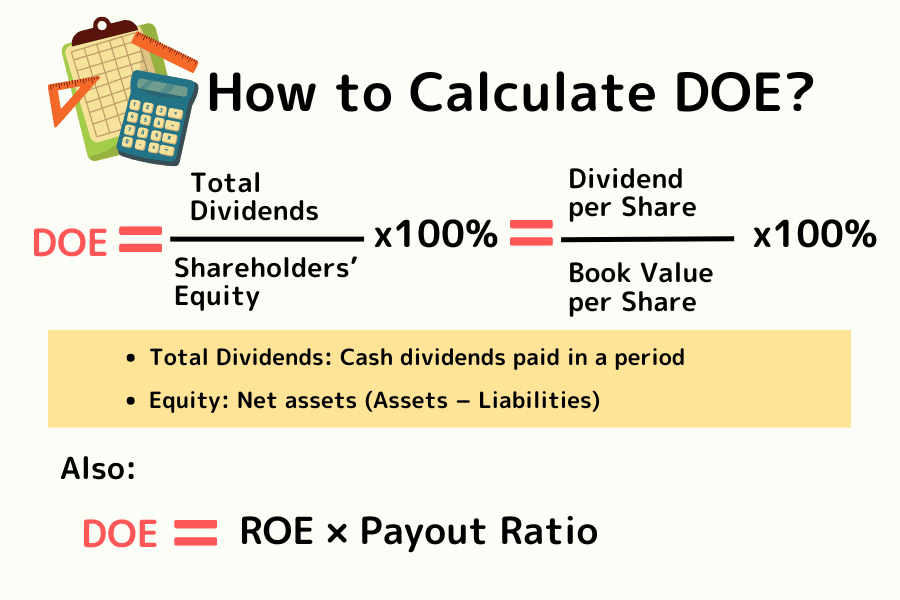
DOE = (Total Dividends ÷ Shareholders' Equity) × 100%
Where:
- Total Dividends: the actual cash dividends paid out during the period
- Shareholders' Equity: the residual value attributable to shareholders after deducting liabilities from assets (typically paid-in capital + capital surplus + retained earnings)
Or, on a per-share basis:
DOE = Dividend Per Share (DPS) ÷ Book Value Per Share (BPS) × 100%
Decomposition (Relationship with ROE)
DOE can also be decomposed as follows:
DOE = Return on Equity (ROE) × Payout Ratio
This means DOE simultaneously reflects two core dimensions:
- ROE (earning power): how efficiently the company turns shareholders' capital into profit
- Payout Ratio (return policy): how willing the company is to distribute its profits to shareholders
When ROE is high but DOE is low, the company is typically retaining earnings for reinvestment rather than returning them directly to shareholders.
One caveat: when the payout ratio exceeds 100%, DOE can temporarily run higher than ROE. This means the company is paying out more than the current year's earnings — often by dipping into retained earnings — and the sustainability of that payout deserves close attention.
Worked Example
Suppose Mr. Tanaka's coffee shop has shareholders' equity of US$1,000,000, earns a profit of US$100,000 last year (ROE 10%), and decides to pay out US$50,000 as a cash dividend (payout ratio 50%).
Then DOE = 50,000 ÷ 1,000,000 = 5% (equivalently, 10% × 50%).
Shareholders' equity here refers to the company's total net assets, not just paid-in capital. In practice, it typically includes paid-in capital, capital surplus, and retained earnings.
3. DOE vs. Other Metrics
In financial analysis, no single metric captures every facet of a company. To judge the quality of a dividend more precisely, it helps to make clear how DOE differs from commonly used metrics in "what it measures." Both dividend yield and payout ratio reflect distribution, but only DOE sidesteps share-price volatility and single-year profit swings by tying distributions directly to the company's underlying capital base.
The table below summarizes the core differences between these four key metrics — an at-a-glance reference for switching between them as your question changes.
| Dimension | Dividend on Equity (DOE) | Dividend Yield | Payout Ratio | Return on Equity (ROE) |
|---|---|---|---|---|
| Formula | DPS ÷ BPS | DPS ÷ Share Price | DPS ÷ EPS | EPS ÷ BPS |
| Stability | High / equity book value moves slowly | Low / swept by daily price moves | Medium / varies with annual profit | Medium / reflects yearly operating efficiency |
| Role | Measures the company's willingness to return to shareholders | Measures the cash yield on current invested capital | Measures how much profit is paid out as dividends | Measures the efficiency of generating profits from equity |
| Core question | How "generous" is the company? | Is this dollar invested paying off? | Is the company keeping enough profit back? | Is this a good business to be in? |
| What to watch | Consistency and commitment of the dividend policy | Cost efficiency of the purchase price | Whether over-distribution is hurting expansion | Long-term competitiveness and earnings quality |
Looking across these columns, DOE stands out as the key bridge between a company's "book strength" and the shareholder's pocket. Compared with dividend yield, which is swayed by market sentiment, DOE offers a more stable and sustainable vantage point — letting investors step past price noise and focus on the logic of how a company allocates its own capital.
4. How to Combine DOE with Other Metrics
Looking at DOE on its own can leave blind spots. Combination analysis with other metrics gives you a far more reliable filter for quality names.
Combination 1: DOE + ROE
This is the foundational pairing. Ideal companies exhibit both a high ROE and a stable DOE. High ROE indicates that the core business is genuinely efficient at generating profit, while a stable DOE shows that the company consistently and disciplinedly returns those profits to shareholders.
A cautionary note: if the payout ratio stays above 100% for an extended period, DOE can run higher than ROE in the short term. This means dividends exceed current-year earnings, likely by drawing on accumulated retained earnings — a dynamic whose sustainability requires careful scrutiny.
Combination 2: DOE + Cash Flow Statement
Dividends are real cash outflows, so it's essential to confirm a company has sufficient free cash flow to support the payout. Even if DOE looks excellent, a cash flow statement that shows chronic net cash outflows means the dividend policy is unlikely to hold up.
Combination 3: DOE + Debt Ratio
Some companies maintain dividend levels by borrowing to fund payouts. Investors should pair DOE with the balance sheet to confirm that growth in shareholders' equity comes primarily from retained earnings rather than from rising debt leverage.
5. FAQ: Nuances of Reading the DOE
Q1: Is a higher DOE always better?
Not necessarily. An excessively high DOE can indicate that the company is devoting most of its profits to dividends, sacrificing future reinvestment and growth capacity. Growth companies typically run low DOE; for mature industries such as utilities or financials, a relatively high and stable DOE tends to be more reasonable.
Q2: Why do Japanese companies place particular emphasis on DOE?
Japanese companies have historically attracted market attention for low capital efficiency and elevated cash balances. Under recent Corporate Governance Code reforms, some firms now use DOE as a reference for dividend policy — signaling a steady commitment to shareholder returns and improving both capital-use efficiency and investment appeal.
Q3: How should I interpret a sudden drop in DOE?
First, check whether the denominator — shareholders' equity — has expanded significantly. An equity raise or asset revaluation can dilute DOE. If instead the numerator (total dividends) has fallen, the company may have shifted its dividend policy, and its distribution strategy warrants reassessment.
6. Summary: The Role of DOE in Investment Strategy
Dividend on Equity (DOE) is a key metric for measuring "return on shareholders' equity." Relative to dividend yield — which is heavily exposed to share-price noise — DOE speaks more directly to the company's allocation policy and the stability of its returns on top of its existing capital base.
In practical analysis, avoid leaning on any single metric. Combine DOE with ROE, cash flow, and debt structure for a full picture. When you can read both the earning power and the distribution strategy of a company at the same time, its operating direction and long-term investment value become far clearer.
Titan FX Trading Strategy Research Institute
The financial markets research team at Titan FX. Produces educational content for investors across a broad range of asset classes, including foreign exchange (FX), commodities (crude oil, precious metals, agricultural products), stock indices, US equities, and cryptocurrencies.
Primary sources: SEC EDGAR, NYSE Listed Companies, Tokyo Stock Exchange, FSA Corporate Governance Code, Bloomberg, Reuters