Return on Assets (ROA)
When reading financial statements, many investors start by searching "what is ROA," "return on assets formula," or "what's a good ROA" to quickly gauge a company's fundamentals.
Return on Assets (ROA) is one of the core metrics for evaluating a company's operating efficiency and resource deployment. By working through the ROA formula and its practical applications, you can see whether a company is turning its assets into steady profit, and how ROA differs from ROE — giving you sharper ground for stock selection and long-term strategy.
- 1. What Is Return on Assets (ROA)? Core Concept
- 2. How to Calculate ROA: Decoding Earning Power Step by Step
- 3. What's a "Good" ROA? Industry-Level Observations
- 4. ROA vs. ROE: What's the Difference?
- 5. Practical: Using ROA in Investment Decisions
- 6. FAQ: Reading ROA - Pitfalls and Nuances
- 7. Summary: The Role of ROA in Stock Selection
1. What Is Return on Assets (ROA)? Core Concept
Return on Assets (ROA) measures a company's ability to generate profit from its total assets. It shows how much profit the company produces for every $1 of assets it has in play. In the financial statements, assets include every revenue-generating resource: cash, inventory, plant, equipment, land, and so on.
Core Value
This metric's core value lies in focusing on efficiency of asset use rather than the absolute profit figure. A company might report high net income, but if it took a large pile of assets to get there, operating efficiency isn't actually that good.
If two companies earn the same profit but Company A runs on US$10 billion of assets while Company B uses only US$5 billion, Company B is clearly the more efficient operator. A higher ROA means the company turns resources into profit more effectively — making it an important signal of management quality.
2. How to Calculate ROA: Decoding Earning Power Step by Step
ROA itself isn't hard to calculate — the trick is pulling the right numbers from the income statement and balance sheet.
Core Formula:
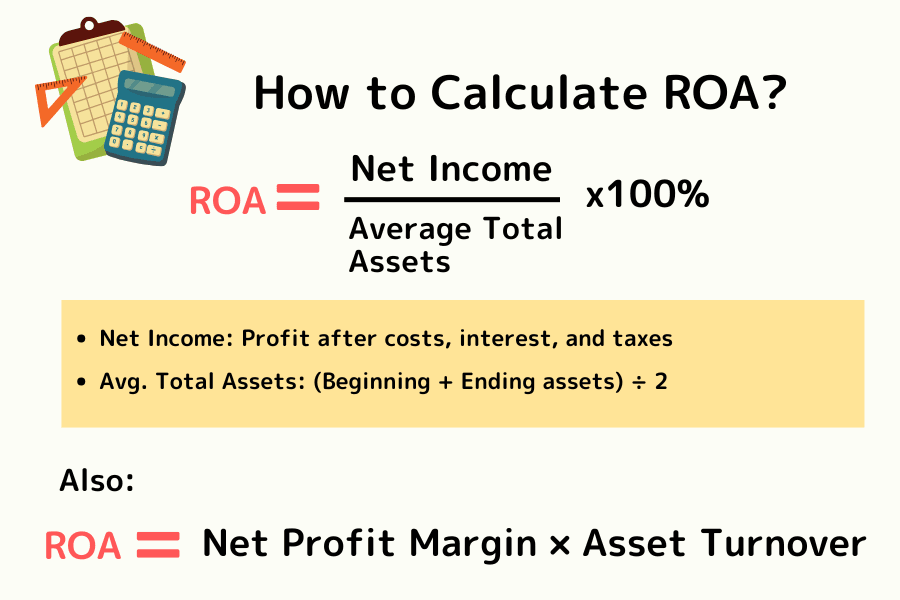
ROA = (Net Income ÷ Average Total Assets) × 100%
- Net income: The company's final profit after all costs, interest, and taxes.
- Average total assets: To avoid distortion from a single-point snapshot, most analysts use "(Beginning Total Assets + Ending Total Assets) ÷ 2" to better reflect asset usage across the year.
Worked Example
Say "Future Tech Co." earned US$10 million net income last year, with average total assets of US$100 million. Its ROA = 10% (10M ÷ 100M). That is, for every $100 of assets, the company produced $10 of profit in a year.
Going Further: DuPont Analysis
Why might two companies with the same ROA look completely different — one a boutique, the other a big-box retailer? DuPont analysis decomposes the formula to reveal the earning DNA:
ROA = (Net Income ÷ Revenue) × (Revenue ÷ Average Total Assets)
That is: ROA = Net Margin × Asset Turnover
A company can lift ROA in two main ways:
-
High-margin mode: Thick profit per unit through differentiation, brand, or technical moats (luxury brands, leading-edge semiconductors). Volumes may not be enormous, but generous per-unit profit sustains a high return rate.
-
High-turnover mode: Thin margins per unit offset by strong supply-chain and sales velocity (big-box retailers, fresh-food chains). By "selling fast," the company keeps capital in motion and accumulates meaningful returns.
Screening tip: When you see ROA improving, dig further: is it from "thicker profit per unit" or "faster turnover"? If both rise together, the company likely has top-tier industry competitiveness and managerial efficiency.
3. What's a "Good" ROA? Industry-Level Observations
Beginners often ask: "Shouldn't ROA be above 10% to count as a great company?" The answer depends on industry characteristics.
Asset-heavy industries — semiconductor manufacturing, display panels, traditional steel — need enormous capital for machines and plants. With a huge asset denominator, ROA runs low by default.
Asset-light industries — software, ad consulting, fabless IC design — have people and patents as their core "assets." Without expensive hard assets, the denominator is small, and ROA can easily exceed 15% or even 20%.
There is no universal bar. ROA must be weighed on the industry scale. Typical ROA ranges for common US-equity categories:
| Industry | Typical ROA | Characteristics | Example Companies |
|---|---|---|---|
| Asset-light (Software, IC Design) | 10% - 20%+ | People and patents; no expensive plants | Microsoft (MSFT), MediaTek |
| Asset-heavy (Foundry, Steel) | 3% - 8% | Huge capex; heavy depreciation | TSMC (TSM), Nucor |
| Financials (Banks, Insurance) | 0.5% - 1.2% | Leverage-driven; enormous asset base | JPMorgan Chase, MetLife |
Judgment Rule
The biggest mistake in reading ROA is cross-industry comparison. The right move is to compare the target company with its same-industry peers horizontally, or look at its own 3-5 year history vertically — to see whether operating efficiency is improving or deteriorating.
4. ROA vs. ROE: What's the Difference?
This is where investors get confused the most. Both metrics measure return rates, but "total assets" and "shareholders' equity" differ fundamentally in structure.
The Core Difference
Return on Equity (ROE) measures how efficiently a company uses "money shareholders put in" to earn returns. ROA goes a step further — it considers both shareholder capital and money borrowed from creditors.
ROA vs. ROE: Selection Logic
| Dimension | Return on Assets (ROA) | Return on Equity (ROE) |
|---|---|---|
| Focus | Total company resources | Shareholder-contributed capital |
| Denominator | Total Assets (liabilities + equity) | Shareholders' Equity |
| Leverage impact | Low - reflects true efficiency | High - more debt can inflate ROE |
| Primary use | Judge management's skill at using resources | Judge wealth creation for shareholders |
When ROA Matters More
When a company leverages up heavily to expand, ROE can balloon because the denominator shrinks — making the business look tempting. But if ROA drops at the same time, that debt isn't generating the returns it should. ROA then acts as a warning signal about excessive financial leverage.
Use both metrics together for a rounded view of a company's financial health.
5. Practical: Using ROA in Investment Decisions
Once the theory is in place, investors can treat ROA as a screening funnel, working outside-in through these four advanced strategies to isolate truly high-quality businesses.
Strategy 1: Find the Efficiency Champions (Initial Filter)
Prioritize names whose ROA sits in the top 25% of their industry long-term. Above-peer ROA usually signals stronger pricing power and tighter cost discipline. Through industry downturns, this type of high-efficiency operator tends to have greater staying power.
Strategy 2: Watch the Long-Term Trajectory (Stability Check)
Directionality over multiple years tells you more than a single-year snapshot. Steadily rising ROA often signals scale economies at work. Steadily falling ROA — even if net income keeps growing — means the company is stuck in a "more assets in, less profit out" diminishing-returns trap.
Strategy 3: Pair with Debt Analysis (Leverage Test)
This is what separates "quality growth" from "leveraged illusion." Look at the gap between ROA and ROE. If ROE is 20% but ROA is only 2%, the business depends heavily on financial leverage — and rising interest rates could crush earnings for that profile.
Strategy 4: Cross-Check with the Cash Flow Statement (Earnings Quality)
The last line of defense. High ROA must be backed by operating cash flow. If ROA is stable while operating cash flow grows in step, profits are genuinely converting to cash. If ROA looks high but operating cash flow is persistently negative, watch out — it could be an accounting illusion inflated by receivables.
6. FAQ: Reading ROA - Pitfalls and Nuances
Q1: Does a high ROA always mean I should buy?
Not necessarily. Some companies' ROA spikes due to non-operating income from asset sales (land, plants). These gains aren't recurring. Check operating income on the income statement to make sure the profit came from the core business.
Q2: Why do banks and insurers have ROA below 1%?
Banks' and insurers' business models are fundamentally about leveraged balance sheets — they manage huge volumes of deposits and premiums. Their total assets are enormous, so low ROA is the industry norm. That is also why ROE tends to matter more than ROA when analyzing financials.
Q3: What if ROA turns negative?
It means the company is currently loss-making. Determine whether it is temporary (one-off impairment) or structural decline. Two or three consecutive years of negative ROA typically warrants avoidance.
Q4: Does company size affect ROA?
Large companies often have lower ROA due to larger asset bases. Evaluate alongside growth and profitability for a fair picture.
7. Summary: Building a Complete Efficiency View
Return on Assets (ROA) provides a clean lens for operating efficiency, letting investors assess long-term competitiveness from the resource-utilization angle. Understanding the formula and industry differences keeps you from making one-sided judgments based only on net income or EPS.
In practice, pair ROA with ROE, debt ratios, and cash flow to see whether a company generates steady profits under a healthy financial structure. When ROA sits at the top of its industry range long term and trends stably or upward, it signals a certain caliber of operating efficiency and management capability.
Building an ROA-centric analytical habit sharpens stock selection and helps you avoid companies leaning on leverage or short-term profit tricks — compounding into steadier results over time.
Titan FX Trading Strategy Research Institute
The financial markets research team at Titan FX. Produces educational content for investors across a broad range of asset classes, including foreign exchange (FX), commodities (crude oil, precious metals, agricultural products), stock indices, US equities, and cryptocurrencies.
Primary sources: SEC EDGAR, NYSE Listed Companies, IFRS, U.S. GAAP (FASB), Bloomberg, Reuters