Continuation Patterns: Features and Strategies
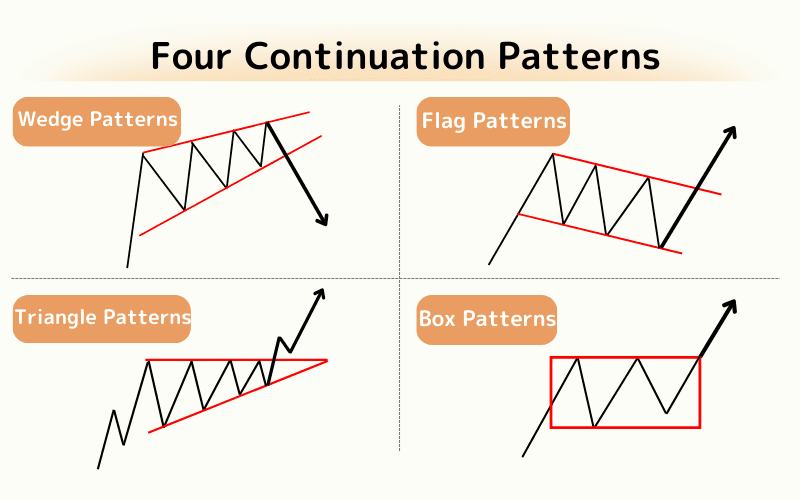
A continuation pattern is a chart formation where price pauses or consolidates within a trend before resuming in the same direction. The four classic types are the wedge, triangle, flag, and box.
These patterns help traders spot the market's "rest periods" and anticipate when a trend will resume before the breakout. This article breaks down the structure and practical use of each of the four continuation patterns.
- Continuation patterns are mid-trend consolidations that usually signal the prior trend will resume
- Four classic types: wedge, triangle, flag and box
- Wedges split into rising/falling; triangles into symmetrical/ascending/descending, each with a breakout bias
- Confirm by waiting for a breakout on rising volume, and use the pattern's height to project a target
- Watch for false breaks — combine with volume and other indicators and set strict stops
1. What Are Continuation Patterns?
Continuation patterns, also called consolidation or retracement patterns, appear on financial charts to mark a temporary pause or consolidation following a strong trend in markets like forex and stocks.
These patterns, such as Wedge, Flag, Triangle, and Box, generally indicate that the prior trend will continue.
In essence, continuation patterns allow traders to identify temporary pauses in the market before the trend resumes or prepares to reverse.
2. Wedge Patterns
Wedge patterns are common trend reversal or continuation patterns, characterized by price converging between two trendlines, forming a wedge-like shape.
Wedge patterns consist of two trendlines: one connecting rising or falling lows, and the other connecting rising or falling highs. These lines converge at a common point.
Wedge patterns can be classified into two types: Rising Wedge and Falling Wedge, each indicating different market expectations.
During the formation of a wedge pattern, trading volume usually decreases, reflecting weakening market momentum and increasing the likelihood of a breakout.
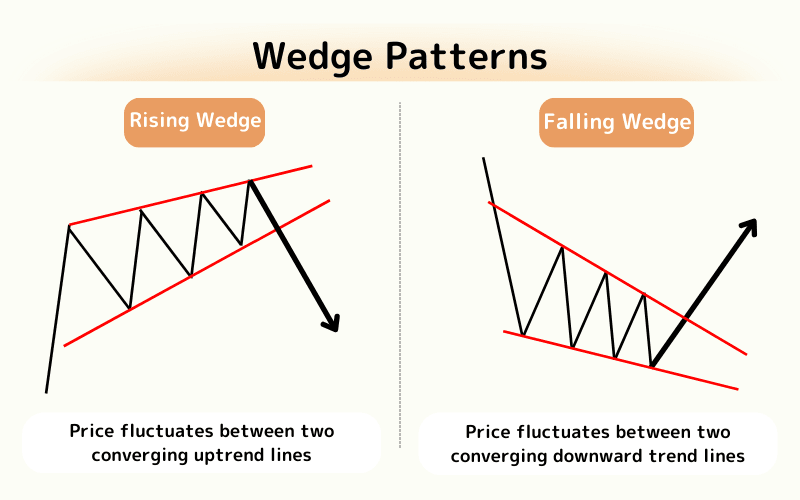
Rising Wedge: Typically occurs at the end of an uptrend, signaling a potential reversal and a price drop.
Falling Wedge: Usually forms at the end of a downtrend, often acting as a continuation signal, suggesting a price rebound.
Read more about Wedge Patterns and Strategies3. Triangle Patterns
Triangle patterns show price movement within converging trendlines, forming a distinct triangle shape.
One trendline connects descending highs, while the other connects ascending lows, indicating that the forces of supply and demand are gradually converging at a single point.
As a triangle pattern forms, trading volume typically decreases, signaling increased uncertainty among market participants regarding future price direction.
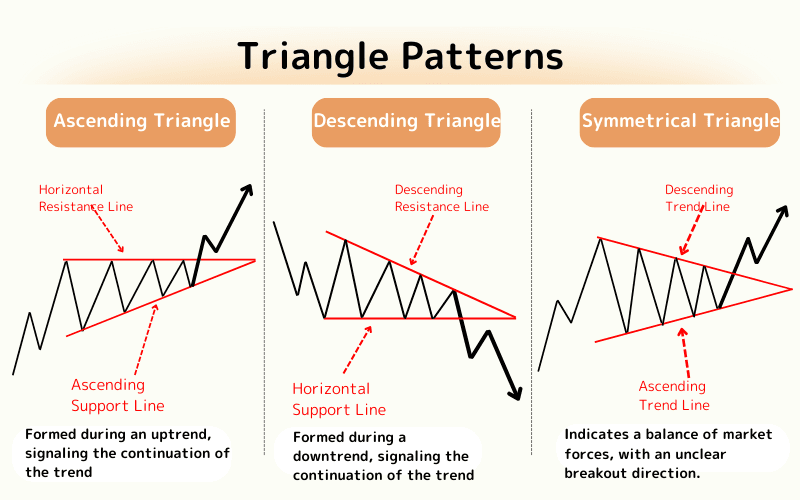
There are three primary types of triangle patterns: Ascending Triangle: Forms during an uptrend, suggesting the trend may continue.
Descending Triangle: Forms during a downtrend, indicating the trend may continue.
Symmetrical Triangle: Indicates balanced market forces, with an unclear breakout direction that requires further price movement to determine.
Read more about Triangle Patterns and Strategies4. Flag Patterns
Flag patterns are continuation patterns formed on charts, resembling a flag fluttering in the wind.
Flag patterns consist of two parts: one trendline (the flagpole) followed by a small, parallel price consolidation range (the flag).
During the formation of a flag pattern, volume typically increases during the flagpole's formation and decreases as the price enters the flag consolidation period, reflecting a brief rest after a strong price move.
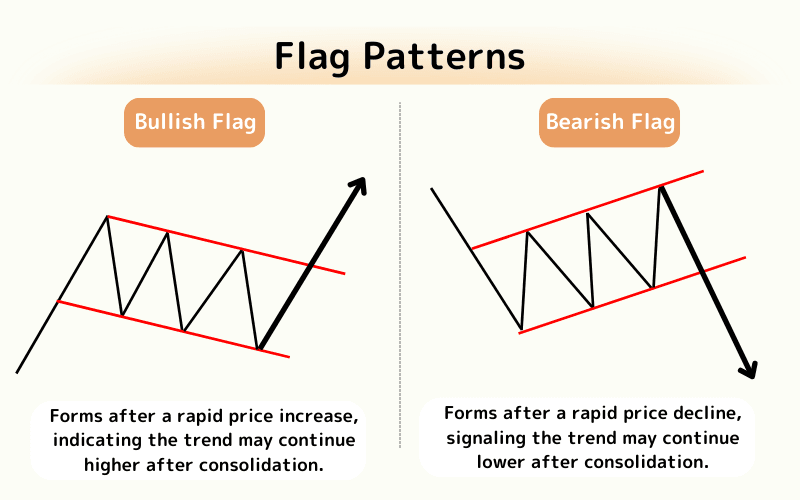
There are two types of flag patterns: Bullish Flag: Forms after a rapid price increase, indicating the trend may continue higher after consolidation.
Bearish Flag: Forms after a rapid price decline, signaling the trend may continue lower after consolidation.
Read more about Flag Patterns and Strategies5. Box Patterns
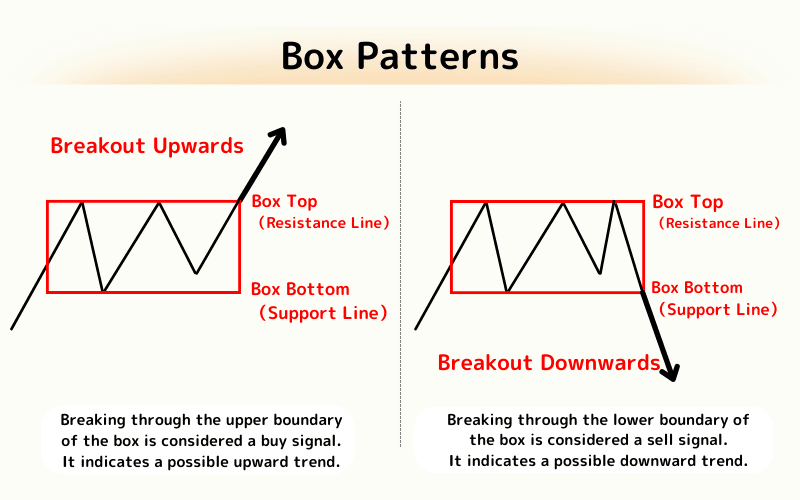
Box patterns, also known as Box Theory or rectangular patterns, consist of two main components: the upper and lower limits of price fluctuations, forming a box-like shape with resistance (upper boundary) and support (lower boundary).
Box patterns can either break upwards or downwards, depending on the direction of the breakout.
During the formation of a box pattern, volume often varies, being higher in the initial stages and decreasing as the price stabilizes within the box, reflecting market indecision during this period.
Box patterns are considered stages of market rest and energy accumulation, preparing for an upcoming breakout.
If price breaks through the upper boundary, it suggests a price increase; if it breaks through the lower boundary, it indicates a potential price decrease.
Read more about Box Patterns and Strategies6. Frequently Asked Questions
Q1. How do continuation patterns differ from reversal patterns?
Continuation patterns suggest the prior trend will resume (price continues in the same direction after the break), while reversal patterns signal a turn. The key is the breakout direction and the current stage of the trend.
Q2. Does a trend always continue after a continuation pattern breaks?
Not always. Continuation patterns offer higher-probability continuation signals, but false breaks happen. Wait for a valid breakout on rising volume and a retest, and manage risk with stops.
Q3. Which continuation pattern is the most reliable?
None is reliable in absolute terms. Triangles and boxes with clear boundaries are easier to identify, while flags tend to appear as brief consolidations after sharp moves; reliability still depends on volume and trend context.
7. Summary of Continuation Patterns
In technical analysis, recognizing and understanding different continuation patterns is crucial for predicting price movements.
Wedge, Flag, Triangle, and Box patterns are some of the most common and informative chart patterns.
The following table provides a summary of the core features of these four patterns, what market behavior they typically indicate, and the expected breakout direction to assist traders in making decisions:
| Pattern | Features | Expected Outcome | Breakout Direction |
|---|---|---|---|
| Wedge | Price converges between two trendlines, forming a wedge shape | Reversal or Continuation | Rising Wedge down, Falling Wedge up |
| Triangle | Price fluctuates within converging trendlines, forming a triangle | Reversal or Continuation | Depends on the pattern |
| Flag | Small, parallel price consolidation after a strong trend | Continuation | Opposite direction of the flagpole |
| Box | Price moves within a range between resistance and support levels | Continuation or Reversal | Upwards or Downward breakout |
Further Reading
- Triangle Patterns Explained
- Wedge Patterns Explained
- What Are Reversal Patterns?
- What Is a Candlestick Chart?
The financial markets research team at Titan FX. We produce educational content across a broad range of instruments, including forex (FX), commodities (crude oil, precious metals, agricultural products), equity indices, U.S. stocks, and crypto assets.
Primary Sources (by Category)
- Technical analysis references: Edwards & Magee — Technical Analysis of Stock Trends; Thomas N. Bulkowski — Encyclopedia of Chart Patterns; Investopedia — continuation pattern / wedge / triangle / flag definitions
- Trading practice: Titan FX — continuation-pattern and technical-analysis education; TradingView — Chart Patterns