Ichimoku Kinko Hyo:Principles, Setup, and Trading Strategies
By plotting five lines and a "cloud" on a chart, you can read trend direction, support and resistance, and entry/exit timing all at a glance — that is Ichimoku Kinko Hyo, a technical indicator born in Japan. Known worldwide simply as "Ichimoku," it is used by traders across the globe.
This article provides a detailed introduction to the basics of Ichimoku Kinko Hyo, how to interpret it, its usage, and how to configure it.
- Five lines: Conversion, Base, Leading Span A/B, and Lagging Span
- The cloud (Kumo): The band between Leading Spans A and B; a support/resistance guide
- Three theories: Analyzing the market via price, time, and wave
- Key signals: Three-role bull/bear cross, cloud breakouts, lagging-span crosses
- Parameters: Standard 9/26/52; built into MT4/MT5
- 1. What Is Ichimoku Kinko Hyo?
- 2. How to Interpret Ichimoku Kinko Hyo
- 3. Three Key Theories of the Ichimoku Kinko Hyo
- 4. How to Use the Ichimoku Kinko Hyo
- 5. How to Set Up Ichimoku Kinko Hyo in MT4/MT5
- 6. Custom Ichimoku Indicators Provided by Titan FX
- 7. Important Notes When Using Ichimoku Kinko Hyo
- 8. Frequently Asked Questions About Ichimoku Kinko Hyo
- 9. Conclusion
1. What Is Ichimoku Kinko Hyo?
Ichimoku Kinko Hyo, also known as the Ichimoku Cloud, is a technical indicator originating from Japan. Initially developed for stock price analysis, it is now widely used in forex, commodities, and other financial markets.
Internationally, it is commonly referred to as "Ichimoku", and it is widely utilized by investors around the world.
The Creator of Ichimoku Kinko Hyo
Ichimoku Kinko Hyo was invented by Japanese stock market analyst Goichi Hosoda.
Hosoda was born in 1898 and served as the head of the commercial affairs department at Tokyo Shimbun (formerly Miyako Shimbun). After World War II, he published articles under the pen name Ichimoku Sanjin in financial newspapers.
In 1969, he published the first volume of Ichimoku Kinko Hyo, officially introducing the indicator to the public. The development of Ichimoku Kinko Hyo took seven years and involved the efforts of approximately 2,000 people.
Basic Concept of Ichimoku Kinko Hyo
The core concept of Ichimoku Kinko Hyo is:
When the balance between buyers and sellers is disrupted, the market tends to experience significant price movements.
Unlike many technical indicators that focus solely on price changes, Ichimoku Kinko Hyo emphasizes when the market will move and when price targets are likely to be reached.
Observing price charts, you will notice that once market equilibrium is broken, the trend often continues in that direction for some time. Ichimoku Kinko Hyo provides a visual representation of the balance between buyers and sellers.
2. How to Interpret Ichimoku Kinko Hyo
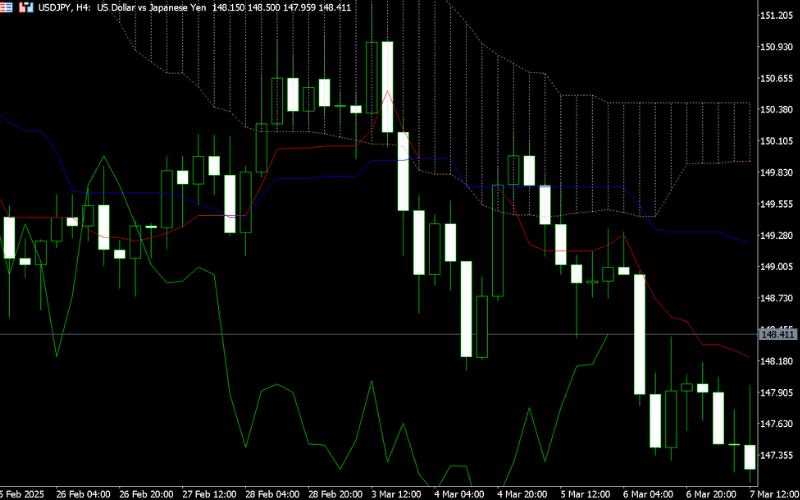
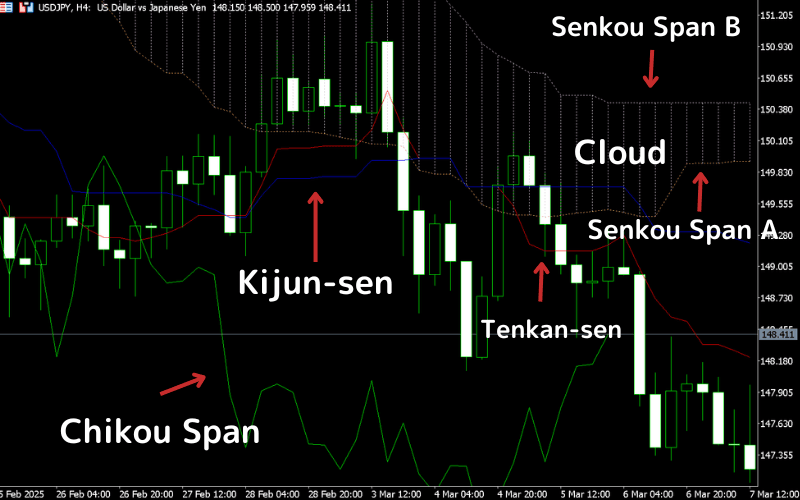
Ichimoku Kinko Hyo consists of five key components:
"Kijun-sen" (Base Line), "Tenkan-sen" (Conversion Line), "Senkou Span A" (Leading Span A), "Senkou Span B" (Leading Span B), and "Chikou Span" (Lagging Line).
The area between Senkou Span A and Senkou Span B is called the "Cloud" (Kumo), which serves as a key support and resistance zone in the market.
Except for the Lagging Line, all other lines are calculated using the midpoint of the highest and lowest prices over a specified period.
Kijun-sen (Base Line)
The Kijun-sen represents the medium-term trend and is calculated as the midpoint of the highest and lowest prices over the past 26 periods.
Interpretation:
- Kijun-sen rising → Indicates an upward trend.
- Kijun-sen declining → Indicates a downward trend.
Formula:
Kijun-sen = (26-period highest price + 26-period lowest price) ÷ 2
For example, if the highest price over the past 26 periods is 200, and the lowest price is 180, then:
(200 + 180) ÷ 2 = 190
Tenkan-sen (Conversion Line)
The Tenkan-sen is similar to the Kijun-sen but is calculated over a shorter period (9 periods). It reacts more quickly to price changes and is used for short-term trend analysis.
Interpretation:
- Tenkan-sen rising → Indicates a higher probability of short-term price increases.
- Tenkan-sen declining → Indicates a higher probability of short-term price declines.
- Tenkan-sen crossing above Kijun-sen → Possible buy signal.
- Tenkan-sen crossing below Kijun-sen → Possible sell signal.
Formula:
Tenkan-sen = (9-period highest price + 9-period lowest price) ÷ 2
For example, if the highest price over the past 9 periods is 200, and the lowest price is 180, then:
(200 + 180) ÷ 2 = 190
Senkou Span A (Leading Span A)
Senkou Span A is the midpoint of Kijun-sen and Tenkan-sen, projected 26 periods into the future.
Interpretation:
- Senkou Span A rising → Suggests an uptrend in the market.
- Senkou Span A declining → Suggests a downtrend in the market.
Formula:
Senkou Span A = (Tenkan-sen + Kijun-sen) ÷ 2, shifted forward by 26 periods
Senkou Span B (Leading Span B)
Senkou Span B is the midpoint of the highest and lowest prices over the past 52 periods, projected 26 periods into the future.
Interpretation:
- Senkou Span B changes slowly and acts as a long-term support or resistance level.
- The relative position of Senkou Span A and B forms the Cloud, helping determine trend strength.
Formula:
Senkou Span B = (52-period highest price + 52-period lowest price) ÷ 2, shifted forward by 26 periods
Chikou Span (Lagging Line)
The Chikou Span represents the closing price shifted backward by 26 periods, allowing comparison of the current price with past price movements.
Interpretation:
- Chikou Span above price 26 periods ago → Bullish trend.
- Chikou Span below price 26 periods ago → Bearish trend.
Formula:
Chikou Span = Current closing price, shifted backward by 26 periods
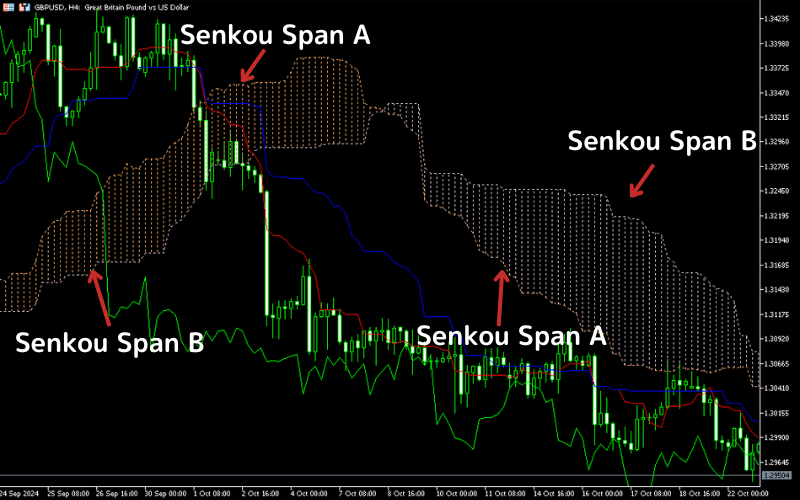
The Cloud (Kumo) and Trend Analysis
The Cloud (Kumo) is the area between Senkou Span A and Senkou Span B. Its thickness and color help assess market trends.
In MT5, the default Cloud colors are:
- Brown when Senkou Span A is above Senkou Span B.
- Purple when Senkou Span B is above Senkou Span A.
Trend Analysis Table
The market trend can be assessed based on the Cloud’s position relative to price:
| Condition | Relationship | Market Trend |
|---|---|---|
| Trend Strength | ① Price above Cloud | Strong uptrend |
| ② Price below Cloud | Strong downtrend | |
| Support/Resistance | ③ Cloud above price | Resistance zone |
| ④ Cloud below price | Support zone | |
| Breakout Signals | ⑤ Price breaks above Cloud | Bullish signal |
| ⑥ Price breaks below Cloud | Bearish signal | |
| Trend Reversal | ⑦ Cloud twist (Senkou Spans cross) | Possible trend reversal |
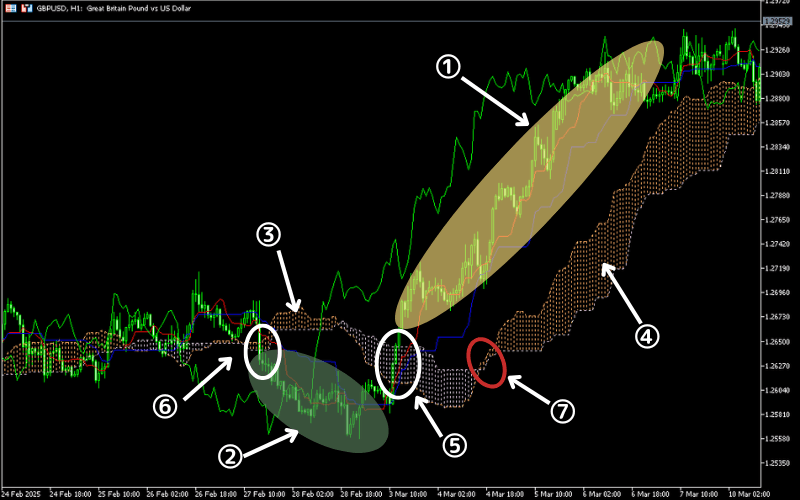
Since the Cloud is a zone rather than a single line, breaking through it takes time—the thicker the Cloud, the longer it takes to confirm a trend shift.
3. Three Key Theories of the Ichimoku Kinko Hyo
The Ichimoku Kinko Hyo is built on three key theories: Time Theory, Wave Theory, and Price Projection Theory. Below is a detailed explanation of each theory.
Time Theory
Time Theory analyzes market turning points from a time perspective.
In the Ichimoku Kinko Hyo, the numbers 9, 17, and 26 are considered fundamental values. These periods are seen as key time points where market reversals are likely to occur. These values are also used to calculate the Conversion Line and Base Line, highlighting their importance.
Additionally, there are compound values such as 33, 42, 52, 65, and 76, which are used for more detailed time analysis.
Wave Theory
Wave Theory analyzes market direction based on price patterns. The basic wave patterns include I-wave, V-wave, and N-wave.
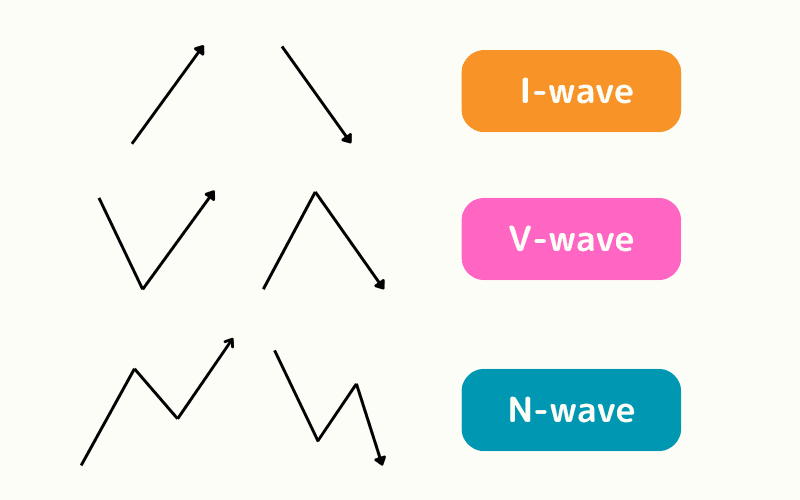
- I-wave: A simple upward or downward movement.
- V-wave: A downward movement followed by an upward movement, or vice versa.
- N-wave: An upward → downward → upward movement, or a downward → upward → downward movement.
I-waves and V-waves frequently appear and eventually form N-waves. N-waves are the most important pattern in market analysis, and traders should pay close attention to them when analyzing market trends.
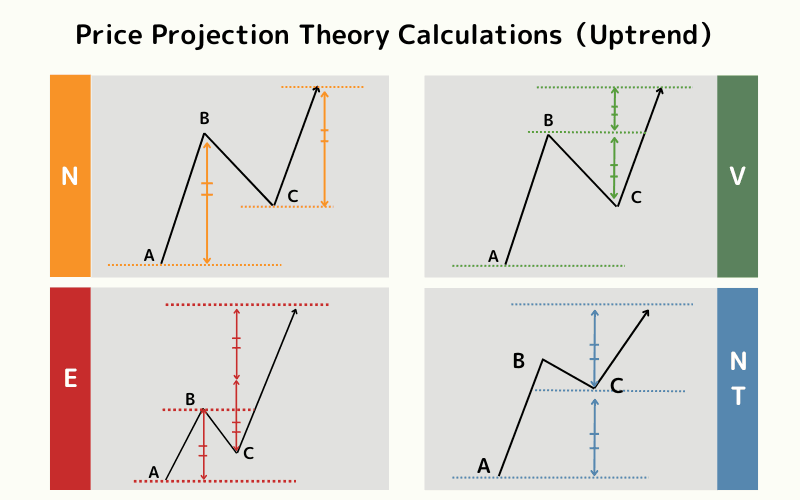
Price Projection Theory
Price Projection Theory analyzes target price levels based on market fluctuations. It is also known as the "Value Range Observation Theory."
There are four representative calculation methods under Price Projection Theory: N Calculation, E Calculation, V Calculation, and NT Calculation. These methods can help predict target price levels during an uptrend or downtrend.
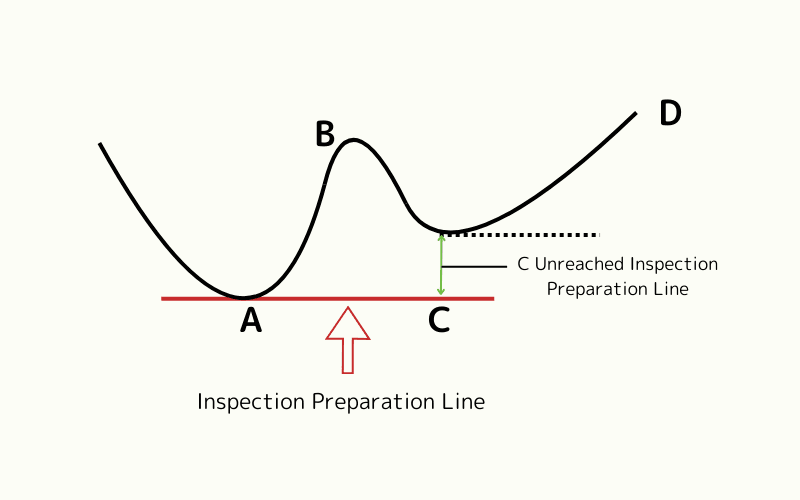
Price Projection Theory Calculations
In an uptrend, after a price pullback, the price may resume moving higher. The table below shows the predicted target prices based on the retracement point C:
| Method | Description | Formula |
|---|---|---|
| N Calculation | The price movement equals the price range of AB, starting from the retracement point C | Target Price = C + (B − A) |
| E Calculation | The price movement equals twice the price range of AB, starting from the retracement point C | Target Price = B + (B − A) |
| V Calculation | The price movement equals twice the price range of BC, starting from the retracement point C | Target Price = B + (B − C) |
| NT Calculation | The price movement equals the price range of AC, starting from the retracement point C | Target Price = C + (C − A) |
Additional Notes
- The table applies to an uptrend. If the price retraces and then continues to rise, these calculations can help estimate the target price level.
- In a downtrend, the "retracement point C" should be replaced with the "rebound point C". The calculation method remains the same but applies to the scenario where the price rises and then resumes a downtrend.
4. How to Use the Ichimoku Kinko Hyo
The Ichimoku Kinko Hyo offers a unique way to analyze the market. Unlike other technical indicators, it considers not only price movement but also time and market structure to identify trends. Here are the basic methods for using it:
Based on Daily Charts
The standard application of the Ichimoku Kinko Hyo is based on daily charts.
The developer of this indicator primarily tested and analyzed it using daily charts, which is why the key values 9, 17, and 26 are designed for daily time frames.
However, traders can also apply it to shorter time frames such as 5 minutes, 15 minutes, or 1 hour, as well as longer time frames like weekly or monthly charts. However, the sensitivity and effectiveness of the indicator may vary depending on the time frame.
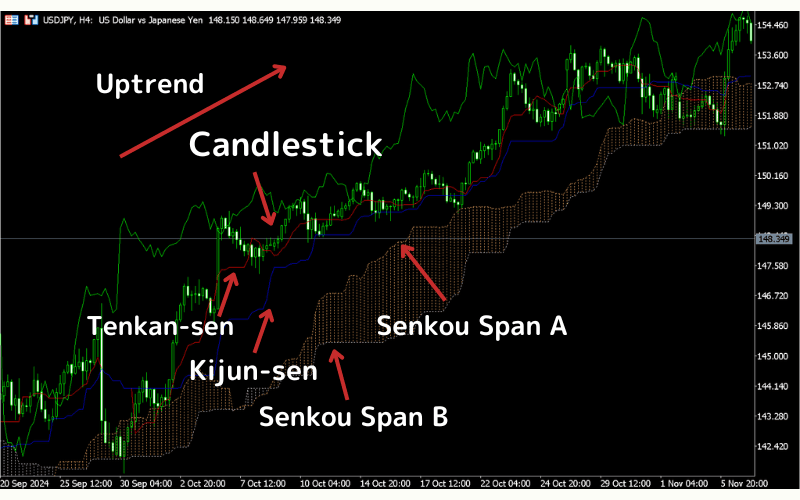
Relationship Between Candlestick and Indicator Lines
The market trend strength can be determined by the relationship between candlesticks and the five lines of the Ichimoku Kinko Hyo.
- Uptrend (Bullish Structure): When the candlestick is at the top, and the order is Conversion Line > Base Line > Leading Span A > Leading Span B, it indicates a strong market structure.
- Downtrend (Bearish Structure): The opposite order suggests a weak market.
- Sideways Market: If the candlestick and the lines are entangled and unclear, it indicates market consolidation or a lack of clear direction.
Reference for Pullbacks and Rebounds
Once a market trend is established, the Conversion Line, Base Line, Leading Span A, and Leading Span B can serve as support and resistance levels to help identify pullback or rebound points.
- In an uptrend: If the candlestick drops below the Conversion Line, the Base Line, Leading Span A, and Leading Span B may provide support.
- In a downtrend: If the candlestick rises above the Conversion Line, the Base Line, Leading Span A, and Leading Span B may provide resistance.
These support and resistance levels help traders decide whether to increase or decrease positions or set stop-loss orders.
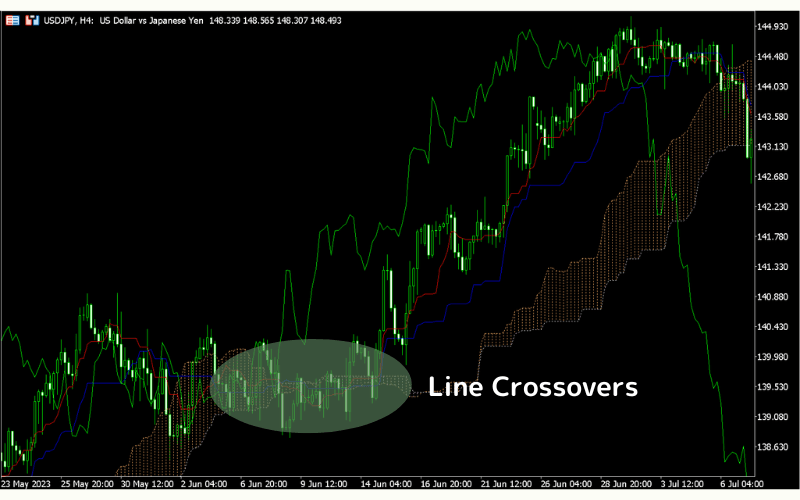
Line Crossovers Indicating Trend Reversal or Stagnation
When a trend stagnates or reverses, crossovers between the lines may occur.
This suggests that the market may enter a consolidation phase or trend reversal. By observing the relationship between the lines, traders can determine whether the market is trending.
Cloud Breakout Indicates Trend Reversal
The "cloud" formed by the Leading Span A and Leading Span B acts as a support or resistance zone.
- If the cloud is above the candlestick, it acts as an upper resistance zone.
- If the cloud is below the candlestick, it acts as a lower support zone.
If the candlestick breaks through the cloud, it may signal a trend reversal.
The thickness of the cloud also affects the difficulty of the breakout—a thicker cloud requires more time to break through.
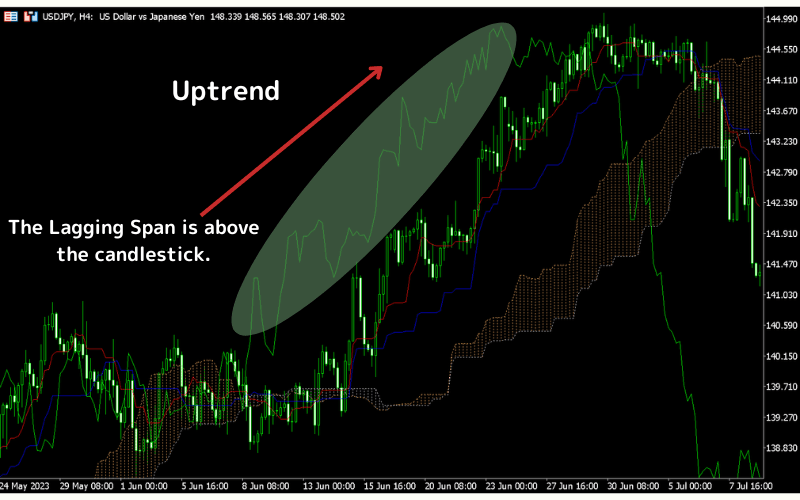
Importance of the Lagging Span
The Lagging Span is one of the most important lines.
- If the Lagging Span is above the candlestick, it indicates an uptrend.
- If the Lagging Span is below the candlestick, it indicates a downtrend.
A Lagging Span crossing above the candlestick is a buy signal, while crossing below the candlestick is a sell signal.
Pattern Formation Before Trend Reversal
A pattern formation signals a shift from a long-term downtrend to an uptrend.
This occurs when the price rises from a bottom, pulls back without breaking the previous low, forms a double bottom, and then starts to rise again.
Besides the Double Bottom, other patterns like the Inverse Head and Shoulders are also common.
When these patterns appear and 26 periods have passed, it is usually considered a completed reversal formation.
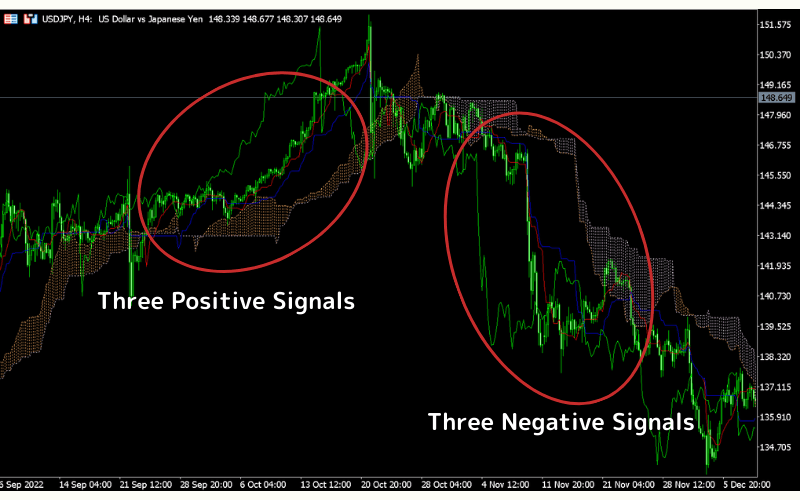
Three Positive and Negative Signals
There are two classic market states in the Ichimoku Kinko Hyo:
Three Positive Signals (Buy Signal)
When the following three conditions are met simultaneously, it indicates a strong market and a buy signal:
- Conversion Line crosses above the Base Line (indicating short-term upward trend)
- Lagging Span is above the candlestick (indicating strong momentum)
- Candlestick breaks above the cloud (indicating a bullish market)
Three Negative Signals (Sell Signal)
When the following three conditions are met simultaneously, it indicates a weak market and a sell signal:
- Conversion Line crosses below the Base Line (indicating short-term downward trend)
- Lagging Span is below the candlestick (indicating weak momentum)
- Candlestick breaks below the cloud (indicating a bearish market)
These are the strongest trend confirmation signals in the Ichimoku Kinko Hyo, often leading to a clear market direction.
5. How to Set Up Ichimoku Kinko Hyo in MT4/MT5
Below are the steps to set up the Ichimoku Kinko Hyo indicator in MT4 and MT5.
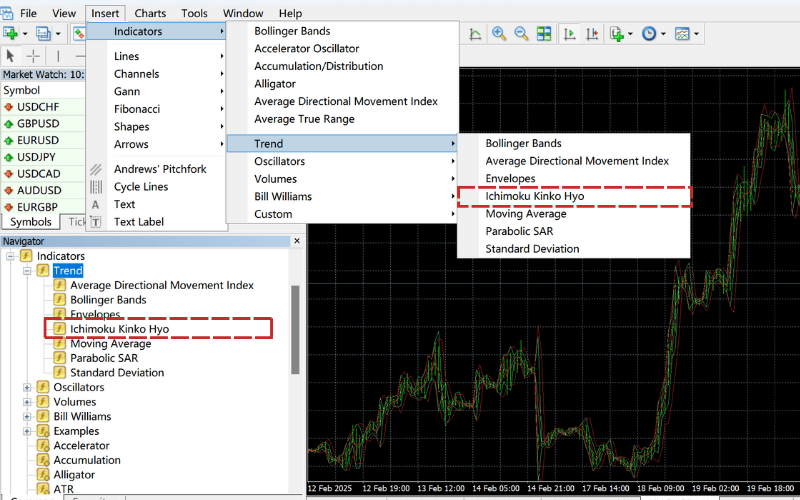
How to Set Up Ichimoku Kinko Hyo in MT4
① Log in to MT4
② Open the chart of the trading instrument
③ Select "Insert" → "Indicators" → "Trend" → "Ichimoku Kinko Hyo" from the menu bar, or select "Indicators" → "Trend" → "Ichimoku Kinko Hyo" from the Navigator bar.
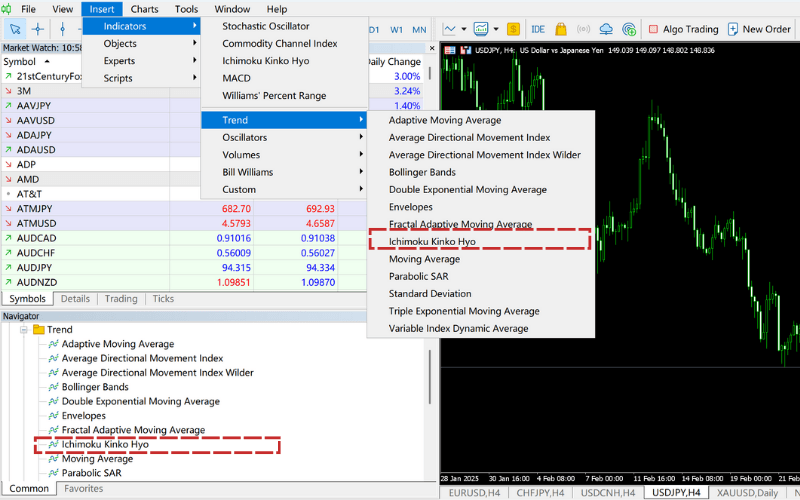
How to Set Up Ichimoku Kinko Hyo in MT5
① Log in to MT5
② Open the chart of the trading instrument
③ Select "Insert" → "Indicators" → "Trend" → "Ichimoku Kinko Hyo" from the menu bar, or select "Indicators" → "Trend" → "Ichimoku Kinko Hyo" from the Navigator bar.
6. Custom Ichimoku Indicators Provided by Titan FX
Titan FX offers several custom Ichimoku Kinko Hyo indicators to correct errors in the default MT4/MT5 indicators and provide more intuitive market analysis tools.
Titan_Ichimoku (Corrects MT4/MT5 Display Errors)
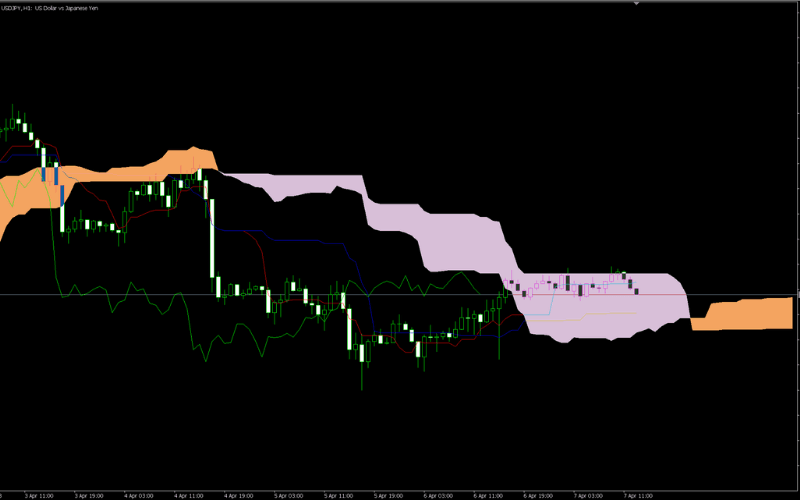
The default Ichimoku Kinko Hyo indicator in MT4/MT5 calculates the leading span and cloud position from the next candlestick instead of the current one, causing a one-candle shift in the display.
Titan_Ichimoku corrects this error, ensuring that the indicator display matches the original Ichimoku Kinko Hyo.
Titan FX Ichimoku Kinko Hyo Indicator (Titan_Ichimoku)
Titan_Ichimoku_Alert (Displays Ichimoku Status in a Subchart)
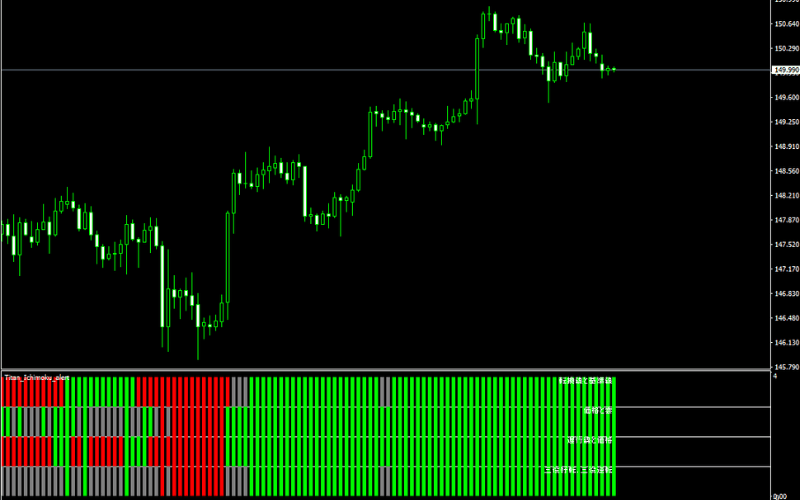
This indicator shows the Ichimoku Kinko Hyo market status in a subchart, helping traders visualize trends and trading signals more clearly.
Key Features:
- Tracks the conversion line and base line to confirm trend direction
- Monitors the relationship between closing price and cloud to identify support and resistance
- Analyzes the lagging span and past prices to confirm trend validity
- Provides signals for Three Line Cross (bullish/bearish reversal) to identify market turning points
Ichimoku Alert Indicator (Titan_ichimoku_alert)
7. Important Notes When Using Ichimoku Kinko Hyo
Be Cautious When the Price is Within or Near the Cloud
When the price is within the Ichimoku cloud or the cloud is twisted, the market often becomes range-bound without a clear direction.
This is particularly common on shorter timeframes such as 5-minute and 15-minute charts. Short-term traders should exercise caution in these situations.
Ichimoku Kinko Hyo is Not Perfectly Accurate
No technical indicator is completely accurate, and Ichimoku Kinko Hyo is no exception. False signals can occur.
To improve accuracy, it’s recommended to combine Ichimoku Kinko Hyo with other technical indicators or fundamental analysis.
However, even with these combinations, false signals cannot be completely avoided. It's important to understand that no chart analysis is 100% accurate.
8. Frequently Asked Questions About Ichimoku Kinko Hyo
Q1. How Should Ichimoku Kinko Hyo Parameters Be Adjusted?
The default Ichimoku Kinko Hyo settings of 9, 26, 52 are widely used and generally do not need adjustment.
These values are based on historical market cycles and tend to reflect market support and resistance effectively.
Q2. Which Technical Indicators Work Well with Ichimoku Kinko Hyo?
- Trend Following: Combine with MACD or RSI
- Counter-Trend Trading: Combine with RCI or Stochastic Oscillator
If you miss the "Three Line Cross" signal on the Ichimoku chart, you can combine MACD and RSI for better trend-following confirmation.
Since Ichimoku Kinko Hyo alone may not provide clear entry signals, using MACD and RSI can help identify optimal entry points.
On the other hand, for counter-trend trading, Ichimoku Kinko Hyo may not always give clear signals.
In such cases, combining it with oscillating indicators like RCI or Stochastic Oscillator, which are more effective in range-bound markets, can be useful.
Q3. Is Ichimoku Kinko Hyo Ineffective?
Ichimoku Kinko Hyo is a widely used technical indicator, not only in forex trading but also in stock trading and other financial markets.
However, any single technical indicator has limited accuracy when used alone.
To improve accuracy, it’s recommended to combine Ichimoku Kinko Hyo with other technical indicators.
9. Conclusion
Ichimoku Kinko Hyo is a unique technical indicator that visually represents the balance between buyers and sellers at a glance.
It consists of five lines: conversion line, base line, leading span A, leading span B, and lagging span. The area between leading span A and leading span B forms the cloud.
During an uptrend, the order of the lines is as follows:
Candlestick > Conversion Line > Base Line > Leading Span A (upper) > Leading Span B (lower)
Both the lines and the cloud provide valuable signals for pullbacks and rebounds.
Ichimoku Kinko Hyo analyzes market trends by combining time, price, and volatility. Understanding how to use it can help traders make more informed decisions and develop more effective trading strategies.
Further Reading
Titan FX Trade Strategy Research Lab covers forex (FX), commodities (oil, precious metals, agricultural products), stock indices, U.S. equities, and crypto assets — producing educational content for retail investors across asset classes.
Primary Sources (by Category)
- Foundational works: Goichi Hosoda, Ichimoku Kinko Hyo (original theory)
- Platform: MetaQuotes — MT4 / MT5