Philadelphia Semiconductor Index (SOX): The Complete Guide to Components, ETFs, and Trading Strategies
The Philadelphia Semiconductor Index (SOX) tracks 30 of the largest U.S.-listed semiconductor companies and is widely regarded as the single best barometer of the global chip cycle. After climbing above 5,900 in July 2024 and pushing to fresh record highs at 9,556.42 on April 17, 2026, the index has become a focal point for investors positioning around the AI build-out, data-center CapEx, and the cyclical swings that have always defined this industry.
This guide breaks down the index's methodology, its 30 constituents and top-10 weights, the ETFs and derivatives available to investors, how SOX compares with the Nasdaq-100 and S&P 500 Information Technology sector, and practical trading strategies for capturing upside while managing the sector's notorious volatility. For U.S. equity-index traders, see our companion page on the S&P 500 (US500) index product.
- The SOX Index tracks 30 top U.S.-listed chip stocks — a leading gauge of global semiconductor demand
- Modified cap-weighting concentrates weight in NVDA, AVGO and AMD, amplifying volatility
- Long-run returns run ~2x the broad market, with ~1.3–1.5x the volatility of the NDX
- Invest via U.S. ETFs (SMH/SOXX/SOXQ), CFDs, futures, options or dollar-cost averaging
- Three core strategies: trend-following, cycle mean-reversion and event-driven — with strict risk control
- 1. Why the Philadelphia Semiconductor Index Matters
- 2. What Is the SOX Index?
- 3. Key Factors That Drive the SOX Index
- 4. Historical Performance and Cyclical Characteristics
- 5. SOX vs Other Major Indices
- 6. How to Invest in the SOX Index
- 7. Trading Strategies for the SOX Index
- 8. Frequently Asked Questions
- 9. Key Takeaways
1. Why the Philadelphia Semiconductor Index Matters
Semiconductors are the building blocks of artificial intelligence, 5G, electric vehicles, cloud computing, and the Internet of Things. From the processor in a smartphone to the GPUs powering hyperscale data centers, chips play the same role in the modern economy that oil played in the industrial age. The industry is also famously cyclical and R&D-intensive: demand surges when AI and cloud CapEx accelerate, and corrections can be sharp when inventories overshoot.
The Philadelphia Semiconductor Index (SOX) was launched by the Philadelphia Stock Exchange (PHLX) in 1993 and is now maintained by Nasdaq. According to SIA data, global semiconductor sales reached roughly $627 billion in 2024 and are projected to approach $697 billion in 2025, with the industry widely expected to cross the $1 trillion revenue mark before 2030. Against that backdrop, the SOX has become a go-to proxy for whether the AI-driven chip super-cycle is still expanding.
When SOX rallies, it typically signals strong chip demand, rising earnings expectations, and capital rotating into growth sectors. When it breaks down, it often leads weakness across the broader tech complex. For anyone invested in AI, advanced manufacturing, or high-performance computing, SOX is effectively the dashboard light that flashes before the rest of tech reacts.
2. What Is the SOX Index?
The Philadelphia Semiconductor Index (SOX) is a modified market-capitalization-weighted index of 30 U.S.-listed semiconductor companies spanning design, manufacturing, equipment, and materials. It was created in 1993 and is now maintained by Nasdaq, which sets methodology, reviews constituents annually, and rebalances weights every quarter.
The index was initiated at a value of 200 on December 1, 1993, split 2-for-1 on July 24, 1995, and has options and futures products built around it. Eligible securities must be listed on a major U.S. exchange (Nasdaq, NYSE, NYSE American, or Cboe), have a market cap of at least $100 million on the reference date, and demonstrate liquidity of at least 1.5 million shares traded per month across the prior six months.
2.1 Index Methodology and Weighting
SOX is not a pure cap-weighted index. It applies a tiered capping mechanism to prevent a handful of mega-caps from dominating the index:
- The three largest constituents are capped at 12%, 10%, and 8% respectively
- All other constituents are capped at 4% each
- Excess weight is redistributed proportionally to lower-weighted names
Nasdaq performs an annual reconstitution in September (reviewing the 30 constituents) and quarterly rebalances every March, June, September, and December to maintain the weighting structure as market caps move.
This capping rule is important because ETFs that track SOX (notably Invesco's SOXQ) inherit the exact same tiering, while some competing ETFs (like iShares' SOXX, which tracks the ICE Semiconductor Index) apply a flatter 8%/4% cap. The difference shows up in how much exposure each fund gives to the very largest names like NVIDIA and Broadcom.
2.2 The 30 Constituent Companies
As of the most recent rebalance, the SOX universe spans the full value chain from design (NVIDIA, AMD, ARM) to foundry (TSM, GlobalFoundries, Intel) to equipment (ASML, AMAT, LRCX, KLAC, TER) to analog and connectivity (Texas Instruments, Analog Devices, Qualcomm, Broadcom, Skyworks).
| Ticker | Company | Sub-industry |
|---|---|---|
| ADI | Analog Devices, Inc. | Analog / mixed-signal |
| AMAT | Applied Materials, Inc. | Equipment |
| AMD | Advanced Micro Devices, Inc. | CPU / GPU |
| AMKR | Amkor Technology, Inc. | Packaging / test |
| ARM | Arm Holdings plc | IP / architecture |
| ASML | ASML Holding N.V. | Lithography equipment |
| AVGO | Broadcom Inc. | Networking / custom ASIC |
| COHR | Coherent Corp. | Photonics / materials |
| CRUS | Cirrus Logic, Inc. | Audio / mixed-signal |
| ENTG | Entegris, Inc. | Materials |
| GFS | GlobalFoundries Inc. | Foundry |
| INTC | Intel Corporation | IDM / foundry |
| KLAC | KLA Corporation | Process control |
| LRCX | Lam Research Corporation | Etch / deposition |
| LSCC | Lattice Semiconductor Corporation | FPGA |
| MCHP | Microchip Technology Incorporated | Microcontrollers |
| MPWR | Monolithic Power Systems, Inc. | Power management |
| MRVL | Marvell Technology, Inc. | Networking / custom silicon |
| MTSI | MACOM Technology Solutions Holdings, Inc. | RF / optical |
| MU | Micron Technology, Inc. | DRAM / NAND |
| NVDA | NVIDIA Corporation | GPU / AI accelerator |
| NXPI | NXP Semiconductors N.V. | Auto / industrial |
| ON | ON Semiconductor Corporation | Power / auto |
| ONTO | Onto Innovation Inc. | Metrology |
| QCOM | Qualcomm Incorporated | Mobile / 5G baseband |
| QRVO | Qorvo, Inc. | RF front-end |
| SWKS | Skyworks Solutions, Inc. | RF front-end |
| TER | Teradyne, Inc. | Test equipment |
| TSM | Taiwan Semiconductor Manufacturing Co., Ltd. | Leading-edge foundry |
| TXN | Texas Instruments Incorporated | Analog / embedded |
Note that SOX is a U.S.-listed index, not a U.S.-company index. Non-U.S. firms such as ASML (Netherlands) and TSMC (Taiwan ADR) qualify as long as they meet the listing and liquidity thresholds.
2.3 Top 10 Weightings and What They Tell You
Because of the 12/10/8/4% tiered cap, SOX is more concentrated at the top than a flat cap-weighted fund. The top three names together drive roughly 28-30% of the index, and the top 10 typically account for more than 60% of the total weight.
| Rank | Ticker | Company | Approx. Weight | Role in the Index |
|---|---|---|---|---|
| 1 | NVDA | NVIDIA | ~11.3% | AI GPUs, data-center accelerators |
| 2 | AVGO | Broadcom | ~9.8% | Networking silicon, custom AI ASICs |
| 3 | AMD | Advanced Micro Devices | ~7.0% | CPUs, server GPUs |
| 4 | TSM | Taiwan Semiconductor (ADR) | ~4.3% | Leading-edge foundry |
| 5 | QCOM | Qualcomm | ~4.0% | Mobile SoCs, 5G baseband |
| 6 | TXN | Texas Instruments | ~4.0% | Analog ICs, embedded processing |
| 7 | AMAT | Applied Materials | ~4.0% | Process equipment |
| 8 | LRCX | Lam Research | ~4.0% | Etch and deposition equipment |
| 9 | INTC | Intel | ~4.0% | x86 CPUs, foundry business |
| 10 | MU | Micron | ~4.0% | DRAM and NAND memory |
Weights are approximate and change with every quarterly rebalance and intra-quarter market movements.
The takeaway for active traders: during AI-driven tape, NVDA and AVGO often explain more than half of any given day's SOX move. Monitoring their earnings calendars, product launches (Blackwell, Rubin, MI300 series), and hyperscaler order commentary is more informative than tracking a simple 30-stock average.
2.4 Industry Representation and Market Significance
SOX is regarded as the leading indicator for the global chip cycle. Its turns often precede moves in the broader S&P 500 Information Technology sector and the Nasdaq-100 by one to two quarters. When hyperscaler CapEx guidance is revised higher, SOX typically responds first; when memory prices roll over or foundry utilization slips, the index also tends to lead tech downside. That makes the SOX a key dashboard for portfolio managers, sector specialists, and macro strategists tracking capital-expenditure momentum across U.S. technology.
3. Key Factors That Drive the SOX Index
SOX is driven by the interplay of five major forces: technology innovation, global supply-chain and geopolitical conditions, Federal Reserve policy, capital flows and sentiment, and structural drivers such as AI CapEx and the CHIPS Act subsidy regimes.
| Driver | Typical Impact on SOX |
|---|---|
| Technology innovation and R&D | Successful node transitions and new AI architectures lift multiples |
| Global supply chain and geopolitics | Export controls and regional shocks drive volatility and short-term corrections |
| Fed policy and macro environment | Rate cuts and recovery are supportive; hikes and recession compress multiples |
| Capital flows and sentiment | ETF inflows and risk-on positioning fuel rallies; de-risking triggers sharp selloffs |
| AI CapEx and CHIPS Act subsidies | Hyperscaler spending and fab subsidies support multi-year bullish structural tailwind |
3.1 Technology Innovation and R&D Investment
Chip competitiveness is defined by process-node leadership (7nm to 5nm to 3nm to 2nm and 1.4nm roadmaps), advanced packaging (CoWoS, FOPLP), and new architectures for AI workloads (GPUs, TPUs, custom ASICs, HBM memory). SIA data shows that semiconductor firms typically spend more than 15% of revenue on R&D, well above most manufacturing sectors. When node transitions succeed, margins expand and SOX earnings multiples expand with them. When ramps delay or yields disappoint, the index quickly re-rates lower.
3.2 Global Supply Chain and Geopolitics
Semiconductor supply chains are among the most globalized and politically sensitive in the world. The U.S., Taiwan, South Korea, Japan, the Netherlands, and China each hold irreplaceable positions in design, manufacturing, packaging, or equipment. Any geopolitical friction (U.S.-China export controls, Taiwan-related risks, Dutch lithography restrictions) can disrupt production and drive sharp index moves. The 2020-2022 pandemic squeeze and subsequent 2023 inventory flush are textbook examples of how quickly the sector can whipsaw.
3.3 Federal Reserve Policy and the Macro Environment
Semiconductors are a classic long-duration growth sector, so their valuations are highly sensitive to real interest rates. When the Federal Reserve (Fed) hikes, discount rates rise and future cash flows are penalized, compressing high-multiple chip stocks. When the Fed pivots dovish, capital returns to growth and SOX typically leads the rally. Secondary macro indicators such as inflation, the ISM Manufacturing PMI, and global capital-goods orders also shape how investors handicap the next demand cycle.
3.4 Capital Flows and Market Sentiment
Sentiment and positioning matter at least as much as fundamentals for short-term SOX moves. When AI, HPC, or chip-shortage narratives dominate the headlines, semiconductor ETFs (SOXX, SMH, SOXQ) attract heavy inflows that push the index higher. When risk-off regimes kick in, the same ETFs bleed assets quickly. Tracking ETF fund flows, short interest, and the VIX alongside SOX-specific implied volatility gives a practical read on whether sentiment is stretched.
3.5 AI CapEx, Data-Center Demand, and the CHIPS Act Regime
Since 2023, the AI wave has been the single most important driver of the SOX bull market. Hyperscaler CapEx from Microsoft, Google, Amazon, and Meta has repeatedly hit new annual records, with a rising share allocated to AI servers, GPUs, networking silicon, and custom ASICs. That demand flows directly to NVIDIA, Broadcom, AMD, Micron, and the ASML/AMAT/LRCX equipment complex.
At the same time, governments are reshaping where chips are made through multi-hundred-billion-dollar subsidy programs:
- U.S. CHIPS and Science Act: Roughly $280 billion in authorized funding, including about $39 billion in direct manufacturing subsidies and a 25% investment tax credit. As of December 2025, SIA reports more than $630 billion of cumulative announced investment across 140 projects and 28 states.
- European Chips Act: Targets doubling the EU's share of global semiconductor capacity to 20% by 2030. By October 2025, it had catalyzed about EUR 80 billion in confirmed projects, roughly twice the EUR 43 billion initially mobilized.
- China's National IC Fund ("Big Fund"): Multiple phases of state and provincial capital have pushed cumulative Chinese semiconductor subsidy support into the hundreds of billions of U.S. dollars, concentrated in domestic foundry, memory, and equipment firms.
These programs reshape the long-term CapEx cycle and provide structural order visibility for the equipment group (AMAT, LRCX, KLAC) and leading-edge foundries (TSM, GlobalFoundries, Intel Foundry). For long-term SOX investors, understanding which regions are funding what fab is now as important as tracking NVIDIA's next product launch.
4. Historical Performance and Cyclical Characteristics
Since its 1993 launch, SOX has delivered some of the highest long-term returns of any U.S. sector index, but with sharply higher volatility. Every major technology wave, from the PC era to the smartphone era to the current AI super-cycle, has left a distinct mark on the chart.
4.1 High Volatility Tracking the Technology Cycle
SOX has historically delivered growth stock-like returns with growth stock-like drawdowns. When new applications ignite demand (PCs, mobile internet, cloud, AI), the index tends to run in multi-year rallies. When inventories overbuild or capital flows reverse, drawdowns of 30-60% are not unusual. Industry analysts identify a roughly 3-4 year semiconductor cycle, driven by the lag between fab investment decisions and actual production capacity.
4.2 Historical Turning Points
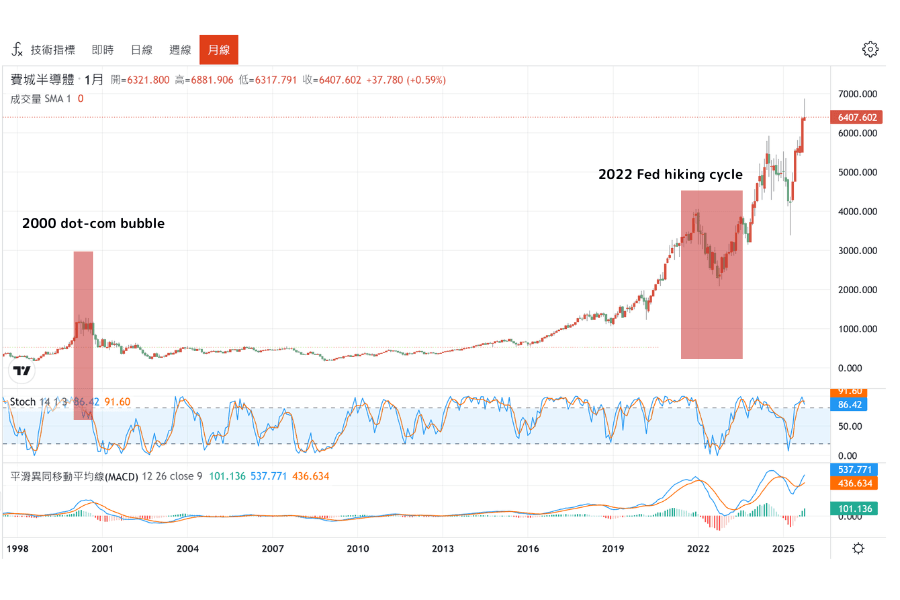
- 2000 dot-com bubble: SOX surged more than 400% into the 2000 peak and then lost over 80% peak-to-trough, bottoming in 2002.
- 2008 Global Financial Crisis: The index fell roughly 60% as capital spending collapsed, then rebounded strongly on smartphone and cloud demand.
- 2018 U.S.-China trade tensions: Export restrictions and cyclical inventory worries produced a roughly 30% correction, followed by new highs in 2019.
- 2020-2021 pandemic and remote-work boom: Cloud, PC, and data-center demand pushed SOX to then-record levels.
- 2022 Fed hiking cycle: Aggressive rate hikes compressed multiples; SOX fell more than 30% from its highs.
- 2023-2026 AI wave: ChatGPT-driven AI demand, led by NVIDIA, lifted the index dramatically. SOX closed above 5,900 in July 2024 to set a record, reached a fresh all-time high of 9,556.42 on April 17, 2026, and has been extending the AI chip super-cycle.
The pattern is clear: SOX's drawdowns are painful but typically set up the next leg of growth as demand for the next wave of chips ramps.
4.3 Long-Term CAGR Data
Looking at the closest ETF proxy, iShares Semiconductor ETF (SOXX), trailing annualized returns sit well above the broad market:
| Period | SOXX Annualized Return | Notes |
|---|---|---|
| Trailing 5 years | ~21-22% | Covers the AI acceleration period |
| Trailing 10 years | ~30% | Spans multiple boom-bust cycles |
| Trailing 15 years | ~22% | Includes the post-GFC recovery |
Data based on public SOXX performance disclosures; actual values move with each reporting date.
Across the past decade, the VanEck Semiconductor ETF (SMH) has delivered roughly 33% annualized, meaningfully outperforming the S&P 500's roughly 16% annualized over the same period. Put differently, over the past 10-15 years, semiconductor indices have delivered approximately double the annualized returns of the broad U.S. market, though with noticeably higher volatility.
4.4 SOX vs S&P 500: The Long Arc
Over long windows, the outperformance is striking. Industry research using Bloomberg data shows that from mid-2008 to mid-2022, SOX returned roughly +637% cumulative versus about +210% for the S&P 500, or roughly 3x the broad-market return over 14 years. Over the last 10 years, Morningstar and ETF providers show semiconductor indices producing annualized returns roughly double the S&P 500.
That long-run outperformance has a clear price: SOX's peak-to-trough drawdowns range from roughly 30% (2018 trade war) to 82% (2000 dot-com bust), considerably deeper than typical broad-market corrections. Long-term investors who stay the course capture the outperformance; those who mistime the cycle can suffer outsized losses.
5. SOX vs Other Major Indices
SOX is a pure-play semiconductor index, while the Nasdaq-100 (NDX), S&P 500 Information Technology sector, and MSCI Global Semiconductors index each take a broader or different view. Understanding the differences is essential for sizing positions and avoiding unintended correlation risk.
5.1 SOX vs Nasdaq-100 (NDX)
The Nasdaq-100 holds the 100 largest non-financial Nasdaq-listed companies, spanning software (MSFT, GOOGL, META), e-commerce (AMZN), consumer tech (AAPL), and a growing share of semiconductors. SOX focuses on 30 pure semiconductor names.
- Number of constituents: NDX 100 vs SOX 30
- Sector purity: SOX ~100% semiconductors; NDX ~25-30% semiconductor exposure
- Volatility: SOX annualized volatility is roughly 1.3-1.5x NDX
- Cycle leadership: SOX typically turns 1-2 quarters ahead of NDX around major cyclical inflections
5.2 SOX vs S&P 500 Information Technology Sector
The S&P 500 IT sector includes semiconductors but is dominated by Apple (AAPL) and Microsoft (MSFT), which together can represent nearly half the sector weight:
- Weight structure: S&P 500 IT concentrated in AAPL + MSFT; SOX led by NVDA + AVGO + AMD
- Volatility profile: SOX > S&P 500 IT > S&P 500 overall
- Investment angle: SOX gives the cleanest exposure to AI accelerators and foundry; S&P 500 IT offers a smoother, more diversified tech allocation
5.3 SOX vs Broader Tech ETFs (SOXX vs XLK)
A common question for U.S. investors is whether to hold a pure-play semiconductor ETF or a broad technology sector ETF. According to Nasdaq's published performance comparison, over the trailing five years, SOXX has delivered a 5-year CAGR of roughly 21%, versus about 19% for XLK (Technology Select Sector SPDR). The spread has come with materially higher volatility, particularly during 2022 and during post-earnings whipsaws around NVIDIA prints.
5.4 SOX vs MSCI Global Semiconductors (for International Exposure)
For investors outside the U.S., or those seeking broader global coverage including Samsung and SK Hynix (which are not in SOX because they lack U.S. listings), the MSCI ACWI IMI Semiconductors & Semiconductor Equipment Select ESG Screened Capped Index is a common alternative. It is tracked by the iShares MSCI Global Semiconductors UCITS ETF (SEMI), giving access to Korean memory leaders and ESG-screened global exposure with a 0.35% expense ratio.
5.5 Four-Way Comparison Table
| Metric | SOX | Nasdaq-100 | S&P 500 IT | MSCI Global Semis |
|---|---|---|---|---|
| Constituents | 30 | 100 | ~65-70 | Large + mid + small global |
| Primary industries | Pure semiconductors | Broad tech + internet | Tech hardware + software | Global semis only |
| Top weights | NVDA, AVGO, AMD | AAPL, MSFT, NVDA | AAPL, MSFT | NVDA, TSM, AVGO, Samsung |
| Annualized volatility | High | Mid-high | Medium | High |
| Cycle leadership | Leads tech cycle | Leads broad tech | Broad-market tech | Global semi cycle |
5.4 Regional Semiconductor Indices
Beyond SOX, several Asian exchanges have launched their own semiconductor benchmarks that track the global chip cycle from regional angles:
- Nikkei Semiconductor Index (launched March 2024): Covers 30 Japan-listed semiconductor names including Tokyo Electron (8035), Advantest (6857), Disco (6146), and Renesas (6723). Heavy weight in semi equipment and materials makers, which react sensitively to NVDA's AI capex guidance and TSMC's monthly sales — making this index a "next-day echo" of US SOX moves.
- Taiwan Weighted Index semi exposure: TSMC alone represents roughly 30% of the Taiwan Stock Exchange (as of August 2023); Taiwan's electronic sector broadly mirrors SOX with a historical regional beta of approximately 1.2x.
Cross-market trading note: When NVIDIA reports earnings after the US close, Japanese equipment makers (Tokyo Electron, Advantest, Disco) typically gap 2-5% at Tokyo's 9:00 AM open, reflecting the supply-chain read-through. This pattern has become increasingly reliable since the 2023 AI boom. For Asia-Pacific investors seeking JPY-denominated exposure to the same theme, the TSE-listed Global X Japan Semiconductor ETF (2243) tracks a broadly similar equipment-heavy basket.
6. How to Invest in the SOX Index
Investors can gain SOX exposure through U.S.-listed ETFs, UCITS ETFs (for European investors), options and futures, CFDs, and systematic dollar-cost averaging strategies. The right vehicle depends on account type, tax jurisdiction, risk tolerance, and whether you want cash-settled exposure or the ability to go short.
6.1 U.S.-Listed ETFs: SOXX vs SMH vs SOXQ
Three ETFs dominate U.S. semiconductor flows. Their differences are important because they track different indices with different capping rules, which changes the weight of TSMC, NVIDIA, Broadcom, and Intel materially.
| Metric | SMH (VanEck) | SOXX (iShares) | SOXQ (Invesco) |
|---|---|---|---|
| Issuer | VanEck | iShares (BlackRock) | Invesco |
| Underlying index | MVIS US Listed Semiconductor 25 | ICE Semiconductor Index | PHLX Semiconductor Sector (SOX) |
| Number of holdings | 25 | 30 | 30 |
| Expense ratio | 0.35% | 0.34% | 0.19% |
| Approx. AUM (2026) | ~$40 billion | ~$27 billion | smaller, growing |
| Distribution frequency | Annual | Quarterly | Quarterly |
| Cap mechanism | Market-cap weighted, top holding can be very large | Top 5 capped at 8%, others at 4% | Tiered 12/10/8/4% (matches SOX exactly) |
| Approx. TSMC weight | ~13-14% | ~4-5% | ~4% (mirrors SOX) |
| Approx. NVIDIA weight | ~18-19% | ~10% | ~11% (mirrors SOX) |
Weights change with every rebalance; always verify on the issuer's official factsheet.
How to choose:
- Want concentrated exposure to NVIDIA, TSMC, and ASML as the core AI trade? SMH delivers the highest top-name exposure.
- Want broader diversification with capped top weights and the largest liquid ETF option after SMH? SOXX.
- Want the lowest cost and a direct mirror of the actual SOX index? SOXQ at 0.19% is the most capital-efficient.
One important clarification: SOXX is often referred to as "the PHLX Semiconductor ETF," but BlackRock transitioned its underlying benchmark to the ICE Semiconductor Index on June 21, 2021. If you want true-to-SOX tracking, SOXQ is the purer choice.
6.2 UCITS ETFs for European and UK Investors
U.S.-domiciled ETFs such as SOXX and SMH are typically inaccessible or tax-inefficient for European investors due to PRIIPs/KID regulations. UCITS-wrapped alternatives solve this:
| ETF (ISIN) | Expense Ratio | AUM | Index |
|---|---|---|---|
| iShares MSCI Global Semiconductors UCITS ETF (SEMI, IE000I8KRLL9) | 0.35% | ~EUR 2.4 billion | MSCI ACWI IMI Semis & Equipment ESG Screened Capped |
| HSBC Nasdaq Global Semiconductor UCITS ETF | ~0.30% | smaller | Nasdaq Global Semiconductor Index |
UCITS wrappers are Irish or Luxembourg domiciled, typically tax-efficient for EU and UK investors, and often include ESG screens that exclude major weapons-related holdings. Note that SEMI includes global names like Samsung Electronics and SK Hynix, which SOX itself does not, making it a broader semiconductor benchmark rather than a pure-play SOX proxy.
6.3 Options, Futures, and Derivatives
For experienced traders and institutions:
- SOXX and SMH options: Deep liquidity; weekly and monthly expiries; allow directional or volatility trades
- Single-name options on NVDA, AVGO, AMD, TSM: Highest liquidity around earnings; commonly used for event-driven positioning
- Futures: CME-listed E-mini Nasdaq-100 futures are commonly used as a high-beta proxy for semiconductor exposure; dedicated SOX futures exist but are thinly traded
Derivatives offer leverage and the ability to hedge, but require careful management of theta decay, implied volatility crush post-earnings, and margin risk.
6.4 CFDs and Other Leveraged Instruments
Contracts for Difference (CFDs) allow two-way exposure with leverage to semiconductor ETFs (SMH, SOXX) and individual constituents (NVDA, AMD, TSM). Advantages include:
- Flexible long/short trading without borrowing shares
- Capital efficiency through margin-based positioning
- Accessible sizing for testing strategies
Before trading chip exposure via CFDs, it helps to familiarize yourself with U.S. equity-index CFDs such as US500 to understand overnight financing, margin requirements, and how gap risk behaves around earnings. CFDs are high-risk instruments best suited to short-term tactical strategies with strict risk controls. Regulatory availability varies by jurisdiction; U.S. retail investors are generally restricted from CFDs.
6.5 Retirement Accounts and Dollar-Cost Averaging
For investors using tax-advantaged accounts (US 401(k) / IRA, UK ISA / SIPP, Japan NISA, Australia Super Fund, etc.), semiconductor ETFs are well suited to systematic contribution strategies. Morningstar's recommended approach for 2026 is a barbell portfolio: combine high-growth AI-linked exposure (semiconductor ETFs) with quality value stocks to dampen volatility, rebalancing when one side stretches materially.
Practical guidelines for retirement portfolios:
- Cap total semiconductor allocation at 5-15% of equity portion, depending on age and risk tolerance
- Use dollar-cost averaging monthly or quarterly to smooth entry across the cycle
- Rebalance annually to trim large winners and reload laggards
- Pair with broad-market core holdings (S&P 500, total world) so the semiconductor slug remains a satellite
7. Trading Strategies for the SOX Index
Three strategies work particularly well on SOX given its high volatility and leading-cycle behavior: trend following, counter-cyclical positioning, and event-driven trading. All three require disciplined risk management.
7.1 Trend Following
SOX is one of the most reliable trend-following tapes in U.S. equities because cyclical moves tend to persist for quarters, not days. A classic playbook:
- Moving-average system: 50-day EMA and 200-day EMA. Golden-cross and death-cross signals have produced robust historical alpha on SOX
- Trend strength filter: Require ADX > 25 to confirm the trend is established, avoiding whipsaws during range-bound regimes
- Position sizing: Add on pullbacks to the rising 50-day EMA; exit when the 50-day EMA crosses below the 200-day EMA
When SOX trades above its rising 200-day EMA and the 50-day EMA is above the 200-day, the bias is clearly bullish. The opposite configuration warns of a cyclical correction.
7.2 Counter-Cyclical and Contrarian Positioning
Because semiconductor cycles are deep and observable, contrarian positioning at cycle lows has historically generated substantial alpha:
- Historical cycle lows: The 2008 financial crisis, the 2018 trade-war correction, and the 2022 rate-hike bottom all marked SOX drawdowns of 30-60% and were followed by multi-year rallies
- Valuation signals: Watch for aggregate forward P/E falling below the 10-year median, or price-to-book below roughly 1.5x for the sector composite
- Staged entries: Scale in over 3-6 months rather than attempting to catch the exact bottom
The risk with this "left-side" trading is that fundamentals can deteriorate further before inflecting; size conservatively and pre-define a maximum drawdown tolerance.
7.3 Event-Driven Trading
SOX reacts sharply to a predictable set of catalysts:
- FOMC meetings: Rate decisions and the dot plot often drive single-session SOX moves of 2-4%
- NVIDIA earnings: Wall Street treats NVIDIA's earnings as a macroeconomic indicator for the AI trade, not a single-company event. Expect elevated implied volatility into the print and potential gaps of 6-10% in the stock, with knock-on effects across SOX
- TSMC monthly revenue and quarterly results: The world's leading-edge foundry sets the tone for global chip demand
- CHIPS Act grant announcements and geopolitical headlines: Export-control changes and subsidy disbursements frequently move the equipment complex (AMAT, LRCX, KLAC)
- Hyperscaler CapEx guidance: Quarterly updates from Microsoft, Google, Amazon, and Meta directly impact NVIDIA and AMD
Event-driven traders should plan entries and exits before the event, define maximum position size based on IV-implied expected move, and consider defined-risk structures (spreads rather than naked options) to manage tail risk.
7.4 Risk Management
Regardless of style, SOX's volatility demands strict risk discipline:
- Leverage limits: Keep aggregate leverage below 3-5x when trading CFDs or futures on SOX-related products
- Stop-loss discipline: Use technical invalidation levels; cap single-trade loss at 1-2% of account equity
- Correlation management: Avoid stacking SOX + Nasdaq-100 + individual mega-cap tech positions, since they share heavy exposure to NVIDIA and Broadcom
- Overnight carry cost: CFD overnight financing adds up; for multi-month positions, a spot ETF (SOXX, SMH, SOXQ) or direct stock is usually more cost-effective
- Liquidity windows: Avoid sizing up into thin pre-FOMC or pre-NVDA-earnings tape; slippage on SOX component stocks widens materially in the minutes before catalysts
8. Frequently Asked Questions
Q1. How is the SOX Index different from the Nasdaq-100 or S&P 500 IT sector?
SOX is a pure-play semiconductor index of 30 companies focused on chip design, manufacturing, equipment, and materials. The Nasdaq-100 is broader, including software, internet, and consumer technology; the S&P 500 IT sector is dominated by Apple and Microsoft. SOX therefore has higher volatility than either benchmark but gives the cleanest exposure to the chip cycle. It is widely used as a leading indicator for the broader tech complex.
Q2. Can the SOX Index keep rallying on AI demand?
The outlook depends on three factors. First, hyperscaler CapEx: if Microsoft, Google, Amazon, and Meta continue to revise AI CapEx higher, NVIDIA, Broadcom, AMD, and the equipment complex should benefit. Second, inference demand: as AI moves from training to deployment at scale, inference-optimized chips (AMD, custom ASICs, edge AI) support the next leg. Third, risk factors: disappointing AI ROI, a hyperscaler spending pause, or escalating export controls could trigger a cyclical pullback. Historically, even within structural growth cycles, SOX has delivered 30%+ corrections; disciplined position sizing and staged entries remain essential.
Q3. Does the SOX Index include non-U.S. companies like TSMC and ASML?
Yes. SOX is a U.S.-listed index, not a U.S.-company index. Taiwan Semiconductor (TSM ADR) and ASML Holding (U.S.-listed shares) both qualify. However, companies that only trade on foreign exchanges, such as Samsung Electronics (Korea) and SK Hynix (Korea), are not included. Investors wanting Korean memory exposure should consider the MSCI Global Semiconductors benchmark instead.
Q4. Does the SOX Index pay dividends?
No. SOX is a price return index and does not reinvest dividends. However, ETFs that track SOX or related semiconductor benchmarks (SOXX, SMH, SOXQ) pass dividends through to shareholders. SOXX and SOXQ distribute quarterly; SMH distributes annually. For long-term investors, the total return on SOX-tracking ETFs has materially exceeded the price index due to dividend reinvestment.
Q5. How correlated is SOX with NVIDIA's earnings?
Extremely high in the current AI cycle. NVIDIA alone represents approximately 11-12% of SOX (near the 12% cap) and carries outsized market influence because hyperscaler AI CapEx is the single largest demand driver. Schwab and other research houses now describe NVIDIA earnings as a macroeconomic indicator for AI, not a single-company event. SOX commonly moves 2-4% in the session after NVIDIA's print, and event-driven traders specifically target the NVDA earnings window as a SOX catalyst.
Q6. Should I hold semiconductor ETFs in tax-advantaged retirement accounts?
Semiconductor ETFs can be a productive satellite holding in tax-advantaged retirement accounts (US 401(k) / IRA / Roth IRA, UK ISA / SIPP, Japan NISA / iDeCo, Australia Super Fund, etc.) thanks to their long-run outperformance and favorable tax treatment under tax-deferred or tax-exempt structures. Individual country rules vary significantly — in particular, US dividend withholding may not be fully recoverable within non-US tax-exempt wrappers — so consult a qualified local tax adviser before implementation. A typical guideline: cap semiconductor exposure at 5-15% of the equity portion of a retirement portfolio, with broad-market index funds (S&P 500 or ACWI) as the core.
Q7. What is the difference between SOXX and the SOX index itself?
The SOX (PHLX Semiconductor Sector Index) is a benchmark index maintained by Nasdaq. SOXX is the iShares ETF originally designed to track SOX, but on June 21, 2021, BlackRock transitioned SOXX's underlying benchmark to the ICE Semiconductor Index. The two indices are similar in spirit but apply different capping rules and can produce modestly different returns. If you want a fund that truly mirrors SOX, the Invesco SOXQ ETF tracks the actual PHLX Semiconductor Sector Index with the exact 12/10/8/4% tiered cap.
Q8. How long does a semiconductor cycle typically last?
Semiconductor industry research points to a roughly 3-4 year full cycle, composed of four phases:
- Expansion (12-18 months): New applications drive demand; inventories are lean; fabs add capacity
- Plateau (6-12 months): Revenue records are set but year-over-year growth rates start decelerating; share prices often lead the turn
- Contraction (6-12 months): Demand softens; inventory corrections ripple through the supply chain; SOX typically drawdowns 30%+
- Recovery (6-12 months): Inventories normalize; new applications emerge; the index leads the fundamental trough
Understanding where you are in the cycle is central to sizing exposure, rebalancing, and avoiding late-cycle buying.
9. Key Takeaways
The Philadelphia Semiconductor Index (SOX) is the definitive benchmark for the global chip cycle. Understanding its structure, drivers, and trading behavior is essential for any investor positioning in the AI era.
Key points from this guide:
- Structure: 30 U.S.-listed semiconductor companies; modified cap-weighted with 12/10/8/4% tiered caps; rebalanced quarterly, reconstituted annually in September.
- Record highs: SOX closed above 5,900 in July 2024 and reached 9,556.42 on April 17, 2026 (all-time high) as the AI super-cycle extended.
- Long-term performance: Semiconductor indices have historically delivered roughly double the annualized return of the S&P 500 over 10-15 years, with 2x to 3x the broad-market drawdowns.
- Five key drivers: Technology innovation, supply chain and geopolitics, Fed policy, capital flows and sentiment, and AI CapEx plus CHIPS Act subsidies.
- Investment vehicles: SOXX (ICE Semi), SMH (MVIS 25), SOXQ (pure SOX at 0.19%), UCITS alternatives like SEMI for European investors, options, futures, and CFDs.
- Trading playbook: Trend following with EMA crossovers, contrarian positioning at cycle lows, and event-driven trading around NVIDIA earnings, FOMC meetings, and TSMC results.
As AI, 5G, automotive electronics, and high-performance computing continue to drive secular demand, semiconductors remain a structural growth sector. SOX is the lens through which professional and retail investors alike track that story. Monitor index levels, constituent earnings, and CHIPS Act progress together, pair your exposure with disciplined risk management, and the sector's volatility can be captured rather than feared.
Further reading: S&P 500 (US500) index overview and VIX volatility index guide.
Further Reading
The financial markets research team at Titan FX. We produce educational content across a broad range of instruments, including forex (FX), commodities (crude oil, precious metals, agricultural products), equity indices, U.S. stocks, and crypto assets.
Primary Sources (by Category)
- Official data and index methodology: NASDAQ OMX PHLX — PHLX Semiconductor Sector Index methodology; U.S. CHIPS and Science Act / European Chips Act — public government documents and subsidy figures
- Market, ETF and industry data: Bloomberg — historical index performance and constituent financials; Semiconductor Industry Association (SIA) — global sales and R&D data; BlackRock iShares, VanEck, Invesco — ETF factsheets (SOXX, SMH, SOXQ)
- Research and media references: Deloitte and Morningstar — semiconductor industry outlook reports; Charles Schwab and Nasdaq research — earnings-season and sector analysis