What Is Currency Correlation? Patterns, Risk & Titan FX Tools

In the forex market, many currency pairs don't move entirely independently—they show clear positive or negative correlations. Understanding these relationships helps traders manage risk more effectively and optimize their trading portfolios.
This article covers the basic definition and measurement of currency correlation, the common patterns seen in the forex market, how to use correlation to refine your strategy, and Titan FX's practical tools—helping you make your forex trading more systematic and better controlled for risk.
- Grasp the basics of currency correlation and how positive vs. negative correlation affects trade direction.
- Learn to read the correlation coefficient and the strength of the link from +1 to -1.
- Recognize classic pairings, including how commodity currencies and safe-haven currencies move.
- Use correlation to filter false signals and optimize how you allocate risk.
- Meet Titan FX's Titan_SymbolCompare indicator for visual monitoring of multiple symbols.
- 1. What Is Currency Correlation? Definition and Importance
- 2. How to Read the Correlation Coefficient
- 3. Common Correlation Patterns in the Forex Market
- 4. Using Correlation to Optimize Strategy and Risk Management
- 5. A Pro Tool: The Titan_SymbolCompare Indicator
- 6. Currency Correlation FAQ
- 7. Summary: Trading More Steadily with Correlation
1. What Is Currency Correlation? Definition and Importance
Currency correlation is the degree to which the prices of two or more currency pairs move together, usually measured by a correlation coefficient.
In the forex market, very few pairs trade entirely on their own. Many show clear positive or negative correlations—for example, EUR/USD and GBP/USD often rise and fall together. That's a classic positive correlation.
Understanding currency correlation serves two main purposes.
Purpose 1: Prevent over-concentrated risk Many beginners trade highly correlated pairs (like EUR/USD and GBP/USD) at the same time without realizing they're doubling up on US dollar risk. If the dollar suddenly strengthens, both positions can lose at once.
Purpose 2: Provide an extra confirmation signal When you see a breakout signal on one pair, a similar move on a highly correlated pair greatly increases the trade's reliability. If the correlated pair doesn't follow through, the signal may just be short-lived noise.
2. How to Read the Correlation Coefficient
In practice, we quantify this link with a correlation coefficient, which ranges from -1 to +1.
Positive correlation
The closer the coefficient is to +1, the more the two pairs tend to move in the same direction—and the higher the value, the stronger the link. For example, EUR/USD and GBP/USD often hold a coefficient above 0.7, and their charts tend to look very similar. Pairs with closely aligned economies, such as AUD and NZD, can show an even stronger positive correlation of around +0.85 to +0.95.
Negative correlation
The closer the coefficient is to -1, the more the two pairs tend to move in opposite directions. For example, EUR/USD and USD/CHF often show a clear negative correlation: when EUR/USD rises, USD/CHF tends to fall, because the dollar plays the opposite role in each.
No correlation
When the value is near 0, there's no meaningful link between the two pairs and their prices move independently. Such pairs are well suited to genuine diversification.
3. Common Correlation Patterns in the Forex Market
In forex, correlations between pairs aren't random—they follow some relatively stable patterns.
Pattern 1: The dollar's leading role
Because the US dollar is the core currency of the global forex market, many pairs quoted against it (EUR/USD, GBP/USD, AUD/USD) usually show a clear positive correlation. When the dollar strengthens on key data or Fed policy, these pairs tend to fall together.
Pattern 2: Commodity currencies and raw-material prices
Some currencies move closely with specific commodity prices. The Australian dollar (AUD) often shows a positive correlation with gold—since Australia is a major gold producer—typically in the +0.6 to +0.8 range. The Canadian dollar (CAD), meanwhile, is tightly linked to crude oil prices. These patterns offer a cross-market analytical edge.
Pattern 3: Currency divergence during risk-off episodes
When markets face major risk events (geopolitical tension or an economic crisis), safe-haven currencies—such as the yen (JPY) and the Swiss franc (CHF)—tend to attract demand. At such times, higher-risk currencies and safe havens often move clearly in opposite directions.
Mastering these common patterns lets you see potential risk more clearly when sizing positions, and make more rational trading decisions.
4. Using Correlation to Optimize Strategy and Risk Management
Use 1: Filter out false breakouts
When you're about to go long EUR/USD, also watch other European currencies or the US Dollar Index. If only EUR/USD rises while correlated pairs don't follow, it's likely short-lived noise rather than a reliable trend—so enter cautiously or wait for more confirmation.
Use 2: Hedge effectively
When markets are highly volatile and you'd rather not close an existing position immediately, you can open an opposite position in a pair that is strongly negatively correlated with your holding. This partially offsets the profit-and-loss swings and helps keep your account more stable.
Use 3: Adjust position allocation dynamically
Correlations shift over time and with market conditions. Review the coefficients between your holdings regularly. If pairs that were once complementary begin turning strongly positively correlated, trim your positions to avoid concentrating risk.
5. A Pro Tool: The Titan_SymbolCompare Indicator
To help you monitor how multiple symbols move together more intuitively, Titan FX offers a dedicated indicator, Titan_SymbolCompare, which plots the rate of change of your chosen symbols on the chart.
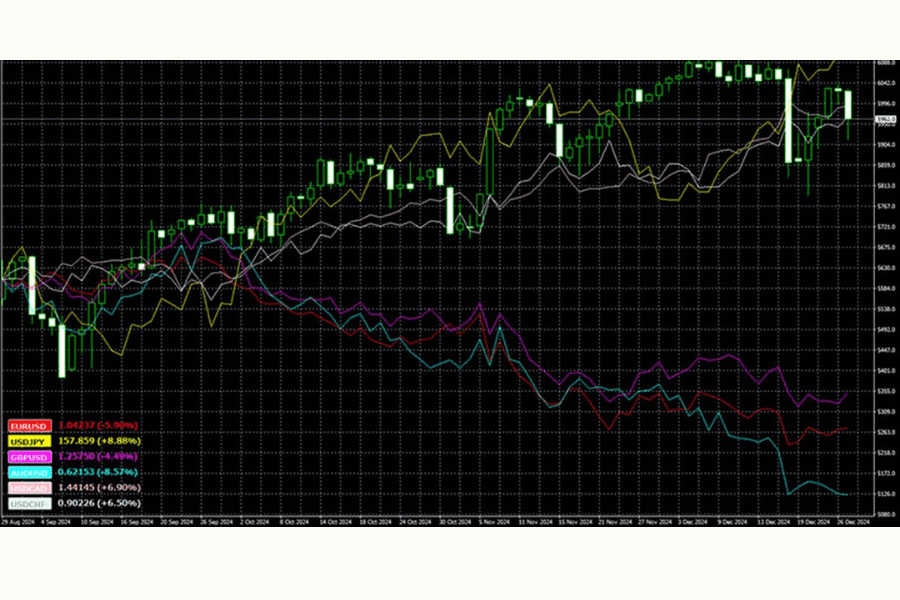
Titan_SymbolCompare can display the rate of change for up to six symbols at once on the chart, with a show/hide toggle. You can also display an inverted rate of change—for example, converting USD/JPY into JPY/USD—to compare currency strength more easily.
With this tool, you can quickly grasp the same- or opposite-direction relationships among multiple pairs on a single screen, improving both analytical efficiency and decision quality.
Titan_SymbolCompare User Guide6. Currency Correlation FAQ
Q1. Do currency correlations change?
Yes. Correlations shift dynamically with changes in national economic policy, major geopolitical events, and market sentiment. So it's best to reference recent correlation data (say, one or three months) rather than relying too heavily on long-term averages.
Q2. Should I avoid trading all positively correlated pairs?
Not necessarily. If you have a clear bearish view on the US dollar, trading both the euro and the pound can amplify your gains. The key is to understand that this increases your risk exposure, and to reduce the size of each individual position accordingly.
Q3. Why does the euro sometimes rise while the pound falls?
This reflects a temporary divergence in correlation. It may be due to UK-specific economic data, or the market repricing relative strength between the pairs. Such divergences often contain potential trading opportunities.
Q4. Is it fine to trade highly correlated pairs at the same time?
It's not recommended. Highly positively correlated pairs raise your risk concentration. It's better to diversify appropriately or choose negatively correlated combinations to hedge.
7. Summary: Trading More Steadily with Correlation
Currency correlation is a risk-management tool you can't afford to ignore in forex. Understanding the positive and negative correlations between currency pairs helps you avoid concentrating risk, filter out false signals, and hedge effectively when needed.
Keep in mind that correlations aren't fixed—they change with economic policy, geopolitical events, and market sentiment. So review recent data regularly rather than leaning on long-term averages. By using tools like Titan FX's Titan_SymbolCompare and building correlation analysis into your decisions, you can make your forex trading more systematic and more stable.
Further Reading
Titan FX Trading Strategy Lab. We produce investor-education content covering forex, commodities (crude oil, precious metals, agricultural goods), stock indices, US equities, and digital assets.
Primary Sources (by category)
- Correlation & data: Currency-pair correlation tables published by forex brokers; statistical calculation of the correlation coefficient (-1 to +1)
- Markets & commodity links: General analysis of how gold, oil, and other commodity prices move with resource-economy currencies (AUD, CAD, etc.)
- Investor education: Investor education from financial regulators and exchanges on diversification, hedging, and exposure management