Neckline
When a price pattern takes shape, the neckline often plays the key role in confirming a trend reversal and a breakout. It is an important reference line in technical analysis that helps traders time entries and exits.
This article covers the neckline's definition, how to draw it, and practical use, helping you read market structure and trend change more effectively.
- Definition: the reference line connecting a reversal pattern's key highs/lows
- Main patterns: head and shoulders, inverse, double top/bottom rely on it
- Draw in 4 steps: confirm pattern, find key points, extend line, confirm on close + volume
- Trading use: enter on break + volume (or retest), stop on the far side, target = pattern height
- Risk: false breaks without volume or in a range; confirm with RSI/MACD/MA
1. What Is a Neckline?
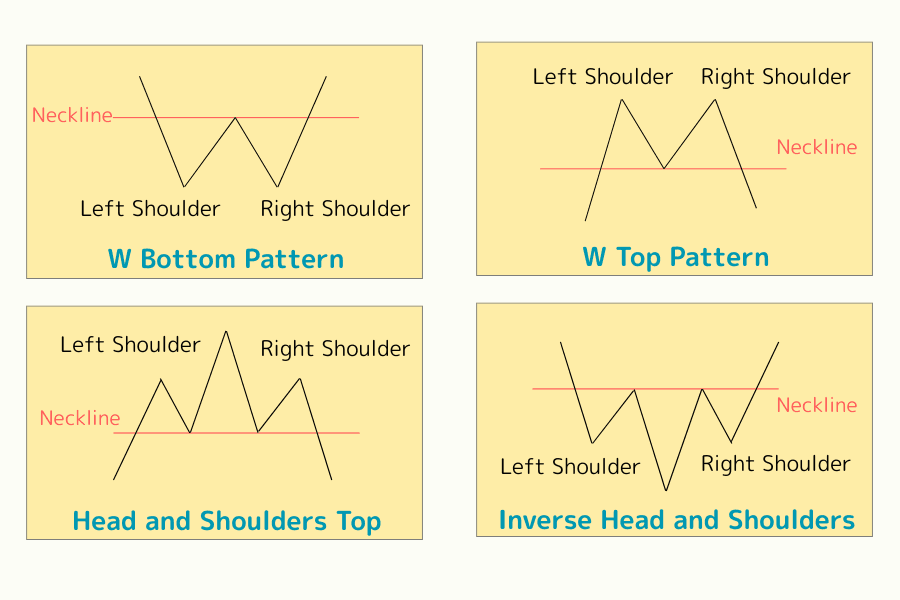
In technical analysis, the "neckline" is a key auxiliary line used to confirm a pattern's validity and a trend-reversal signal. It typically appears in head and shoulders, inverse head and shoulders, and double top / double bottom reversal patterns.
Further reading:- Head and Shoulders Top/Bottom: features and strategy
- Double Top and Double Bottom: features and strategy
The neckline acts like a "boundary": when price breaks it, the existing trend may be ending and a new one forming. Because it helps confirm the breakout point and a potential entry, it is regarded as one of the most important reference lines in chart analysis.
2. Role and Meaning of the Neckline in Charts
The neckline is the "structural core" of a price pattern. In reversal patterns it connects key lows or highs and represents the boundary between buying and selling pressure. As price nears or breaks it, it often signals a shift in market sentiment.
For example, in a head and shoulders, the neckline is the support connecting the two shoulder lows; once price falls below it, that is a clear downside signal. Conversely, in an inverse head and shoulders, the neckline is the resistance connecting the two shoulder highs, and a break above it often heralds an uptrend. Through the neckline, traders can observe momentum turning points more clearly and use them as a basis for entry/exit decisions.
3. How to Draw the Neckline
Drawing it looks simple, but an inaccurate line easily leads to misreading the breakout. Draw it according to the pattern type and the high/low structure.
| Step | Description | Key tip |
|---|---|---|
| 1. Confirm the pattern | Confirm a reversal pattern such as head and shoulders, inverse, or double top/bottom. | First identify the full left shoulder, head, right shoulder, or the two tops/bottoms. |
| 2. Find the key points | H&S: connect the shoulder lows; inverse: the shoulder highs; double: a horizontal line through the two highs or lows. | Use candle-body highs/lows, not wick extremes. |
| 3. Extend the neckline | Extend it horizontally or with a slight slope as the breakout reference. | If the slope is too steep, recheck whether the pattern is valid. |
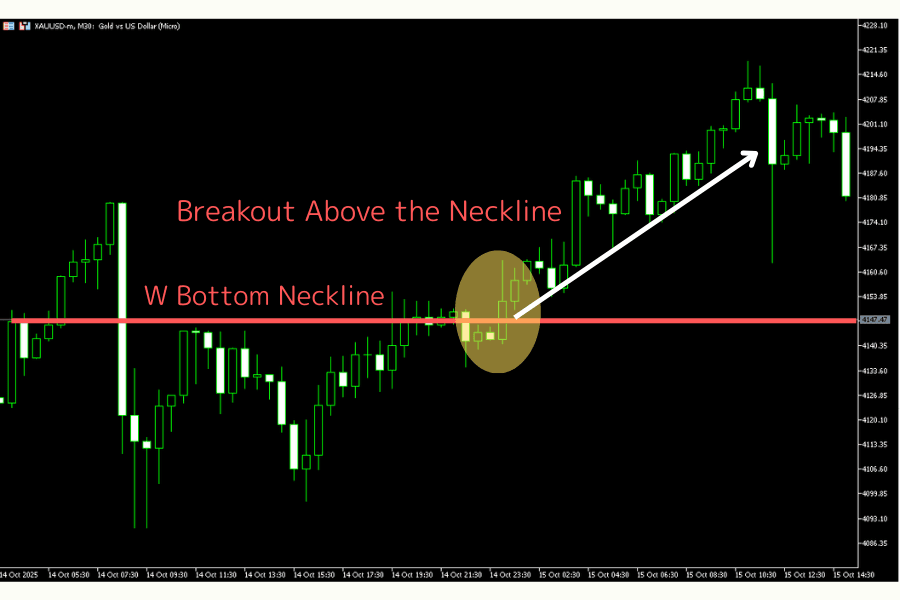
| 4. Confirm the break | When price breaks the neckline with clear volume, it is a potential reversal signal. | Wait for a closing-price break to avoid false breaks. |
4. Trading the Neckline Breakout
When price breaks the neckline, it often signals a trend reversal or continuation - an important entry or exit signal. In head and shoulders, inverse, and double top/bottom patterns alike, the neckline break carries a clear technical meaning.
| Point | How to act |
|---|---|
| Entry strategy | A valid break with rising volume can be an entry signal. Conservative traders wait for a retest of the neckline and a confirmed support/resistance flip before entering, improving the success rate. |
| Stop placement | Place the stop on the other side of the neckline at a key level to guard against false breaks. Short below a head-and-shoulders neckline: stop above it; long after an inverse break: stop below it. |
| Target projection | A common method uses the "pattern height." In a head and shoulders, the head-to-neckline distance is the expected drop; in an inverse, the low-to-neckline distance is the potential rise. |
Risk note
A neckline break is a reliable signal but not 100% accurate. Without supporting volume, or while the market is still ranging, a "false breakout" can occur. Confirm trend strength with other tools such as RSI, MACD and moving averages, and follow stop-loss discipline strictly.
5. Frequently Asked Questions (FAQ)
Q1. What is a neckline and which patterns show it?
A neckline is the key reference line that confirms a pattern and a trend reversal. It appears most in reversal patterns - head and shoulders, inverse head and shoulders, double top and double bottom - connecting the pattern's key highs or lows.
Q2. How do I draw the neckline correctly?
Head and shoulders connects the two shoulder lows; inverse head and shoulders the two shoulder highs; double top/bottom the two highs or lows. Use candle-body highs/lows rather than wick extremes, and extend it horizontally or with a slight slope as the reference.
Q3. How do I enter after a neckline break?
A valid break of the neckline accompanied by rising volume is an entry signal. Conservative traders wait for price to retest the neckline and confirm the support/resistance flip before entering, improving the success rate.
Q4. How do I set stop-loss and target with the neckline?
Place the stop on the other side of the neckline at a key level to guard against a false break. Project the target from the pattern height: in a head and shoulders use the head-to-neckline distance as the expected drop; in an inverse, the low-to-neckline distance as the potential rise.
Q5. Can a neckline break be a false breakout?
Yes. Without supporting volume or while the market is still ranging, a false break can occur. Confirm trend strength with tools like RSI, MACD, and moving averages, and strictly follow stop-loss discipline.
6. Conclusion: Why the Neckline Matters in Strategy
The neckline is not just an auxiliary line but an important basis for trading decisions. It helps confirm trend reversals and breakout timing and judge changes in market structure. Whether head and shoulders, inverse, or double top/bottom, a neckline break symbolizes a shift in the balance of buying and selling.
In practice, analyze it together with volume, price action, and other indicators rather than relying on the neckline alone. Combined with strict risk management and stop-loss strategy, neckline analysis delivers its real value. For forex and CFD traders, understanding and using the neckline improves entry precision and helps build a steadier, more disciplined trading strategy.
Further Reading
- Head and Shoulders Top/Bottom Reversal
- Double Top and Double Bottom Reversal
- What Is a Candlestick Chart?
- What Is Technical Analysis?
- What Is a CFD?
Titan FX's financial market research and analysis team produces investor education content across a wide range of financial instruments, including foreign exchange (FX), commodities (crude oil, precious metals, and agricultural products), stock indices, U.S. equities, and crypto assets.
Primary Sources by Category
- Chart-pattern fundamentals: Investopedia / CFI (Neckline / Head and Shoulders); Murphy, J. Technical Analysis of the Financial Markets
- Drawing and breakout method: CMT Association technical-analysis curriculum
- Risk management: general breakout-trading risk-management principles