PBR (Price-to-Book Ratio)
How many times a company's book value is the market willing to pay for its shares? The answer lies in the price-to-book ratio (PBR).
This article starts with the definition and formula of PBR, then explores what the numbers mean, how they differ by industry, how PBR compares with other valuation metrics, and the limits to keep in mind.
- PBR (P/B): Share price divided by book value per share — an asset-based gauge of cheap or expensive.
- Formula: PBR = price per share ÷ book value per share; how many times book value the market pays.
- Reading it: PBR < 1 may be undervalued, ≈ 1 fair, > 2 rich — but low PBR isn't automatically cheap.
- Sector matters: Best for banks, steel, shipping, and cyclicals; tech and brands run high PBR normally.
- Combine it: Use PBR with PER, ROE, EPS, and historical/peer comparison — never alone.
1. What Is PBR? Definition and Meaning
The Price-to-Book Ratio is a metric used in investment analysis to measure how many times a company's share price is relative to its book value. Common abbreviations include PBR, PB, P/B, and PB ratio — all the same concept, just expressed differently.
PBR answers a core question: "How much is the market willing to pay for every 1 unit of a company's book assets?"
It therefore belongs to the asset-based valuation metrics, helping investors judge whether a share price is reasonable from the angle of asset structure.
In financial analysis, PBR stands alongside the Price-to-Earnings Ratio (PER) and the Price-to-Sales Ratio (PSR) as one of the three most common relative-valuation metrics.
It reflects not only the market's confidence in a company's ability to generate returns on its assets, but also its view of the firm's long-term stability.
For example:
- If a financial stock's PBR sits around 1 over the long run, the market broadly sees its price as equal to book value — a reasonable valuation.
- If another company's PBR rises to 3, the market may be pricing in brand strength, a technological moat, or future growth potential.
2. How to Calculate PBR, with Examples
PBR measures the relationship between a stock's market price and a company's book value; its core is comparing "share price" with "book value per share (BVPS or BPS)."
The Formula
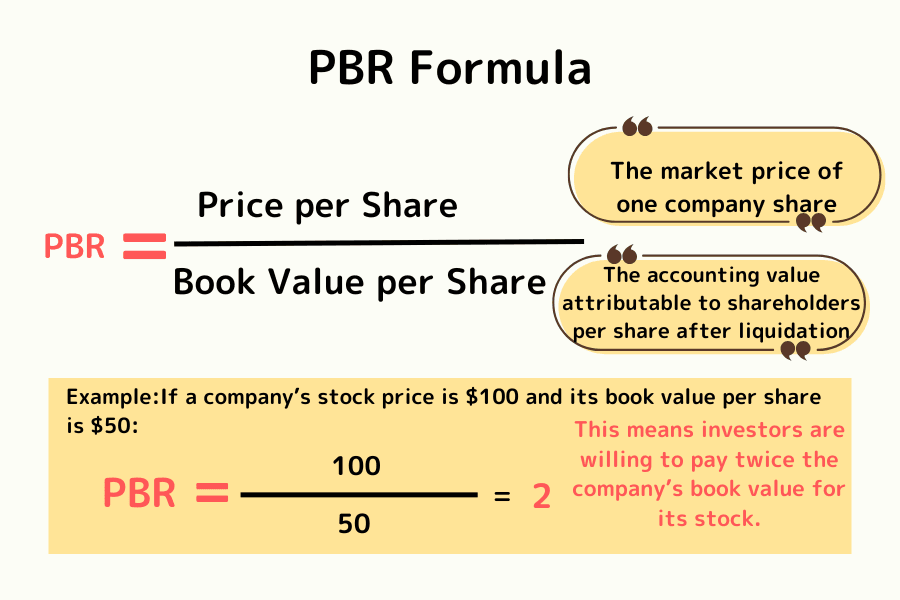
PBR = price per share ÷ book value per share
Where:
- Price per share: the company's market price per unit share.
- Book value per share (BVPS / BPS): the book value attributable to each share if the company were liquidated.
Book value per share = (total assets − total liabilities) ÷ shares outstanding
The unit is "times," showing how many times book value the market price is.
Worked Example
Assume a company has a book value per share of 50:
| Share price | Price-to-Book (PBR) | Interpretation |
|---|---|---|
| 25 | 0.5x | Price below book value — possibly undervalued |
| 50 | 1x | Price equals book value — fair valuation |
| 100 | 2x | Price above book value — the market assigns a premium |
For example, if the share price is 100 and book value per share is 50:
PBR = 100 ÷ 50 = 2
This means the market is willing to pay twice book value for the company's shares.
Once you have the formula and a concrete example, the next step is learning how to judge whether a stock is cheap or expensive from its PBR.
3. Reading PBR Values and What They Mean for Investors
A company's PBR reflects the market's confidence in its asset value and future earning power. Different PBR ranges represent how the market evaluates a firm at different stages. The table below summarises common reference points:
| PBR range | Market meaning | Investor reading |
|---|---|---|
| PBR < 1 | Price below book value | Possibly undervalued, a potential entry — but confirm the company is healthy |
| PBR ≈ 1 | Price near book value | A fair valuation; asset value supports the price |
| PBR > 1 | The market assigns a premium | Investors favour growth, brand strength, or earnings stability |
| PBR > 2 | High-valuation stage | Possibly overheated or pricing in expectations; assess the premium carefully |
What It Means for Investors
Low PBR Does Not Equal Cheap
Some companies trade below 1 for long stretches because of sector decline, unstable earnings, or low returns on assets.
So when judging "undervalued," you must confirm the company's fundamentals and asset quality.
High PBR Does Not Equal a Bubble
A company with strong brand value, a technological edge, or a stable, high ROE (Return on Equity) naturally earns a higher premium from the market.
Sector Differences Are Significant
The reasonable PBR range varies widely by industry.
For instance, heavy-asset sectors such as finance and steel typically sit at 0.8–1.5x, while technology- or brand-driven companies often exceed 3x.
Combine with Historical and Comparative Analysis
To assess whether a company is undervalued, compare against its own historical average or the peer-group average PBR — only then can you judge whether the current price is in overvalued or undervalued territory.
In short, the PBR value is not an absolute tool for deciding whether a stock is cheap or expensive, but a window into the gap between market valuation and corporate value.
Only when combined with sector context, financial data, and historical trends does PBR truly deliver its analytical value.
Key points:
- A low PBR is not absolute cheapness; the market may be pessimistic about the firm's outlook.
- A high PBR is not necessarily a bubble; it may reflect brand, technology, or monopoly advantages.
- Always combine with sector characteristics, fundamentals, and historical averages.
4. Using PBR for Stock Selection
PBR is not only a valuation metric but also an analytical tool for screening potential investments. Through different comparison methods and sector use cases, investors can look for stocks with "undervaluation potential" or a "steady premium" from the angle of asset value.
Suitable Sectors
PBR is especially well-suited to evaluating these types of companies:
- Business-cycle stocks: industries such as steel, shipping, cement, and autos. Their earnings swing sharply with the cycle, so PER often distorts during downturns, making PBR more reasonable.
- Heavy-asset industries: manufacturing, energy, and finance. These firms have real, valuable book assets in their scale and facilities, so PBR more accurately reflects the relationship between assets and market price.
- Unstable or loss-making companies: when earnings per share (EPS) is negative, PER cannot be used, but PBR can still provide an asset-based reference.
Comparison Methods
Against the Company's Own History
Look at a company's PBR range over 3–5 years. If a company averaged 2x but now trades at 1.2x, the price may be undervalued. Conversely, when PBR is clearly above its historical average, the market may expect a growth phase or the valuation may be stretched.
Against Peers in the Same Sector
Within an industry, differences in PBR reveal how the market evaluates returns on assets (ROA, ROE) or operating risk. Generally, healthy companies with stable earnings enjoy higher PBRs, while weaker or more volatile firms are assigned lower ones.
Against the Overall Market Average
As a macro reference, this helps judge whether the overall market is overheated or cheap. For example, when the market's average PBR exceeds its historical median, the market may be in an expensive phase; when it falls below the long-term average, valuations may be cheap and opportunities may rise.
In sum, the point of PBR in stock selection is not "finding the lowest number," but using historical comparison, sector analysis, and fundamental verification to judge whether the current price is reasonable. The truly effective use of PBR is to treat it as a supporting tool, combined with other valuation metrics and financial ratios to build a multi-layered basis for investment decisions.
5. PBR vs Other Valuation Metrics
In stock-valuation analysis, PBR (Price-to-Book), PER (Price-to-Earnings), and PSR (Price-to-Sales) are the three most common relative-valuation metrics. Each emphasises something different: PBR focuses on asset value, PER on earning power, and PSR on growth potential.
| Metric | Formula | Suitable sectors | Focus | Core meaning |
|---|---|---|---|---|
| PBR (Price to Book Ratio) | Price ÷ book value per share | Cyclical, heavy-asset industries | Asset value | Measures the market's valuation of and confidence in book assets |
| PER (Price to Earnings Ratio) | Price ÷ earnings per share (EPS) | Stable-earnings industries | Earning power | Reflects expectations for future earnings and payback time |
| PSR (Price to Sales Ratio) | Price ÷ sales per share | Startups, high-growth firms | Revenue scale | Measures confidence in the company's revenue growth |
When to Use Each
- PBR: best for asset-intensive companies with a high share of fixed assets, such as banks, steel, and shipping.
- PER: for companies with stable earnings and steadily growing profits, such as tech leaders and branded consumer firms.
- PSR: for startups not yet stably profitable, or high-growth industries such as cloud services and EVs.
An Easy Way to Remember
- P/E looks at "earning power": how well the company makes money.
- P/B looks at "asset value": how the market values the company's book value.
- P/S looks at "revenue scale": confidence in revenue expansion and growth.
Overall, these three tools each have their emphasis; they are not mutually exclusive but complementary. In practice, investors should mix them flexibly based on sector characteristics, company stage, and financial structure to reach a more complete valuation judgment.
Further reading: Understanding PER, PBR, EPS, and BVPS Together
6. Frequently Asked Questions
Q1: How is PBR different from PER, and which should I use?
PBR (Price-to-Book) measures share price against book value per share from the "asset side," while PER (Price-to-Earnings) measures share price against earnings per share from the "earnings side." Asset-heavy industries with volatile earnings (finance, steel, shipping) suit PBR; companies with stable earnings (brands, tech leaders) suit PER. In practice the two are complementary, so it is best to reference both and judge alongside ROE.
Q2: If PBR is below 1, is the stock cheap and worth buying?
Not necessarily. PBR < 1 means the price is below book value per share — in theory a "discount" — but staying below 1 for the long run often reflects market pessimism about the company's outlook, such as sector decline, unstable earnings, or low returns on assets (a "value trap"). To judge whether it is truly undervalued, combine the company's fundamentals, ROE, sector trends, and historical average PBR, rather than looking at the number alone.
Q3: Why does the reasonable PBR differ so much across sectors?
PBR reflects the market's valuation of "book assets," and asset structures and earnings models differ by sector. Heavy-asset industries (finance, steel, shipping) have large, valuable physical assets, so PBR usually sits at 0.8–1.5x. Light-asset, brand- or technology-driven companies (tech, consumer goods) derive much of their value from intangibles and growth expectations, so PBR often exceeds 3x. That is why PBR only makes sense when compared "within the same sector" or "against a company's own history."
Q4: Can PBR value a company that is losing money?
Yes — this is one of PBR's advantages. When a company's earnings per share (EPS) is negative, PER stops working, but as long as the company still has positive book value per share, PBR can provide an asset-based reference. That said, sustained losses can erode book value, so watch asset quality and whether the losses are likely to continue.
Q5: Can I trade stocks I've screened with PBR on Titan FX?
Yes. Titan FX offers contracts for difference (CFDs) on US stocks and major stock indices, so after completing your PBR and fundamental analysis you can trade the relevant US-stock or index CFDs on the platform. Note that CFDs are leveraged products, so manage risk carefully and use technical analysis to confirm entry and exit timing.
7. Summary
PBR is an important tool for understanding the gap between a company's asset value and the market's valuation. It shows how much of a premium investors are willing to pay over book value, and reflects the market's confidence in the firm's growth and stability.
In practice, investors should combine sector characteristics, historical data, and other valuation metrics (ROE, PER, cash flow, and so on) to judge a company's true value from multiple angles. PBR is not a decision in itself, but a window that helps you understand the relationship between the market and corporate value.
In one line: PBR lets you see a company's value, but whether it is worth buying still depends on "why it is worth that much."
Further Reading
- What Is the Price-to-Earnings Ratio (PER)?
- What Is Return on Equity (ROE)?
- What Is Earnings Per Share (EPS)?
- What Is Book Value Per Share (BPS)?
- Understanding PER, PBR, EPS, and BVPS Together
- US Stock Trading
Titan FX Research. Investor-education content covering forex (FX), commodities (oil, precious metals, agricultural products), stock indices, US equities, and crypto assets across global markets.
Primary Sources by Category
- Valuation theory and textbooks: Benjamin Graham & David Dodd, Security Analysis; Aswath Damodaran, Valuation (asset-valuation chapters)
- Financial data: public financial statements from national stock exchanges; company annual reports (shareholders' equity and book value on the balance sheet)
- Market data: Titan FX US-stock and equity-index quotes; PBR statistics from major financial databases