What Is the PPI (Producer Price Index)?
The Producer Price Index (PPI) is one of the more closely watched economic releases in financial markets, but it is also one of the easier indicators to misread. PPI rises and falls — yet whether those moves actually reflect a change in inflation, and why prices can swing sharply on one release and barely react on another, can be hard to pin down.
The key is that PPI's meaning sits not in the level of the number itself but in how it shifts the market's view of inflation, rates, and policy direction. In the right context, PPI provides important signals about producer-side price pressure; read out of context, it tends to mislead.
This article walks through the basics of PPI, what it actually measures, and how the market typically interprets a PPI release. Through common reaction patterns and a practical Q&A, it aims to give a clear, structured framework — so the data informs your view of the market environment rather than adds noise to it.
- PPI (Producer Price Index): A measure of the prices that domestic producers actually receive at the ex-factory or wholesale stage. Reflects the producer-side price environment and is widely treated as an early-stage inflation reference.
- How it is built: An index with a base period set at 100; tracks the average price change of a basket of raw materials, intermediate goods, final goods, and some production-related services.
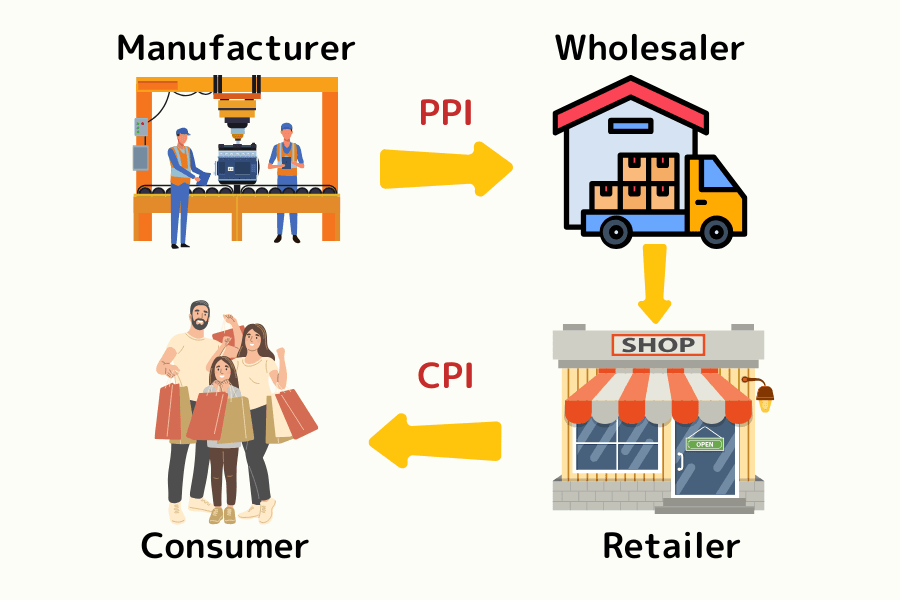
- How it differs from CPI: PPI captures ex-factory and wholesale prices from the producer's side, while CPI captures retail prices from the consumer's side. PPI is an early-stage reference; CPI is the central measure of inflation.
- How markets read it: What matters is the gap between the release and expectations, not the level itself. Above-expectations reads signal continued inflation pressure and higher-for-longer rate risk; below-expectations reads tend to ease worries about further tightening.
- The "scissors gap" and earnings: A rising PPI does not automatically compress profits — pricing power and cost pass-through are decisive. A widening PPI–CPI gap typically squeezes corporate margins.
1. What Is the PPI? The Basics of the Producer Price Index
The Producer Price Index (PPI) is an economic indicator that measures the change in prices that domestic producers actually receive at the ex-factory or wholesale stage. It reflects the producer side of the price environment, not the final retail price paid by consumers.
Unlike the prices shoppers see in stores, PPI tracks business-to-business pricing — covering raw materials, intermediate goods, and final goods at the producer side. It therefore provides a broad view of the "cost and pricing pressure" environment rather than the move in any one product's price.
Producers tend to face changes in input, energy, and labour costs first, and those pressures tend to show up first in ex-factory prices before passing through to the consumer market in stages. This is why PPI is treated as an early-stage reference for inflation pressure.
For investors, the value of PPI is not in predicting short-term moves — it is in helping to judge whether cost pressure is building on the producer side, and whether that pressure is likely to influence future prices and policy direction.
How PPI Differs from CPI
Both PPI and CPI relate to inflation, but they observe different stages of the price chain and play different roles in the market.
PPI looks at ex-factory and wholesale prices from the producer's perspective; CPI looks at retail prices from the consumer's perspective and measures changes in the cost of living.
| Compare | PPI Producer Price Index | CPI Consumer Price Index |
|---|---|---|
| Subject | Producers / firms | Consumers |
| Price stage | Ex-factory / wholesale | Retail / cost of living |
| Primary use | Cost pressure, early inflation read | Inflation and purchasing power |
| Market role | Early-stage inflation reference | Core inflation measure |
Worth noting: because processing, logistics, and distribution sit between the two, changes in PPI do not necessarily flow through to CPI immediately. In medium-to-long-term trends, however, the two are linked, which is why markets watch them together.
2. How Is PPI Calculated and What Does It Really Measure?
When trying to understand PPI, the key isn't the statistical formula — it's how the index is constructed and what its moves actually mean in market terms.
How it is calculated: an index with a base of 100
PPI is an index-type economic series. The statistics agency picks a base year and sets the average price level for that year at 100; subsequent releases express how prices have moved relative to that base.
If PPI moves from 100 to 105, the average producer-side ex-factory price has risen by about 5%; a fall to 98 means the price level is below the base period.
The point of an index design is to help the market quickly judge the direction and magnitude of price moves, not to compare absolute prices of any one product.
What it measures: the broader producer-side pricing environment
PPI measures the average change in a basket of producer-side prices, covering raw materials, intermediate goods, final goods, and some production-related services.
What PPI shows is therefore the broader price-and-cost environment producers are operating in, not the performance of any single firm, industry, or product.
Reading principle: focus on trend, not the single number
PPI is not a profit gauge. Even when PPI rises, whether firms can pass costs through and maintain margins still depends on demand and competition.
For investors, PPI works best as a backdrop for cost trends and inflation direction — used to read whether price pressure is building rather than as a tool for predicting short-term moves in a single name.
3. How Markets Typically Read a PPI Release
With the definition and the construction settled, what actually matters in markets is how a PPI release changes expectations on inflation and rates.
The relevance to investors is not the level of the number itself — it is whether the print shifts the prior view of the market.
What the market focuses on: the gap to expectations
What the market reacts to first is not whether PPI rose or fell, but how far the actual print deviates from expectations.
- ▸Above expectations: tends to be read as continued producer-side price pressure and lingering inflation risk
- ▸Below expectations: typically read as cooling price pressure, supportive of inflation and policy stability
So the magnitude of market reaction depends on the size of the surprise, not the direction of the number itself.
Why PPI moves rates and market sentiment
Because PPI reflects producer-side price changes, the market often treats it as an early reference for future inflation, which feeds expectations on central-bank policy.
- ▸When PPI runs hot for an extended period, the market more easily prices in higher-for-longer rates or further tightening risk
- ▸When PPI cools, the market tends to dial down expectations for more hikes or restrictive policy
This is why a PPI release often produces simultaneous moves across equities, bonds, and FX — not just a single-asset blip.
Sensitivity differs across asset classes
Different assets react differently to PPI, depending on their sensitivity to inflation and rate expectations.
- ▸Growth and technology equities: most sensitive to rate-expectation shifts, so PPI surprises often produce larger moves
- ▸Long-duration bonds: prices move with rate-expectation adjustments, making them a key observation post for PPI readings
- ▸Commodities and sectors with pricing power: may pass costs through, so reactions can decouple from the broader market
Split reactions across asset groups around PPI are therefore the rule, not the exception.
When PPI is released and how to track it
In the United States, PPI is usually released around the middle of each month. Per the latest BLS release schedule, CPI typically prints first and PPI follows the next day; the up-to-date dates can be checked on the BLS PPI and CPI release schedules. Although the release order sits after CPI, PPI still provides producer-side price signals and remains an important complement for reading the source of inflation pressure.
Investors can use the Titan FX economic-indicator dashboard to quickly see PPI's actual, consensus, and prior values — useful context for the data driving market moves.
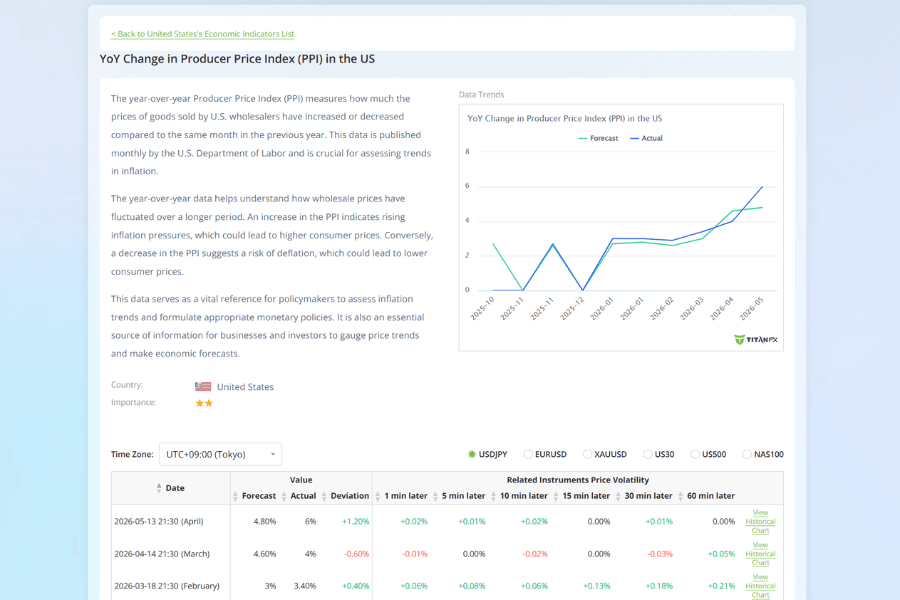
See the US Producer Price Index (YoY) page on the Titan FX economic indicator dashboard.
4. Frequently Asked Questions About the PPI
Q1: What is the PPI–CPI "scissors gap"?
The "scissors gap" is the phenomenon where PPI and CPI clearly diverge — for example, PPI continues to rise while CPI stays relatively flat, or the two move in opposite directions.
It signals that producer-side costs are rising but firms have not yet (or cannot) fully pass those costs through to consumers, which is common in environments of weak demand or strong competition. A widening scissors gap tends to squeeze corporate margins and is one of the more important market-watching signals.
Q2: Does rising PPI always hurt corporate earnings?
Not necessarily. Whether rising PPI hits earnings depends on a firm's cost pass-through power.
- ▸If a firm can raise prices smoothly, the earnings hit is limited.
- ▸If competition is intense or demand is weak, higher costs tend to compress gross margins.
PPI is therefore best read alongside industry structure and company filings rather than read alone.
Q3: Which sectors should pay special attention to PPI?
Generally, upstream and mid-stream sectors are the most sensitive — raw materials, energy, chemicals, and certain manufacturing industries.
Their cost and pricing structures map directly into PPI; consumer-facing or service-led sectors tend to be more sensitive to CPI or other consumer data.
Q4: Why does the market sometimes barely react to a PPI print?
PPI is an important release, but not every print produces a notable move. Common reasons include:
- ▸The print is close to consensus.
- ▸The market is already focused on a more important release or event.
- ▸There is a settled view on rates and policy direction.
For investors, this is a reminder to read PPI in the context of the broader market — not in isolation.
Q5: How should new investors actually use PPI?
For newer investors, PPI works best as a secondary tool for tracking inflation trends and the market environment, not as a basis for short-term trading.
Used together with CPI, rate decisions, and sector data, it helps build a more rounded view of where the market cycle sits.
5. Summary: How Investors Should View the PPI
The value of PPI is not in predicting a single product's price or a short-term swing — it is in helping investors judge whether producer-side cost pressure is building. It is more like a thermometer for the price environment, giving the market important background on inflation risk, policy direction, and asset-pricing conditions.
For investors, reading PPI in the context of expectations and the broader trend — together with CPI, rate policy, and other economic data — is more important than judging the level on its own. Only when PPI is set in that broader context does it deliver its real value as a market-environment tool, rather than becoming noise that disrupts decisions.
Further Reading
- What Is the CPI (Consumer Price Index)?
- What Is Inflation?
- What Is Monetary Policy?
- What Is the Federal Reserve (Fed)?
- What Is Quantitative Tightening (QT)?
- What Is Quantitative Easing (QE)?
- Forex Trading Basics
Titan FX Research. Investor-education content covering forex (FX), commodities (oil, precious metals, agricultural products), stock indices, US equities, and crypto assets across global markets.
Primary Sources by Category
- Official statistics: U.S. Bureau of Labor Statistics (BLS) — monthly Producer Price Index release with sub-indices; OECD Main Economic Indicators on PPI international comparisons; national statistical agencies (Bank of Japan CGPI / China's National Bureau of Statistics / Eurostat PPI)
- Policy and central banks: Federal Reserve Monetary Policy Report; FOMC Statements; ECB Economic Bulletin
- Market analysis: BIS Annual Economic Report; Bloomberg / CME FedWatch PPI commentary
- Academic background: Boskin Commission Report (1996) on price-index measurement issues; BLS Handbook of Methods (Chapter on PPI methodology); Diewert, W. E. Index Number Theory and Measurement Economics