What Is Quantitative Tightening (QT)?
When a central bank shifts from supplying money to withdrawing it, the tide of liquidity that once lifted markets quietly recedes—this is quantitative tightening (QT).
This article explains how QT works and its four-stage mechanism, real-world cases from major central banks, its impact on stocks, currencies, and bonds, its side effects, and strategies for investors.
- QT (Quantitative Tightening): A central-bank policy that shrinks the balance sheet to drain liquidity—QE in reverse.
- Mechanism: Four stages—halt reinvestment, sell assets, contract liquidity, lift long-end yields.
- Market impact: Equity valuations compress, bond yields rise, the home currency firms, EM funding tightens.
- Real-world cases: The Fed, ECB, BoJ, and BoE have all pursued tightening.
- Main risks: Recession, higher volatility, liquidity stress, and policy-pace missteps.
1. What Is Quantitative Tightening (QT)?
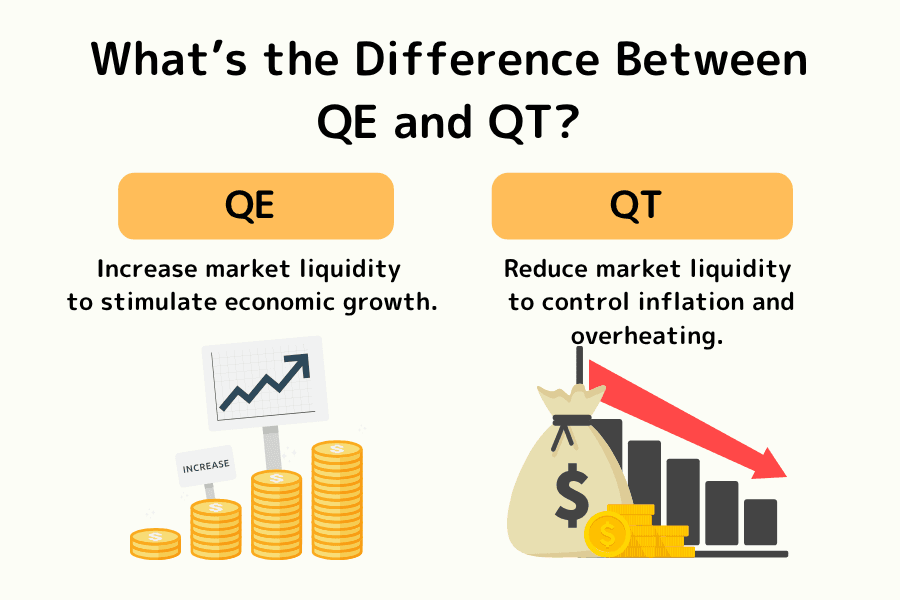
Quantitative Tightening (QT) is one of the core ways a central bank tightens monetary policy — the mirror image of QE (Quantitative Easing).
When extended QE has injected a very large quantity of liquidity and built up inflation and asset-price pressure, central banks turn to QT to actively shrink the balance sheet, withdraw liquidity, and lean against an overheating economy and financial-market imbalances.
Historical Context for QT
QT is typically used as a normalisation tool after a period of QE.
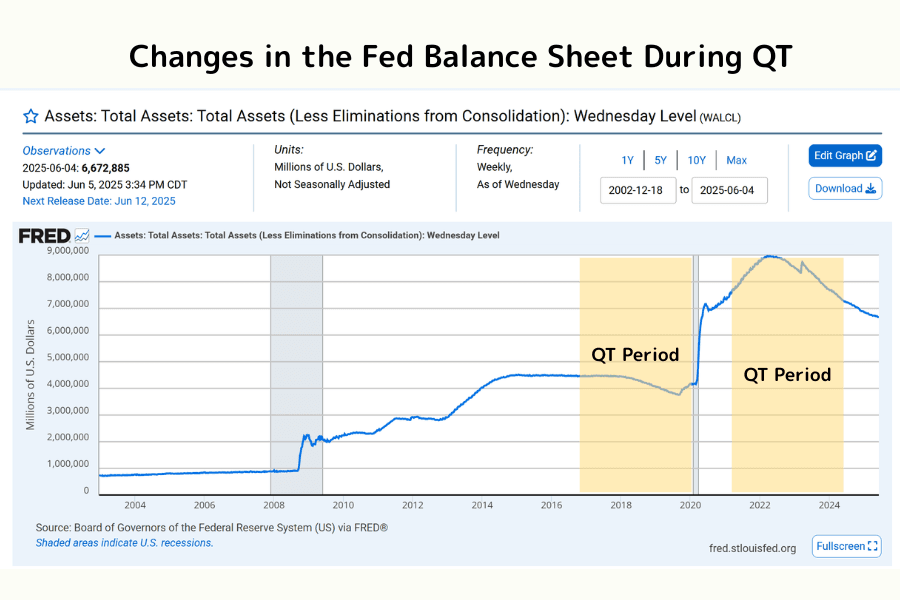
First Run (2017–2019)
The US Federal Reserve built its balance sheet up to about USD 4.5 trillion after the 2008 financial crisis. The first QT began in October 2017, running off as much as USD 50bn per month and reducing the balance sheet by roughly USD 700bn by the end of 2019.
Second Run, Post-Pandemic (2022 onwards)
The 2020 pandemic response pushed the Fed balance sheet to a record high near USD 9 trillion. With US CPI inflation peaking at 9.1% in 2022, the Fed restarted QT in June 2022 and lifted the cap to as much as USD 95bn per month (USD 60bn Treasuries + USD 35bn MBS).
Core Objectives of QT
Inflation Control
By reducing the money in circulation, QT eases price pressures and helps bring CPI and core-inflation gauges back down.
Tightening Liquidity
QT pulls back the excess liquidity built up during the post-pandemic easing era, dampening cash sloshing through markets and the risk-on behaviour it enables.
Stabilising Financial Markets
QT lets policymakers manage overheated asset prices, reduce the risk of bubbles in equities, housing, and credit, and strengthen the resilience of the financial system.
Normalising Policy
QT brings the central bank balance sheet back toward a healthier size, preserving room for monetary-policy response in the next crisis and supporting flexibility over the long run.
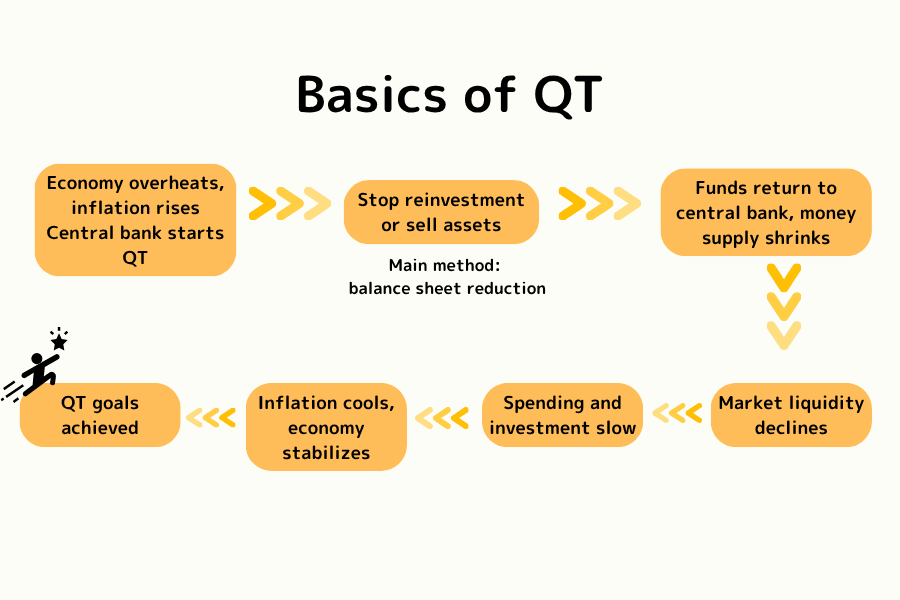
2. The Mechanics of QT
When inflation runs high, asset prices detach from fundamentals, the economy overheats, liquidity is excessive, and rate hikes start hitting diminishing returns, central banks reach for Quantitative Tightening (QT) as an additional way to tighten policy.
The core logic of QT is not "raising rates to lift funding costs" — it works on the balance sheet itself, drawing down the stock of liquidity, controlling the total quantity of money in markets, and gradually wringing out the easing effect that QE had built up. The full mechanism runs through four stages:
① Halting Reinvestment (Passive Runoff)
The central bank lets its holdings of Treasuries, MBS, and corporate bonds mature without reinvesting the principal. Assets roll off naturally and the monetary base begins to contract.
② Asset Sales (Active Runoff)
Some central banks (such as the Bank of England) go further and sell holdings directly into the market, pulling cash out of the financial system and reinforcing the liquidity squeeze.
③ Liquidity Contraction (Falling Bank Supply)
Banks' excess reserves and the broader market liquidity pool both shrink, the runway for credit expansion narrows, bank lending and corporate funding tighten, and economic activity slows.
④ Higher Yields (Rising Funding Costs)
More bond supply pushes prices down and yields (the long-end of the curve) up. Corporate borrowing costs, mortgage rates, and credit-spread yields all move higher, weighing on investment and consumption.
QT Process Flowchart
Economic Effects of QT
Short-Term Effects
- Higher funding costs reduce bank and corporate appetite to borrow, investment and consumption momentum slow, and aggregate demand softens.
- Inflation pressures ease and some of the asset-price overshoot built up during QE is partly unwound.
- Risk appetite drops and capital rotates into defensive assets like cash and short-dated Treasuries.
Long-Term Effects
- If QT is too fast or too large, growth can slow materially and even tip into recession.
- Rising long-end rates flow through to housing, equities, and high-leverage sectors, raising market volatility.
- International capital flows rebalance and some emerging markets face outflows and currency pressure.
3. How QT Moves Markets
QT transmits strongly into both financial markets and the real economy. The main channels include:
Channel 1: Inflation Cools and the Domestic Currency Strengthens
By reducing the money supply, QT typically helps to ease inflation. The tighter liquidity environment also tends to push the domestic currency higher — particularly for major reserve currencies like the US dollar. A stronger currency lowers imported-goods prices but can also weigh on export competitiveness.
Channel 2: Equities and Capital Markets
Liquidity withdrawal compresses equity valuations, with growth names, technology stocks, and high-leverage companies bearing more of the hit. Capital flows turn more conservative, some asset prices reset, and overall volatility tends to rise.
Channel 3: FX Markets
QT usually comes with broader policy tightening and higher rates, drawing international capital into the home market and lifting the home currency. For emerging markets, however, tighter USD liquidity raises the cost of servicing FX debt and the risk of capital flight, creating potential pressure points.
Channel 4: Bond Markets
QT reduces central-bank bond holdings, increases net supply to the market, and pushes prices down and yields up. Higher funding costs ripple through corporate investment, consumer credit, and housing demand, amplifying the broader cooling effect.
4. Global QT Case Studies
Below is a roundup of QT episodes in the United States, the euro area, Japan, and the United Kingdom, drawn from each central bank's official reports and the Titan FX research desk.
QT in the United States
The Federal Reserve has run the largest QT programmes of any major central bank, with two main cycles so far.
QT Cycle 1 (October 2017 – September 2019)
The Fed approached the first round with a "gradual runoff" template, reducing the balance sheet by up to about USD 50bn per month. Total assets fell from near USD 4.5 trillion to roughly USD 3.8 trillion over the period.
Markets wobbled in the process — S&P 500 and NAS100 both saw short-term corrections, and the technology growth segment took the biggest hit.
QT Cycle 2 (June 2022 – December 2025)
Responding to the rapid post-pandemic QE expansion and high inflation, the Fed restarted QT in 2022 and ramped the cap to USD 95bn per month (USD 60bn Treasuries + USD 35bn MBS). On 29 October 2025 the Fed announced that securities runoff would conclude on 1 December 2025, formally ending the second QT cycle. Cumulative reduction since June 2022 exceeded USD 2.2 trillion (about USD 1.6tn in Treasuries and USD 0.6tn in MBS) — roughly half of the pandemic-era expansion. After QT ended, the Fed began reinvesting maturing MBS principal into short-term Treasury bills (T-bills) to keep bank reserves at an ample level.
As QT progressed, the US dollar index (USDX) rallied strongly, both equities and bonds came under pressure, and the correction pressure on high-valuation names like NAS100 has persisted.
QT at the European Central Bank
The ECB began effective balance-sheet contraction in 2023, winding down the large-scale asset purchases launched during the pandemic.
QT (2023 onwards)
The ECB moved its APP portfolio to passive runoff in March 2023 and fully halted APP reinvestments in July 2023; PEPP reinvestments ended in December 2024, so both APP and PEPP are now in passive runoff. The ECB expects roughly EUR 500 billion of securities to mature without reinvestment in 2026 and has said that ending QT "is not on the agenda," signalling a steady runoff pace.
Over this QT phase, euro area inflation has eased somewhat but remains above the ECB's 2% target. European bond yields have drifted higher in line with QT, while STOXX 50 and the euro have stayed in range-bound consolidation.
Japan's Cautious QT
The Bank of Japan has normalised more slowly than other major central banks given Japan's long history of deflation, but it has been in a genuine balance-sheet contraction phase since 2024.
YCC Exit and Purchase Tapering (2024 onwards)
The BoJ abolished Yield Curve Control (YCC) and exited negative rates in March 2024, then raised its policy rate in steps to 0.5% by 2025. It also began a JGB purchase-tapering plan from mid-2024 — widely viewed as "de facto QT" — trimming purchases each quarter (the pace eases from about JPY 400bn to about JPY 200bn per quarter from Q2 2026) toward roughly JPY 2 trillion per month by January–March 2027, by which point long-term JGB holdings will be about 16–17% lower than in June 2024. Nikkei 225 has stayed volatile and the Japanese yen has moved two-way in line with global capital flows and rate differentials.
QT at the Bank of England
Among major central banks, the BoE was the first to move into active asset sales as part of post-pandemic normalisation.
QT (November 2022 onwards)
The BoE formally launched QT in late 2022 and became the first G7 central bank to actively sell government bonds, going beyond runoff to dispose of gilt holdings on a scheduled basis. More recently the BoE has slowed its QT pace, planning to cut gilt holdings by about GBP 70 billion from October 2025 to September 2026 (of which roughly GBP 21 billion via active sales), with Bank Rate held at 4%.
UK gilt yields lifted, FTSE 100 traded in a range, and GBP/USD swung with the broader US dollar backdrop.
5. Side-Effects and Challenges of QT
QT plays an important role in stabilising inflation and normalising policy, but its implementation comes with risks and side-effects that require careful calibration.
Recession Risk
QT tends to lift funding costs, raising the financing pressure on companies and softening consumption and investment. When demand cools at the same time, growth can slow materially.
The first US QT in 2018 is a case in point — by the back half of the runoff growth was visibly losing momentum, and concerns about a "hard landing" started to surface.
Wider Market Volatility
Tighter funding directly hits liquidity in equities and bonds, and price-action volatility expands.
High-valuation growth-stock baskets (such as NAS100) tend to be especially sensitive to QT, and the fear gauge — VIX — also tends to climb during QT, reflecting higher demand for hedges.
Liquidity Stress
By shrinking the total stock of cash in markets, QT lowers banks' usable reserves and narrows the runway for credit expansion. Small businesses and high-leverage sectors take the biggest hit. If the funding squeeze spills into the real economy, corporate cash-flow stress and default risk can rise.
Emerging-Market Pressure
QT often coincides with a stronger US dollar, which raises financial pressure on emerging markets that depend on USD-denominated debt.
When weaker currencies and capital outflows hit, FX reserves can drain quickly, exposing some economies to risks of financial stress or default. Past QT episodes have seen specific emerging markets struggle with dollar strength and outflows.
The Balance-of-Policy Problem
QT must walk a line between cooling inflation and protecting growth. Move too fast and markets can sell off in a panic; move too slowly and inflation and asset bubbles stay loose.
In late 2018, the combination of ongoing QT and rate hikes contributed to a sharp risk-asset sell-off, prompting the Fed to recalibrate the pace of QT in 2019. The phrase "taper tantrum" itself refers to a different episode — the 2013 market reaction when Chair Bernanke signalled that the Fed would begin tapering QE asset purchases — and should not be conflated with the 2018 QT-related stress.
6. How QT Compares to Other Tools
Rate hikes, Quantitative Easing (QE), and Quantitative Tightening (QT) are all key central-bank tools for managing the economy and prices. They differ in mechanism, goal, and market impact, and tend to be combined depending on the cycle. The table below sets out the headline purpose, when each tool is typically deployed, and the main risks each one carries.
Tool-by-Tool Comparison
| Policy Tool | Core Goal | When Used | Main Risk |
|---|---|---|---|
| Rate Hikes | Slow consumption and investment to cool inflation | Inflation starts to lift | Higher funding costs, slower growth |
| QE | Provide liquidity, stimulate credit and recovery | Crises, deflation, zero-rate regimes | Asset bubbles, inflation, wealth distribution effects |
| QT | Withdraw liquidity, restrain bubbles and inflation | Excess-liquidity phase after QE, high inflation | Sharp market moves, rising recession risk |
7. Frequently Asked Questions
Q1. What is the difference between QE and QT?
QE increases the money supply to stimulate the economy, while QT reduces liquidity to control inflation. QE tends to lift asset prices; QT can compress equity and bond valuations. They are opposite-direction tools, but both belong to the toolkit central banks use to manage liquidity and inflation.
Q2. Is balance-sheet reduction the same as QT?
Balance-sheet reduction is one of the core ways QT is implemented. When a central bank lets maturing assets such as Treasuries and MBS run off without reinvestment — or sells holdings directly — the balance sheet shrinks step by step. QT therefore can be understood as the policy package that uses balance-sheet runoff and asset sales together to withdraw market liquidity.
Q3. How does QT affect investors?
QT means liquidity is being gradually pulled out of markets, which tends to weigh on high-valuation growth assets — technology indices like NAS100 in particular. Rising rates also push bond yields up, drawing capital into fixed income; allocations to cash, short-dated debt, and defensive assets tend to rise. Investors can use Titan FX to access indices, FX, and multi-asset opportunities for short and medium-term trades.
We recommend pairing your view with these Titan FX tools:
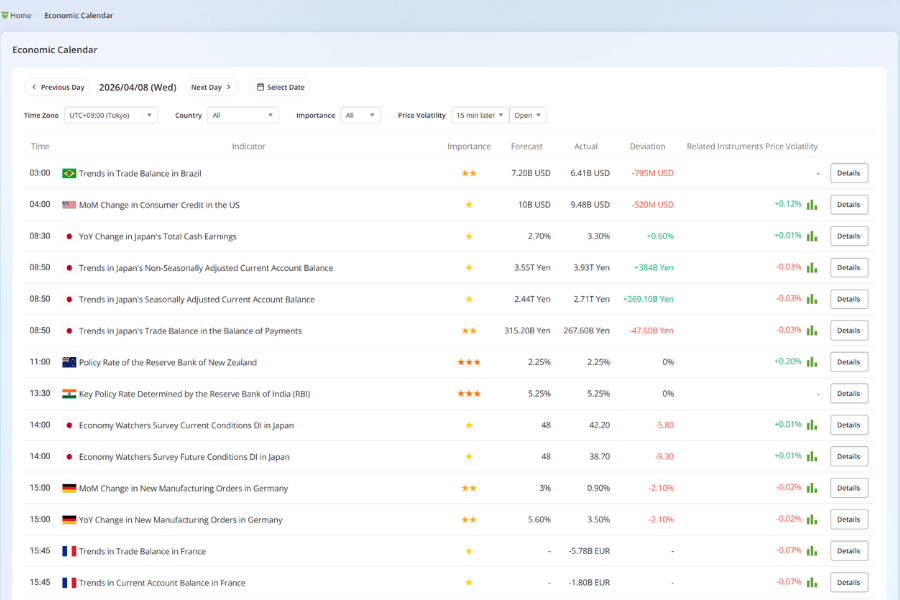
Real-Time Economic Calendar
Real-time economic calendar: stay on top of major global releases.
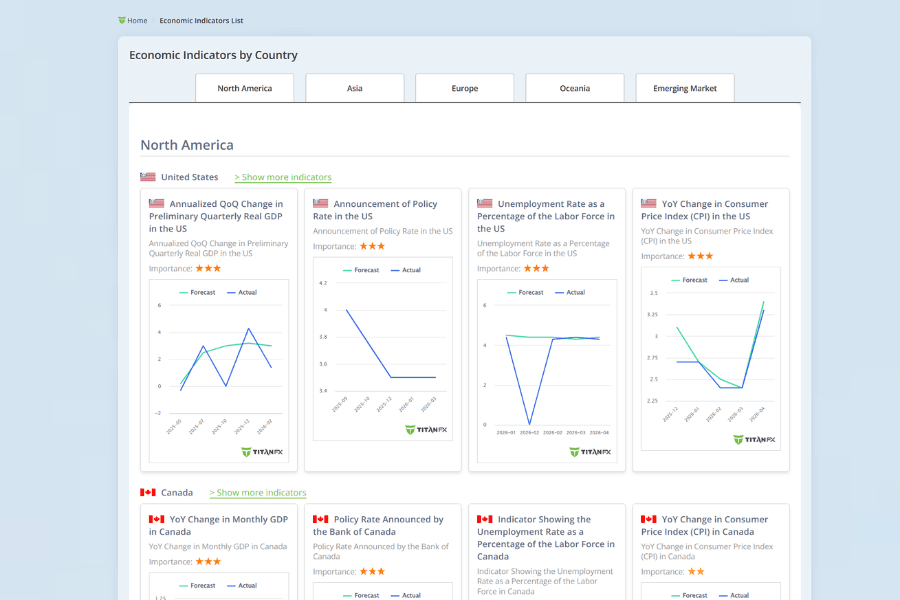
Country-by-Country Indicators
Country indicators dashboard: track shifts in PMI, GDP, and other key data.
Q4. Can QT trigger a financial crisis?
Pushed too aggressively, QT can spark a sharp liquidity squeeze, big swings in asset prices, and damage to market confidence. The 2018 US QT episode preceded a notable equity correction. Managed with a careful pace and clear communication, however, QT supports long-term financial-system stability and inflation control.
Q5. How can traders capture opportunities during QT?
Equity Sectors
During QT episodes growth names like NAS100 and the S&P 500 tend to come under pressure. Combining technical analysis — for example RSI and Bollinger Bands — helps frame the rhythm of short-term corrections and bounces.
FX
QT usually comes with a stronger US dollar, making the medium-term direction of pairs such as USD/JPY and EUR/USD easier to read.
Rate-Sensitive Instruments
Rate-sensitive assets (short-dated bonds, higher-coupon notes) can offer allocation value during QT, and CFDs provide a flexible way to express arbitrage and hedging ideas.
8. Summary
Quantitative Tightening (QT) is one of the central counter-cyclical tools of modern monetary policy, and it has become a core lever that global central banks use to manage inflation and to correct the excess liquidity built up under QE. By shrinking the balance sheet and withdrawing funding, QT restrains asset bubbles, supports market confidence, and preserves room for response in the next crisis.
QT also brings higher market volatility and growth-cooling pressure, with outsized impact on technology stocks, real estate, high-leverage companies, and emerging-market capital flows. In a QT cycle, investors benefit from tighter risk management and from blending short- and medium-term strategies, technical analysis, and a diversified multi-asset mix — using Titan FX's FX, indices, bond, and CFD instruments to capture the opportunities and hedge the risks that come with market resets and volatility.
Further Reading
- What Is Quantitative Easing (QE)?
- What Is Monetary Policy?
- What Is Inflation?
- What Is CPI?
- What Is the Federal Reserve (Fed)?
- Forex Trading Basics
- What Is Leverage?
Titan FX Research. Investor-education content covering forex (FX), commodities (oil, precious metals, agricultural products), stock indices, US equities, and crypto assets across global markets.
Primary Sources by Category
- Central-bank materials: Federal Reserve H.4.1 weekly balance-sheet release, FOMC Statements, Implementation Notes (federalreserve.gov); ECB Monetary Policy Decisions, APP/PEPP releases; Bank of England Quarterly Bulletin; Bank of Japan Outlook Report
- Policy history and timelines: Fed Balance Sheet plans (the 2017–2019 first round and the 2022–2025 second round); ECB APP reinvestment-halt announcement (July 2023); Bank of England active-sales programme announcement (November 2022)
- Market analysis: BIS Annual Economic Report; CME FedWatch; Bloomberg / Reuters QT commentary
- Academic background: Bernanke, B. (2020) "The New Tools of Monetary Policy"; Smith & Valcarcel (2023) "The Financial Market Effects of Unwinding the Federal Reserve's Balance Sheet"