What Is the Nikkei 225 (JPN225)? Components & Trading Guide
When people think of "trading Japanese stocks," the first thing that comes to mind is usually the Nikkei average (Nikkei 225) familiar from the news. The moves of Japan’s flagship companies — Toyota, Sony, Tokyo Electron — are distilled into this single number.
For CFD traders, JPN225 offers compelling opportunities thanks to its high volatility and tight correlation with the Japanese yen. Whether you're trading trend moves driven by Bank of Japan (BOJ) policy shifts or capturing short-term swings around the Tankan survey and GDP data releases, JPN225 is one of the most important Asian index trading instruments. This article covers the index composition, price drivers, and practical trading strategies for JPN225.
- What JPN225 is: Japan’s key index of 225 leading TSE Prime companies
- Price-weighted: Higher-priced stocks dominate (Fast Retailing, Tokyo Electron)
- vs TOPIX: JPN225 is high-volatility/short-term; TOPIX is broad/long-term
- Key drivers: BOJ policy, USD/JPY, the chip cycle, global markets
- Trading: Trade the JPN225 CFD on Titan FX, long or short
- 1. What Is the Nikkei 225 Index (JPN225)?
- 2. Top Constituents and Sector Breakdown
- 3. JPN225 vs TOPIX: Comparing Japan's Two Major Indices
- 4. Price History: 2020-2026 in Review
- 5. Key Factors That Move Prices
- 6. Advantages and Risks of Trading
- 7. Trading Strategies
- 8. How to Trade Nikkei 225 on Titan FX
- 9. Key Considerations for New Traders
- 10. Top Constituents by Index Impact
- 11. How the Price-Weighted Average is Calculated
- 12. Typical Price Action After Major Events
- 13. Real-Time Chart and Trading Conditions
- 14. Frequently Asked Questions
What Is the Nikkei 225 Index (JPN225)?
The Nikkei 225 Stock Average was first calculated in 1950 and is compiled by Nikkei Inc. (The Nihon Keizai Shimbun). It is a price-weighted index that tracks 225 representative companies listed on the Tokyo Stock Exchange (TSE) Prime Market. As Japan's oldest and most influential stock index, the Nikkei 225 is widely regarded as the barometer of the Japanese economy.
| Item | Details |
|---|---|
| Official Name | Nikkei 225 Stock Average |
| Trading Symbol | JPN225 (CFD) / NKY (Cash Index) |
| Year Established | 1950 (retroactively calculated to May 16, 1949) |
| Number of Constituents | 225 companies |
| Weighting Method | Price-Weighted |
| Compiler | Nikkei Inc. |
| Benchmark ETF | Nikkei 225 ETF (1321.T), iShares Nikkei 225 ETF |
| Rebalancing | Annual review in October, with ad-hoc replacements as needed |
How JPN225 Is Calculated
JPN225 uses a price-weighted methodology, calculated by dividing the sum of all constituent stock prices by a divisor:
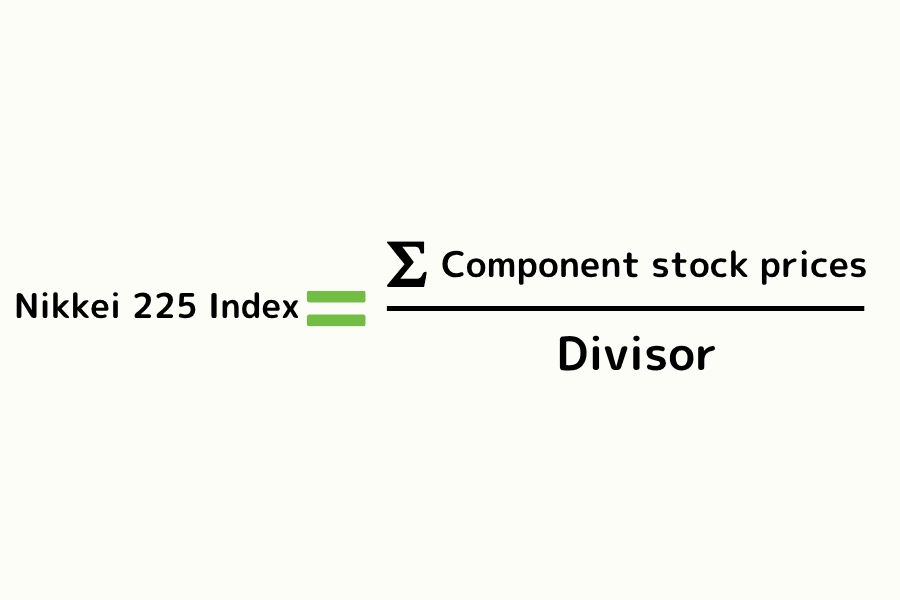
The divisor is adjusted whenever constituent changes, stock splits, or other corporate actions occur to maintain index continuity. Price weighting means that higher-priced stocks have a greater impact on the index, regardless of a company's market capitalization. For example, Fast Retailing and Tokyo Electron are not Japan's largest companies by market cap, but their high share prices give them far more influence over the Nikkei 225 than market-cap giants like Toyota.
This contrasts sharply with the market-cap-weighted methodology used by the S&P 500 (US500) and Nasdaq 100 (NAS100), and is one of the Nikkei 225's defining characteristics.
Top Constituents and Sector Breakdown
The top ten JPN225 constituents are dominated by high-priced stocks and have an outsized impact on index movements. Below is an overview of the major holdings:
| Rank | Company | Code | Sector | Index Impact |
|---|---|---|---|---|
| 1 | Fast Retailing (UNIQLO parent) | 9983 | Retail | Very High (largest weight due to price weighting) |
| 2 | Tokyo Electron | 8035 | Semiconductor Equipment | Very High |
| 3 | Advantest | 6857 | Semiconductor Test Equipment | High |
| 4 | SoftBank Group | 9984 | Investment / Technology | High |
| 5 | KDDI | 9433 | Telecommunications | Medium-High |
| 6 | Shin-Etsu Chemical | 4063 | Chemicals / Semiconductor Materials | Medium-High |
| 7 | Daikin Industries | 6367 | Machinery / HVAC | Medium |
| 8 | TDK | 6762 | Electronic Components | Medium |
| 9 | Fanuc | 6954 | Industrial Robotics / Factory Automation | Medium |
| 10 | Recruit Holdings | 6098 | HR Services / Technology | Medium |
Due to price weighting, Fast Retailing and Tokyo Electron often dominate intraday index movements. Even though Toyota Motor (7203) is Japan's largest company by market capitalization, its influence on the Nikkei 225 is far less than the high-priced stocks listed above.
Sector Breakdown

| Sector | Weight (approx.) | Key Companies |
|---|---|---|
| Technology (Electronics / Precision) | ~25% | Tokyo Electron, Advantest, Canon, Keyence |
| Consumer (Retail / Services) | ~15% | Fast Retailing, Recruit, Oriental Land |
| Machinery / Capital Goods | ~12% | Daikin Industries, Fanuc, Komatsu |
| Pharmaceuticals / Healthcare | ~10% | Daiichi Sankyo, Chugai Pharmaceutical, Takeda |
| Financials | ~10% | Mitsubishi UFJ, Sumitomo Mitsui, Nomura |
| Telecommunications | ~8% | SoftBank Group, KDDI, NTT |
| Automotive / Transportation | ~8% | Toyota, Honda, Nissan |
| Chemicals / Materials | ~7% | Shin-Etsu Chemical, Kao |
| Other | ~5% | Tokyo Gas, TEPCO |
Unlike NAS100 where tech stocks make up over 50%, the Nikkei 225's sector distribution is relatively balanced. However, semiconductor equipment and electronic component stocks carry disproportionate influence due to their high share prices.
JPN225 vs TOPIX: Comparing Japan's Two Major Indices
When trading Japanese equities, TOPIX (Tokyo Stock Price Index) is another essential index alongside the Nikkei 225. The two differ significantly in methodology and characteristics:
| Comparison | JPN225 (Nikkei 225) | TOPIX |
|---|---|---|
| Constituents | 225 companies | ~2,000 (entire Prime Market) |
| Weighting | Price-weighted | Free-float market-cap weighted |
| Compiler | Nikkei Inc. | Tokyo Stock Exchange |
| Key Feature | High-priced stocks dominate | Better reflects overall market |
| Sector Bias | Technology / Retail (driven by high-priced stocks) | Banks / Auto (large market-cap sectors) |
| Volatility | Higher | Lower |
| Trading Style | Short-term / Swing trading | Medium-to-long-term trend following |
| Titan FX Symbol | JPN225 | TOPIX |
In short, the Nikkei 225's price weighting makes it more susceptible to movements in a handful of high-priced stocks, resulting in higher volatility that suits active traders. TOPIX, with its broader coverage and market-cap weighting, better reflects overall Japanese stock market performance.
Price History: 2020-2026 in Review
The Nikkei 225 experienced historic breakthroughs and sharp volatility over the past six years, rallying from the pandemic lows to surpass its bubble-era all-time high for the first time in over three decades.
2020: Rapid Recovery After the Pandemic Crash (+16%)
The Nikkei 225 plunged to around 16,500 in March 2020 during the initial COVID-19 shock. Supported by the BOJ's massive ETF purchases and global monetary easing, the index steadily recovered to close above 27,000 by year-end, finishing up approximately 16%.
2021: Reclaiming 30-Year Highs (+5%)
The Nikkei 225 broke above the 30,000 milestone early in the year for the first time since the 1990 bubble burst. However, the Delta variant wave and supply chain disruptions caused a mid-year pullback, and the index ended the year with a modest gain of about 5%.
2022: Consolidation During Global Rate Hikes (-9%)
While major central banks worldwide embarked on aggressive rate hike cycles, the BOJ maintained its ultra-loose monetary policy, causing the yen to weaken sharply to 150 per dollar. Yen weakness boosted export earnings but also increased import cost pressures. The Nikkei 225 fell about 9% for the year -- substantially less than major European and U.S. indices.
2023: Strong Rally Driven by Foreign Capital Inflows (+28%)
Warren Buffett's increased stakes in Japan's five major trading companies served as a catalyst, triggering massive foreign capital inflows into Japanese equities. The Tokyo Stock Exchange's corporate governance reforms (requiring companies with low price-to-book ratios to submit improvement plans) further boosted market confidence. The Nikkei 225 surged approximately 28%, breaking through 33,000.
2024: All-Time Highs and Extreme Volatility (+19%)
The Nikkei 225 surpassed its 1989 bubble-era all-time high of 38,915 in February 2024, subsequently climbing above 40,000. The BOJ's unexpected rate hike in July triggered a global carry trade unwind, and the Nikkei 225 plunged over 4,000 points (~12%) in a single day in early August -- the largest single-day point drop in history. However, the market recovered rapidly, finishing the year up approximately 19%.
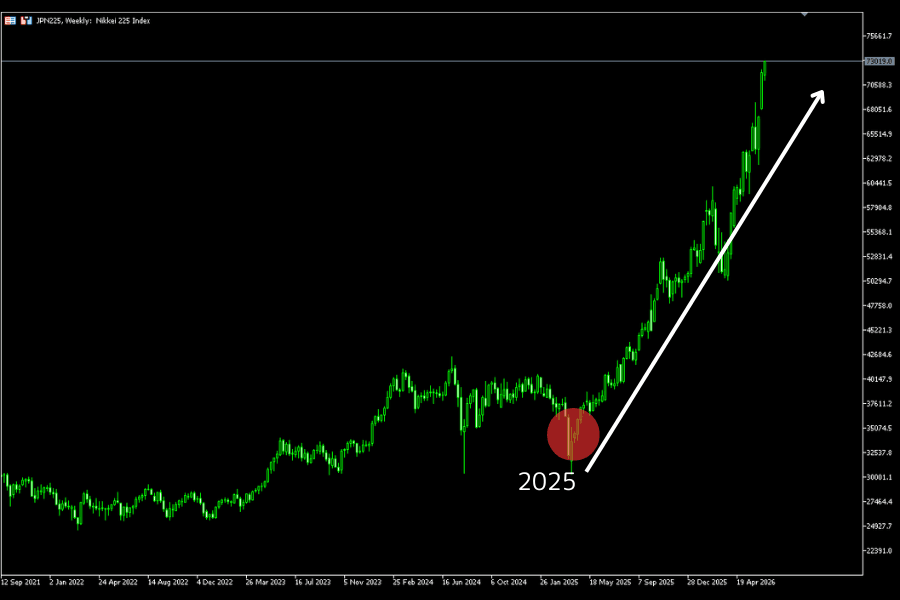
2025–2026: New Record Highs (above 72,000)
In the first half of 2025, uncertainty over U.S. trade policy capped the index, and the Nikkei 225 churned in a 37,000–40,000 range. From the second half, however, the rally accelerated on the back of corporate-governance reform, strong earnings, and a weaker yen. By 2026 the index had blown past its previous record, climbing to above 72,000 as the chart above shows. After such a steep advance, swings at these highs tend to be sharp, so keep a close eye on BOJ policy normalization and the yen.
Key Factors That Move Prices
Bank of Japan (BOJ) Monetary Policy
The BOJ Monetary Policy Meeting decisions are the single most important factor affecting the Nikkei 225. After decades of ultra-low rates and quantitative easing, any policy adjustment from the central bank has profound market implications.
- BOJ Rate Decision and Statement: Rate hike expectations typically strengthen the yen and pressure stocks; maintaining easing supports the Nikkei 225
- BOJ Outlook Report: Changes to the bank's economic and inflation forecasts often signal policy direction
- BOJ Governor Press Conference: Hawkish or dovish shifts in tone directly influence market expectations
The unexpected rate hike in July 2024 that triggered a 4,000+ point single-day crash vividly demonstrated the BOJ's outsized impact on Japanese equities.
Yen Exchange Rate (USD/JPY)
The Nikkei 225 has a pronounced positive correlation with USD/JPY. A weaker yen (rising USD/JPY) typically benefits the Nikkei 225 because:
- Japanese exporters' overseas revenues increase when converted back to yen
- Foreign investors find Japanese stocks cheaper in dollar terms
- Import-driven inflation boosts nominal corporate revenues
Conversely, a sharp yen appreciation often accompanies a rapid Nikkei 225 pullback. Monitoring USD/JPY alongside JPN225 is fundamental for traders.
Japanese Economic Indicators
Key domestic economic data to track closely:
- GDP Growth Rate: Overall growth trajectory of the Japanese economy
- CPI (Consumer Price Index): Inflation data directly influences the BOJ's policy decisions
- Tankan Survey (Large Manufacturing DI): Published quarterly, this is considered the most authoritative gauge of Japanese business sentiment
- Unemployment Rate: An indicator of labor market health
- Industrial Production: Reflects the strength of manufacturing activity
Global Market Linkages
The Nikkei 225 maintains strong correlations with global markets:
- U.S. Stock Performance: Overnight moves in the Dow Jones (US30) and NAS100 often set the direction for the Nikkei 225's opening
- Chinese Economic Data: China is Japan's largest trading partner, and Chinese economic slowdowns or stimulus measures directly affect Japanese exporters
- Semiconductor Cycle: Semiconductor equipment makers like Tokyo Electron and Advantest are core Nikkei 225 weight stocks, making the index highly sensitive to global chip demand fluctuations
Geopolitics and Trade Policy
- U.S.-China tech competition and tariff policies targeting Japan directly impact the semiconductor and automotive industries
- Regional factors such as Japan-China relations and Korean peninsula geopolitical risks can trigger short-term volatility
- Changes in Japan's trade balance affect the yen exchange rate, indirectly impacting the Nikkei 225
Use Titan FX's Economic Calendar to track all major economic data releases and market expectations in real time.
Advantages and Risks of Trading
Advantages
-
Direct Exposure to Asia's Largest Developed Market: Japan is the world's fourth-largest economy, and the Nikkei 225 provides an efficient channel to participate in Japan's manufacturing, technology, and financial sectors
-
Yen Correlation Creates Hedging Opportunities: The Nikkei 225's inverse correlation with the yen allows traders to construct hedging strategies by simultaneously trading JPN225 and USD/JPY
-
Corporate Governance Reform Tailwinds: Tokyo Stock Exchange reforms (improving shareholder returns, unwinding cross-shareholdings) are continuously unlocking latent corporate value
-
Deep Liquidity: Nikkei 225 futures and CFDs see substantial daily trading volumes with tight spreads, enabling smooth execution
-
Time Zone Diversification: Japan's trading session has limited overlap with European and U.S. markets, offering additional opportunities for traders in different time zones
Risks
-
BOJ Policy Risk: Unexpected BOJ policy changes can trigger extreme volatility -- the August 2024 crash being a prime example
-
Yen Volatility: A rapid yen appreciation can sharply depress the Nikkei 225 in a short timeframe, creating dual risk for unhedged traders
-
Price-Weighting Concentration Risk: A small number of high-priced stocks have an outsized impact on the index; negative news from a single company can drag down the entire index
-
Demographic Challenges: Japan faces significant aging and population decline, which may constrain long-term economic growth potential
-
Global Trade Risk: Japan's economy is highly export-dependent, making the Nikkei 225 particularly vulnerable when global trade tensions escalate
Trading Strategies
Institutional Positioning (CFTC)
The CFTC Commitments of Traders (COT) report published weekly tracks the long and short positions of large speculative institutions in Nikkei 225 futures.
- When institutional net longs are steadily increasing, it signals optimism about the medium-term outlook for Japanese stocks, raising the probability of trend continuation
- When net longs begin declining from extreme highs, it may signal an impending trend reversal or correction
- Combining COT data with yen exchange rate movements provides a more accurate picture of capital flows
COT data is published every Friday (reflecting positions as of Tuesday) and is best used as a weekly-level directional reference rather than for intraday trade timing.
Technical Analysis Tools (Titan FX Tools)
Titan FX provides a range of tools to help traders analyze JPN225's technical setup:
- Support & Resistance: Identify key JPN225 price levels and assess breakout or reversal potential
- Order Book (Position Information): View other traders' pending order distribution and long/short ratios
- Trend Analysis: Determine whether JPN225 is in an uptrend, downtrend, or range
- RSI Analysis: Identify overbought or oversold conditions to aid reversal timing
- Volatility Heatmap: Understand JPN225's volatility patterns across different trading sessions
- Percentage Change Ranking: Compare JPN225's real-time performance against other indices
Trading Approaches: Trend, Yen Correlation, Event-Driven
Trend Trading
When the BOJ's policy direction is clear (maintaining easing or starting a rate hike cycle), the Nikkei 225 tends to form medium-term trends lasting weeks to months. Use daily or 4-hour moving averages to confirm direction, and enter on pullbacks to key support levels or moving average zones. The 2023 rally driven by foreign investor buying is a textbook example.
Yen Correlation Trading
Monitor USD/JPY closely. When the yen is in a sustained weakening trend (USD/JPY rising), combine with JPN225 technical confirmation for trend-following long entries. When the yen is appreciating rapidly, be cautious of sharp Nikkei 225 pullbacks. The correlation between the yen and the Nikkei 225 is particularly strong around BOJ policy meetings.
Event-Driven Trading
BOJ rate decisions, Tankan surveys, U.S. CPI data, and FOMC decisions can all trigger significant JPN225 volatility. When trading around these events, position sizing is critical -- consider reducing to half or less of your standard size and using wider stop-loss distances.
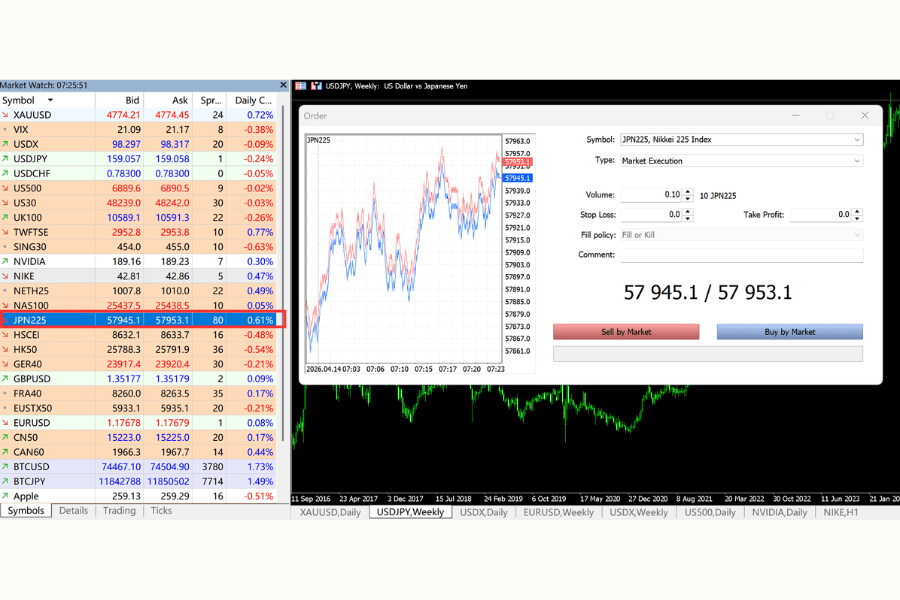
How to Trade Nikkei 225 on Titan FX
On the Titan FX platform, the Nikkei 225 index is available under the symbol JPN225, traded as a CFD. You can also trade via WebTrader directly in your browser.
Step 1: Log In to Your Trading Account
Open a Titan FX trading account (Zero Standard or Zero Blade), complete your deposit, then download MT4 or MT5 and log in with your credentials.
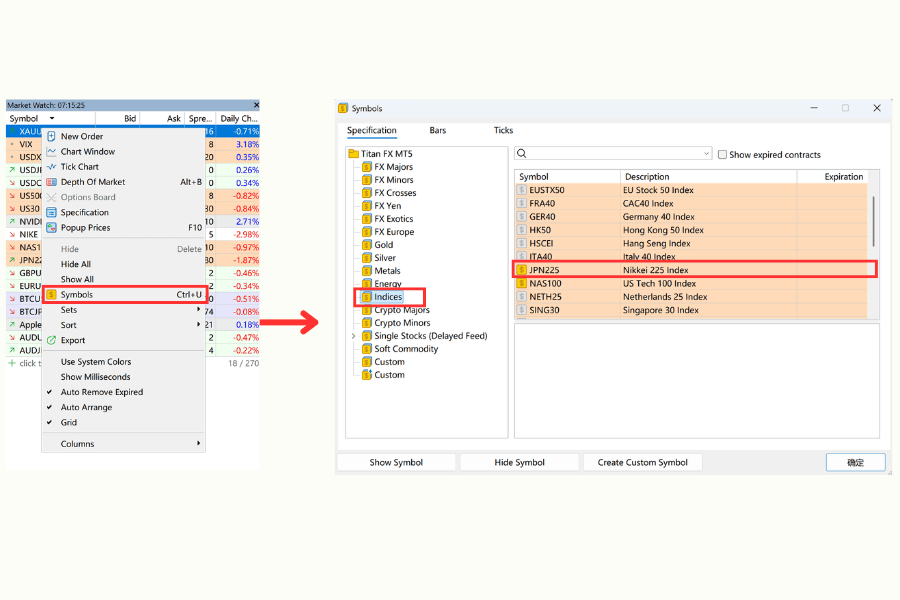
Step 2: Add JPN225 to Market Watch
Right-click in the Market Watch window, select "Symbols," expand the "Indices" category, find JPN225, and double-click to add it to your watchlist.
Step 3: Place Your Trade
Double-click the JPN225 quote or open a chart to access the order window. Enter your lot size (minimum 0.1 lot), choose buy or sell, set your stop-loss and take-profit levels, and execute the trade.
Trading Hours (MT4/MT5 Server Time GMT+3):
| Session | Winter Time (GMT+2) | Summer Time (GMT+3) |
|---|---|---|
| Main Trading Session | 01:00 - 23:59 | 01:00 - 23:15 & 23:30 - 23:59 |
| Friday Close | 23:55 | 23:55 |
For the latest trading conditions and spreads, please refer to the official page.
Start Trading the JPN225 Index Trade JPN225 CFDs with Titan FX -- up to 500x leverage, tight spreads, and the flexibility to go long or short. Index CFDs are available on Zero Standard and Zero Blade accounts (not supported on Zero Micro).
Key Considerations for New Traders
Leverage and Risk Management
Titan FX offers up to 500x leverage on Zero Standard and Zero Blade accounts. Given JPN225's significant daily price swings, risk management is paramount when trading with high leverage:
- Limit risk per trade to 1-2% of account equity
- Given JPN225's volatility characteristics, avoid setting stop-losses too tight to prevent getting stopped out within normal price fluctuations
- Use Titan FX's Margin Calculator to determine required margin and appropriate position sizes
The Price-Weighting Distinction
Unlike market-cap-weighted indices, the Nikkei 225's movements may diverge from the broader Japanese economy's performance. If a few high-priced stocks swing sharply due to sector-specific factors, the index may move in a direction inconsistent with the majority of its constituents. Pay particular attention to Fast Retailing, Tokyo Electron, and other high-weight stocks when trading.
Volatility Around BOJ Meetings
The BOJ Monetary Policy Meeting is held eight times per year and is the most important recurring event for JPN225. Beyond the rate decision itself, the BOJ Governor's press conference tone and adjustments to the outlook report can trigger sharp price moves. The 30 minutes to one hour surrounding the announcement is the highest-volatility window -- less experienced traders may consider stepping aside during this period.
Overnight Gap Risk
The Nikkei 225 can experience gap openings due to global events that occur outside Japanese trading hours, particularly during the U.S. session. Surprise U.S. economic data or unexpected Federal Reserve actions can cause significant gaps at the Nikkei 225's next open. Factor this risk carefully into any overnight positions.
Top Constituents by Index Impact
Because the Nikkei 225 uses a price-weighted methodology, high-priced stocks have an outsized influence on the overall index. The following are the constituents with the largest impact on the index at recent price levels.
| Stock | Price Range | Index Impact |
|---|---|---|
| Fast Retailing | Above JPY 50,000 | 5 stars (most critical) |
| Tokyo Electron | Above JPY 20,000 | 5 stars |
| Advantest | JPY 10,000 range | 4 stars |
| SoftBank Group | JPY 10,000 range | 4 stars |
| Shin-Etsu Chemical | JPY 6,000 range | 3 stars |
| KDDI | JPY 5,000 range | 3 stars |
| Mitsubishi Corporation | JPY 3,000 range | 3 stars |
| Toyota Motor | JPY 3,000 range | 3 stars |
| Nintendo | JPY 10,000 range | 4 stars |
| Recruit Holdings | JPY 9,000 range | 3 stars |
Under a price-weighted methodology, a 10% move in Fast Retailing alone can shift the Nikkei average by more than 200 yen. Unlike the market-cap weighting used by indices such as the S&P 500, what determines impact on the index is not company size but the absolute level of the stock price. This is the defining characteristic of the Nikkei 225.
How the Price-Weighted Average is Calculated
The Nikkei 225 uses a price-weighted methodology, the same approach as the Dow Jones Industrial Average in the US. The calculation is intuitive and simple, but the results differ substantially from market-cap weighting.
Basic formula:
Index = Sum of 225 constituent prices ÷ Divisor
Consider a simplified example with 3 stocks:
- Company A: price of JPY 1,000
- Company B: price of JPY 5,000
- Company C: price of JPY 50,000
Sum = JPY 56,000. If the divisor is 1, the index equals 56,000.
If Company C drops 10% (50,000 → 45,000), the new sum is JPY 51,000 and the index falls to 51,000 (−8.9%).
But if Company A surges 50% (1,000 → 1,500), the new sum is only JPY 56,500 and the index rises to 56,500 (+0.9%).
The influence that a high-priced stock has on the index can exceed that of a low-priced stock by a factor of 50 or more.
In the actual Nikkei 225, the divisor is adjusted whenever there is a stock split or constituent change, so that the continuity of the index is preserved.
Typical Price Action After Major Events
Historical observation reveals clear tendencies in how the Nikkei 225 reacts to specific economic events. The following is a summary of typical responses drawn from multi-year analysis.
| Event | Release Time (JST) | Typical Price Action |
|---|---|---|
| US FOMC Rate Decision | 03:00 next morning (rate-cut expectations often bring yen strength and Nikkei weakness) | Opening gap of ±200–500 yen |
| BOJ Monetary Policy Meeting | Around 12:00 same day | Direction develops between 13:00 and 14:00 |
| US CPI Release | 21:30–22:30 same day | Priced into the next-morning open |
| US Non-Farm Payrolls | First Friday of the month, 21:30 | Reflected in Monday's open |
| Japan GDP Preliminary | Monthly, 08:50 | Limited reaction before open |
The FOMC is by far the most important driver of opening gaps in the Nikkei 225. A chain reaction typically runs through US equities, the USDJPY exchange rate, and then Nikkei CFDs and futures, so the starting level for the Tokyo open is usually set before the cash market opens. Before trading, always check the overnight US event results and the USDJPY move.
Real-Time Chart and Trading Conditions
The latest Nikkei 225 CFD quote, real-time 5-minute, 1-hour and daily candle charts, recent spread history, margin requirements, and swap rates can all be checked on the Titan FX JPN225 product page.
See the latest quote and chart: JPN225 product page
Titan FX also provides the following analytical tools free of charge, useful for JPN225 trading decisions.
- Support & Resistance auto-detection
- Trend Analysis
- Volatility Heatmap (visualizes volatility by time of day)
- Swap Calendar
- Economic Calendar
Frequently Asked Questions
Q1. What's the Difference Between the Nikkei 225 and TOPIX?
| Index | Constituents | Weighting | Key Feature | Volatility | Titan FX Symbol |
|---|---|---|---|---|---|
| JPN225 (Nikkei 225) | 225 | Price-weighted | High-priced stocks dominate | High | JPN225 |
| TOPIX | ~2,000 | Market-cap weighted | Reflects overall market | Medium | TOPIX |
The Nikkei 225 suits traders seeking volatility and short-term opportunities, while TOPIX is better for investors tracking the broad Japanese market trend.
Q2. How Does the Nikkei 225 Correlate with the Yen?
The Nikkei 225 has a relatively strong positive correlation with USD/JPY. A weaker yen (rising USD/JPY) typically benefits the Nikkei 225 as exporters' overseas revenues increase in yen terms, while a stronger yen tends to pressure Japanese equities. However, in risk-off environments (such as geopolitical crises), the yen and Japanese stocks may come under pressure simultaneously, breaking the typical correlation pattern.
Q3. How Can the CFTC COT Report Help with JPN225 Trading?
The COT report publishes weekly data on large speculative institutions' long and short positions in Nikkei 225 futures. When institutional net longs are increasing alongside rising prices, trend continuation is more likely. When positioning reaches extreme levels and begins reversing, it may signal a trend turning point. COT data has inherent lag, making it best suited as a medium-to-long-term reference.
Q4. What Are the JPN225 CFD Trading Hours?
JPN225 CFDs trade nearly around the clock (Monday through Friday), but the main action centers on the Japanese trading session (09:00-15:00 JST) and the overlap with U.S. markets. For detailed trading hours, see the Titan FX Index CFD Trading Conditions page.
Q5. What Technical Indicators Are Useful for JPN225 Trading?
Commonly used indicators include: moving averages (trend direction), RSI (overbought/oversold identification), Bollinger Bands (volatility range measurement), and MACD (momentum confirmation). Titan FX's Trend Analysis and RSI Analysis tools provide real-time technical analysis for JPN225.
Q6. What Costs Are Involved in Trading JPN225?
The main CFD trading costs include the spread (bid-ask difference), overnight swap fees, and potentially commissions. JPN225 spread levels and specific trading conditions are available on the Titan FX website. Overnight positions incur swap charges, which can be checked via the Swap Calendar. Additionally, index CFDs may involve dividend adjustments -- when constituent stocks go ex-dividend, your account receives a corresponding debit or credit.
Summary
The Nikkei 225 is one of Asia's most significant stock indices, bringing together Japan's leading companies across manufacturing, semiconductor equipment, financials, and consumer sectors. Its price-weighted methodology creates higher volatility that offers traders ample opportunities, while demanding close attention to BOJ policy and yen exchange rate dynamics.
Tracking BOJ policy direction, monitoring yen exchange rate movements, using CFTC positioning data for medium-term directional analysis, and applying technical analysis tools for entry and exit timing form the essential framework for trading JPN225.
Use Titan FX's JPN225 real-time quotes and chart page to stay on top of market movements and apply this article's analytical framework to your trading.
Further Reading
Titan FX Trade Strategy Research Lab covers forex (FX), commodities (oil, precious metals, agricultural products), stock indices, U.S. equities, and crypto assets — producing educational content for retail investors across asset classes.
Primary Sources (by Category)
- Index provider: Nikkei Inc. — Nikkei 225
- Exchange: Japan Exchange Group (JPX)