Price-to-Sales Ratio (PSR / P/S)

When hunting for growth stocks, the first tool most US-equity beginners reach for is the price-to-earnings ratio (PER). But when you start analyzing early-stage firms or tech giants whose R&D spending runs deep and profitability is still out, PER frequently turns useless because net income is negative. This is where the Price-to-Sales Ratio (P/S Ratio, PSR) steps in as an indispensable valuation tool. By stepping past the volatile profit line and reading revenue scale and market-expansion speed directly, PSR helps investors spot tomorrow's stars before they are properly priced.
Whether you are analyzing high-growth tech stocks or screening SaaS and startup names, mastering PSR keeps you with a clear valuation compass even when PER has broken down. This guide walks from the calculation method, to comparisons with PER and PBR, to practical growth-stock screening, so you can put this powerful metric to work.
- PSR (P/S Ratio) = Market Cap ÷ Revenue, capturing how much the market pays for each dollar of revenue
- When earnings are negative or volatile, PER breaks down; PSR substitutes revenue, making it the core valuation lens for SaaS, cloud and other high-growth tech names
- Reasonable bands vary widely by sector: SaaS 5–12x, e-commerce 1.5–6x, manufacturing 1–4x, traditional retail 0.5–2.5x
- Always read PSR alongside gross margin, revenue growth and operating cash flow to avoid the "low-PSR but loss-leading revenue" trap
- Combine with PER and PBR to build a full valuation toolbox and sharpen growth-stock judgment
1. What Is PSR (P/S Ratio)? How to Read It and Why It Matters
The Price-to-Sales Ratio (PSR, also written P/S Ratio) is a valuation metric that measures the relationship between a company's share price and its revenue. It tells investors how much the market is willing to pay right now for every dollar of revenue the company generates.
Conceptually, PSR stands on top of "revenue" — the most fundamental operating result — and watches how the market prices the business. Because revenue is typically more stable than net income and less prone to accounting noise, PSR carries high reference value when analyzing growth-oriented companies.
The core significance of this metric is that it reflects the market's expectations for a company's future growth potential. Companies with high growth rates and high-margin models tend to be awarded higher PSR multiples, while companies lacking expansion momentum usually trade at lower multiples.
2. How Is PSR Calculated? Two Simple Formulas
The PSR calculation is simple. There are two main methods, and both produce the same result.
Method 1: Market-Cap Basis
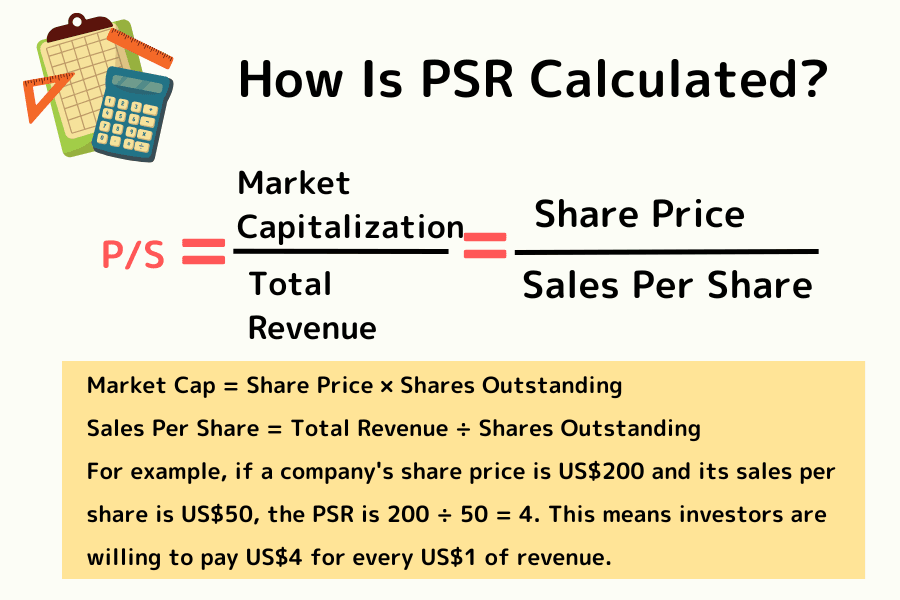
PSR = Market Capitalization ÷ Total Revenue
Where: Market Cap = Share Price × Shares Outstanding
Method 2: Per-Share Basis
PSR = Share Price ÷ Sales Per Share
Where: Sales Per Share = Total Revenue ÷ Shares Outstanding
For example, if a company's share price is US$200 and its sales per share is US$50, the PSR is 200 ÷ 50 = 4. This means investors are willing to pay US$4 for every US$1 of revenue.
This number does not carry an absolute "high / low" judgment on its own — it has to be read in the context of the industry and the company's growth profile. For the calculation, use the trailing twelve months (TTM) revenue, which reflects the company's current operating scale most faithfully.
3. Why PSR Is Essential: P/S vs. P/E vs. P/B
In a complex stock-screening workflow, PSR earns its seat at the table because it covers blind spots that other traditional metrics leave open in specific scenarios.
Angle 1: When PER Breaks Down (a Lifeline for Loss-Making Companies)
Many US high-growth tech stocks pour essentially every dollar of earnings into R&D and market development in their early years, so net income comes out negative. When that happens, PER produces a meaningless negative number and becomes useless for judging whether the share price is reasonable. PSR is unaffected by the profitability question — as long as the company has revenue, it gives you a usable reference.
Angle 2: The Truthfulness and Stability of Revenue
The earnings figure inside PER is easily swayed by accounting adjustments, one-off charges, tax benefits, and depreciation policies, which can cause net income to swing sharply in any single quarter.
Revenue is much harder to manipulate and the data series is typically smoother than net income. That is why PSR often shows better stability than PER during inflection points in the business cycle.
Angle 3: Judging the "Quality" of Assets
In an era dominated by SaaS and internet services, a lot of corporate value comes from brand, data, and algorithms rather than factories and land. These asset-light companies tend to have a very low book value, which causes PBR to shoot unreasonably high and lose reference value.
PSR, by contrast, captures the serious cash-generating power these asset-light companies produce through their software services.
Side-by-Side Comparison of the Three Valuation Metrics
| Dimension | PSR (Price-to-Sales) | PER (Price-to-Earnings) | PBR (Price-to-Book) |
|---|---|---|---|
| Core logic | How much for each $1 of revenue | How much for each $1 of earnings | How much for each $1 of book value |
| Formula | Market Cap ÷ Total Revenue | Market Cap ÷ Net Income | Market Cap ÷ Shareholders' Equity |
| Best-fit scenario | High-growth startups, unprofitable tech | Mature, profitable companies; traditional industries | Financials, real estate, heavy industry |
| Main limitation | No view on costs or debt risk | Breaks down for loss-makers; accounting-sensitive | Ignores value of asset-light or IP-centric businesses |
| Data source | Income statement revenue | Income statement EPS | Balance sheet equity |
4. Practical: Using PSR to Screen US Growth Stocks
Knowing how to calculate PSR is only the start; what matters is turning it into an actionable screening logic. A structured process stops you from making snap judgments off a single number and helps you find companies with real growth potential — or quietly-undervalued names — with more precision.
Step 1: Is the Valuation Reasonable? (The PSR Sweet Spot)
The first step in reading PSR is confirming where the current level sits, not snap-judging whether the number is high or low.
Cross-Sectional Comparison (Same Industry)
Business models, gross margins, and growth characteristics vary dramatically across industries, so the reasonable PSR range differs dramatically too. Applying a single number to every company is a fast track to misreads.
Example: high-margin software companies with operating leverage get paid a premium for every dollar of revenue, while low-margin, highly-competitive traditional industries settle at a much lower level. Below are commonly-seen 2026 PSR ranges by industry (directional only; always combine with company-specific growth judgment).
| Industry Type | Typical PSR Range | Notes |
|---|---|---|
| SaaS / Software Tech | 5-12x (15-30x+ for high-growth) | High margins and high growth. Higher growth, higher multiple. |
| E-commerce / Online Retail | 1.5-6x (higher for fast-growing platforms) | Fast growth but intense competition; margin and profitability matter a lot. |
| Manufacturing | 1-4x | Lower margin; more emphasis on asset efficiency and cash flow. |
| Traditional Retail | 0.5-2.5x | Limited growth; operating efficiency and physical store network matter. |
When comparing to peers, prefer the median of the same industry or companies at a similar growth stage.
Time-Series Comparison (Company History)
Look at the company's PSR over the past 3-5 years. If the current PSR is noticeably below its historical average while revenue growth has not deteriorated, that could signal either weakening market expectations or a real valuation discount worth investigating.
Step 2: Does Revenue Quality Support the Valuation? (Fundamental Validation)
PSR measures how the market prices revenue, but whether that valuation is supportable depends on the quality and durability of revenue. Pair PSR with other metrics for accuracy.
- With gross margin: When PSR runs hot, confirm gross margin stays above the industry average. Stable or rising gross margin signals pricing power and the ability to convert revenue into profit.
- With revenue growth rate: If PSR keeps climbing while revenue growth is decelerating, market expectations may have overshot — watch out for multiple compression. If revenue is accelerating, a richer PSR can be justified.
Practical Screening Checklist
A simple checklist beginners can start with:
- (1) Find companies whose PSR is below the industry median, or below their own historical average.
- (2) Confirm gross margin exceeds the industry average and revenue has grown for three consecutive years.
- (3) Finally, check that operating cash flow is positive - avoid pure cash-burn growth stories.
Applied this way, PSR stops being a pure number and becomes a practical tool for surfacing growth candidates.
5. FAQ: Reading PSR - Traps and Limits
Q1: Does a PSR below 1 always mean a stock is cheap?
Not necessarily. An excessively low PSR can also signal genuine market concerns about the future (loss of product competitiveness, shrinking revenue). A low PSR only becomes meaningful when combined with stable revenue growth; read alone it often leads straight into a value trap.
Q2: What are the main pitfalls in reading PSR?
Pitfall 1: Ignoring the Cost Side
High revenue does not mean the company will actually end up with profit. If a company is buying revenue with heavy discounts or subsidies, PSR looks seductive but the business is effectively burning cash to make noise.
Pitfall 2: Ignoring Debt
PSR only looks at revenue and says nothing about a company's debt structure. A company with high revenue but an unsustainable interest burden is still a shaky credit.
Q3: When should I drop PER entirely in favor of PSR?
When the company is in an early-stage, rapid industry expansion and is explicitly prioritizing market-share capture over short-term profit (cloud computing in its early years is the canonical example), PSR is the more forward-looking metric.
Q4: What does it mean when revenue keeps climbing but PSR keeps falling?
Two opposite readings are possible:
- The stock is getting cheaper (bullish): Revenue is growing faster than the share price, so the "value per dollar paid" is improving - a possible entry point that the market has overlooked.
- Market expectations are cooling (bearish): Revenue is still rising, but the market is pricing in a slowdown or doubts about earnings quality (buying revenue with losses), so it has cut the multiple.
Check gross margin simultaneously: stable margins lean bullish, deteriorating margins warn of coming multiple compression.
6. Summary: Add PSR to Your US-Equity Valuation Toolbox
The Price-to-Sales Ratio is a valuation metric grounded in revenue, particularly well-suited for valuing growth companies that are not yet profitable or whose profit is still unstable.
Key takeaways:
- PSR reflects the market's pricing of revenue
- Best suited to tech stocks and growth stocks
- Must be read alongside gross margin and revenue growth
- Never use alone - risk of misjudgment
PSR cannot fully replace PER, but in certain scenarios it offers a more forward-looking viewpoint.
Combine PSR with other metrics (PER, PBR) and you end up with a more complete, practical valuation toolbox - one that helps you judge corporate value more rationally in every investment decision.
Further Reading
- PER (Price-to-Earnings Ratio, P/E) — Standard valuation metric for profitable, mature companies
- PBR (Price-to-Book Ratio, P/B) — Complementary valuation for asset-heavy industries (financials, real estate)
- Earnings Per Share (EPS) — Core measure of per-share profitability
- Income Statement — Source of revenue, operating income and net income data
- Balance Sheet — Overview of capital structure and asset composition
- Growth Stock — Selection logic and screening framework for high-growth names
The financial markets research team at Titan FX. Produces educational content for investors across a broad range of asset classes, including foreign exchange (FX), commodities (crude oil, precious metals, agricultural products), stock indices, US equities, and cryptocurrencies.
Primary Sources by Category
- Official data and regulators: U.S. SEC EDGAR — Public-company 10-K / 10-Q financial filings; FASB (U.S. GAAP) / IFRS — Accounting standards; NYSE / NASDAQ — Public-market listing rules
- Companies and industry sources: Issuer 10-K / 10-Q reports and IR pages; CFA Institute — Valuation methodology research; S&P Global / FactSet — Sector P/S median data
- Research, media and reference sources: Bloomberg, Reuters, Financial Times, Wall Street Journal; NYU Stern Damodaran Online — Valuation methodology and historical P/S databases; Morningstar — US-equity valuation analysis