

How to Backtest on MT5 (Mac)
This article explains how to backtest an EA with the "Strategy Tester" in MT5 (MetaTrader 5) for Mac.
You can test with fixed parameters, or run an optimization test to find the parameter values that give the best result (this takes longer).
1. MT5 Backtesting Setup
Prepare the EA you want to test and install it on MT5 in advance. Backtest accuracy depends on historical data; if you need a longer data range, see How to Import Historical Data into MT5 (Mac).
Opening the Strategy Tester
Backtesting in MT5 is done with a tool called the "Strategy Tester".
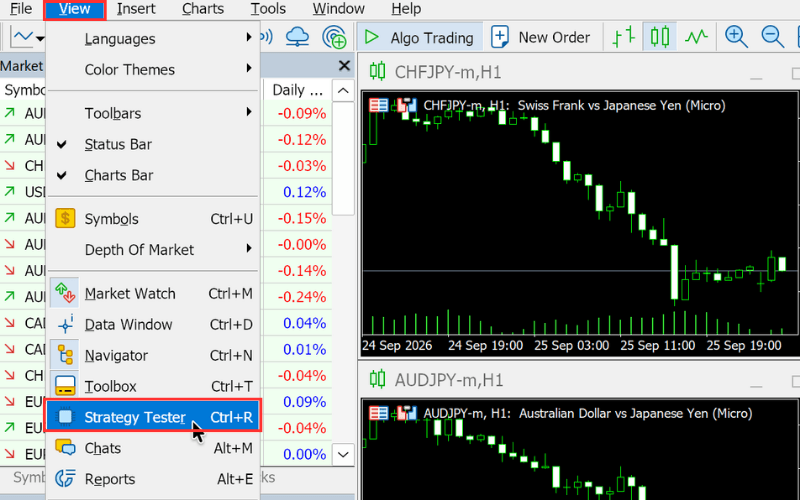
Click "View" in the menu bar and select "Strategy Tester". The Strategy Tester appears at the bottom of the screen (you can also use the shortcut Ctrl+R shown in the menu). For the layout of each window, see MT5 (Mac) Platform Overview.
"Settings" Tab
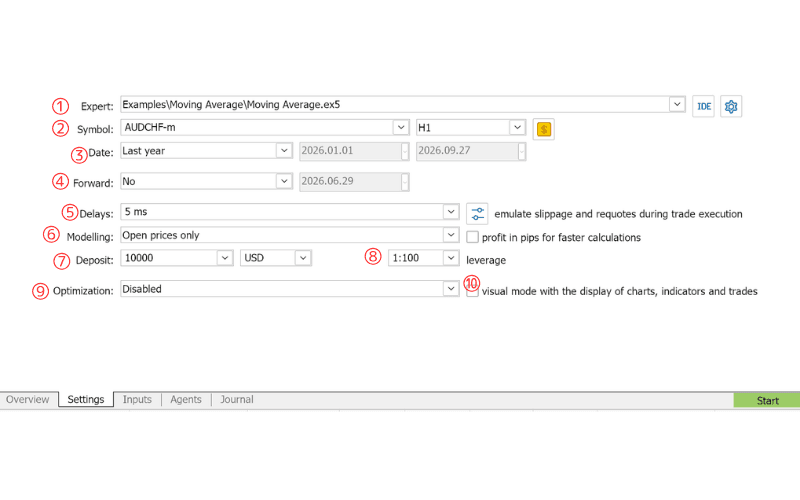
Configure the following items in the "Settings" tab (numbers match the image).
① "Expert": Select the EA to test.
② "Symbol": Select the symbol and chart timeframe to test.
③ "Date": Set the test period. Besides custom dates, you can choose options such as "Last year".
④ "Forward": To run a forward test, set the share of the period used for it. Leave it at "No" if you do not need one.
⑤ "Delays": Set a delay here to simulate the time between placing and filling an order (e.g. "5 ms").
⑥ "Modelling": Select how prices are generated for the test (e.g. "Open prices only").
⑦ "Deposit": Set the starting balance and currency.
⑧ "leverage": Set the leverage.
⑨ "Optimization": Choose whether to optimize and which method to use. "Disabled" means no optimization.
⑩ Without optimization, tick "visual mode with the display of charts, indicators and trades" to watch the trades play out (the test takes longer). With optimization, select the criterion for optimization here.
"Inputs" Tab
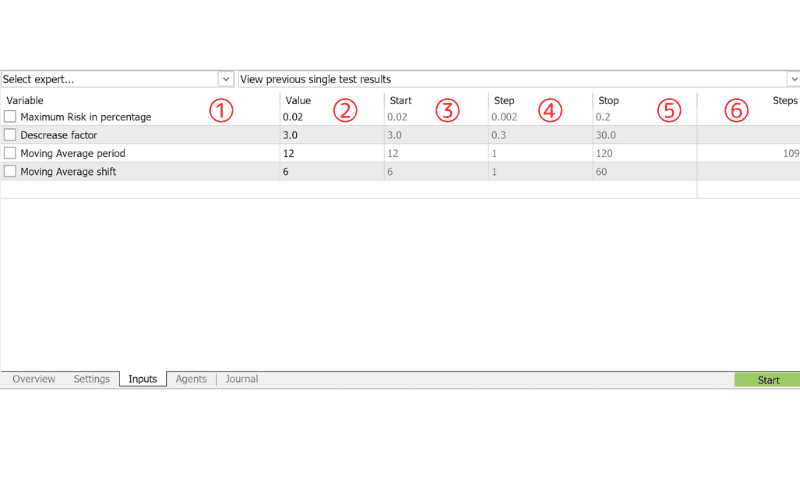
In the "Inputs" tab, set the EA parameters and the ranges used for optimization.
① To optimize a parameter, tick it in the "Variable" column.
② Without optimization, set the parameter in the "Value" column.
③ "Start": the minimum value for optimization.
④ "Step": the increment from the start value.
⑤ "Stop": the maximum value for optimization.
⑥ "Steps": the number of values to be tested.
Starting the Test
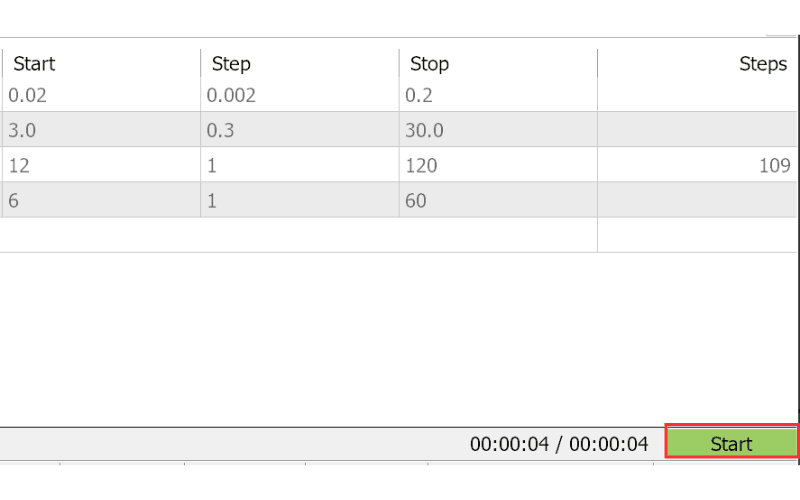
When the settings are complete, click the "Start" button at the bottom right.
A long test period or many optimization combinations increases the calculation load and can take hours or even days. Keep the period and the number of combinations as small as practical.
2. Checking MT5 Backtest Results
When the test finishes, tabs such as "Backtest", "Graph" and "Optimization Results" appear in the Strategy Tester, depending on the test.
"Backtest" Tab: Summary
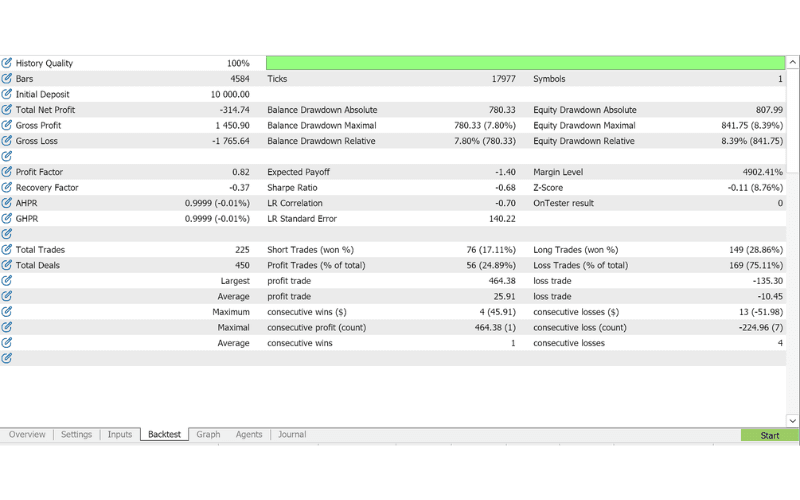
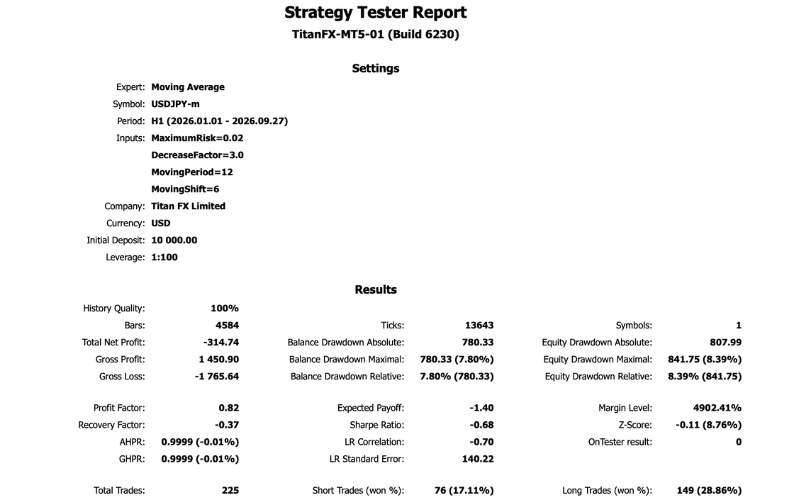
Check the summary, including net profit, drawdown, profit factor and number of trades. See the glossary at the end of this article for each item.
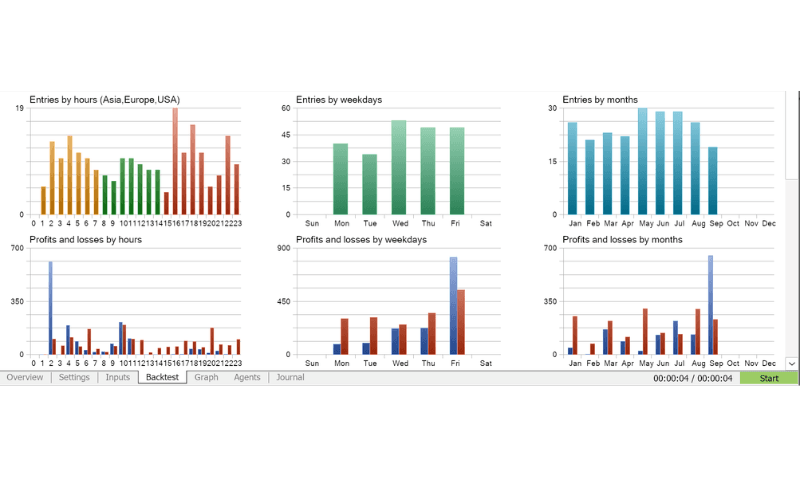
"Backtest" Tab: Entries and P/L by Time
Scroll down to see entries and profits and losses by hours, weekdays and months in bar charts.
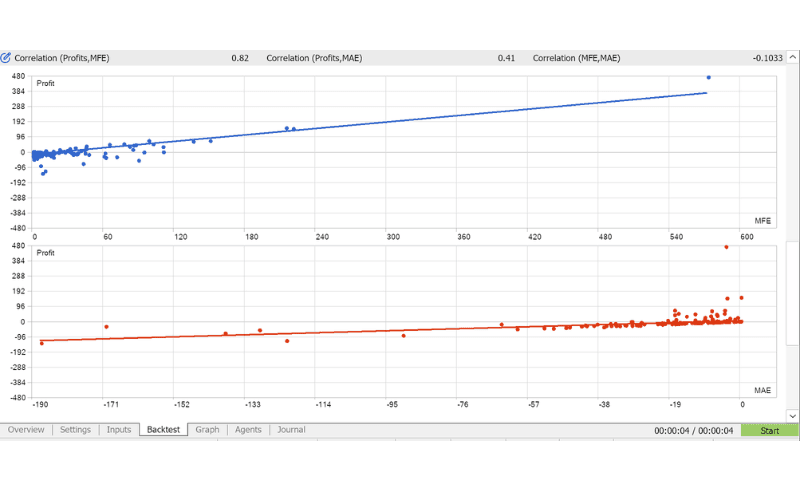
"Backtest" Tab: MFE/MAE Correlation
Scroll further to see the correlation between profit and maximum favorable excursion (MFE) and maximum adverse excursion (MAE).
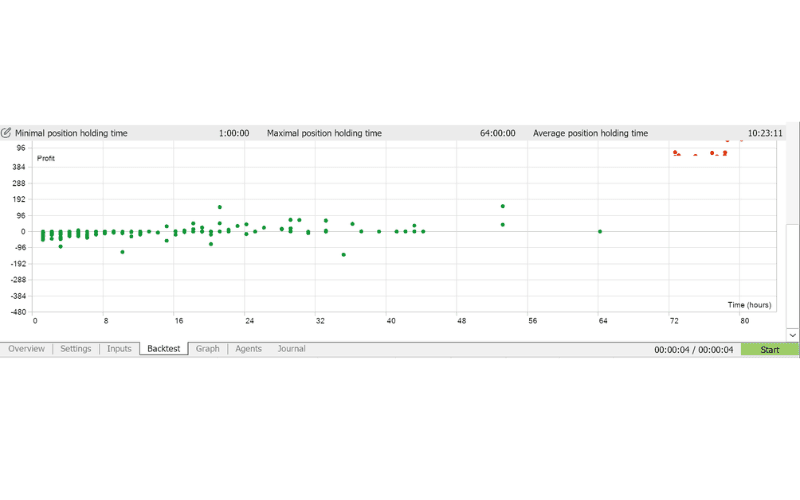
"Backtest" Tab: Position Holding Time
Check the "Minimal position holding time", "Maximal position holding time" and "Average position holding time", and the distribution of holding time against profit.
"Graph" Tab
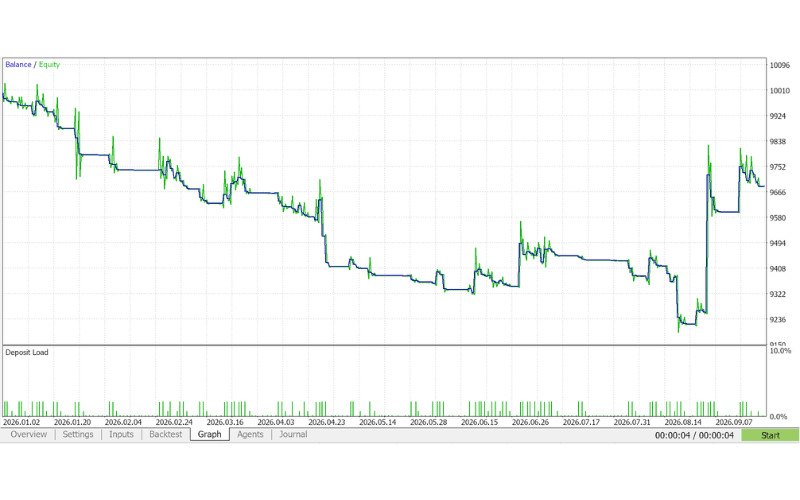
Check how the balance and equity changed. The blue line is "Balance" and the green line is "Equity".
"Optimization Results" Tab
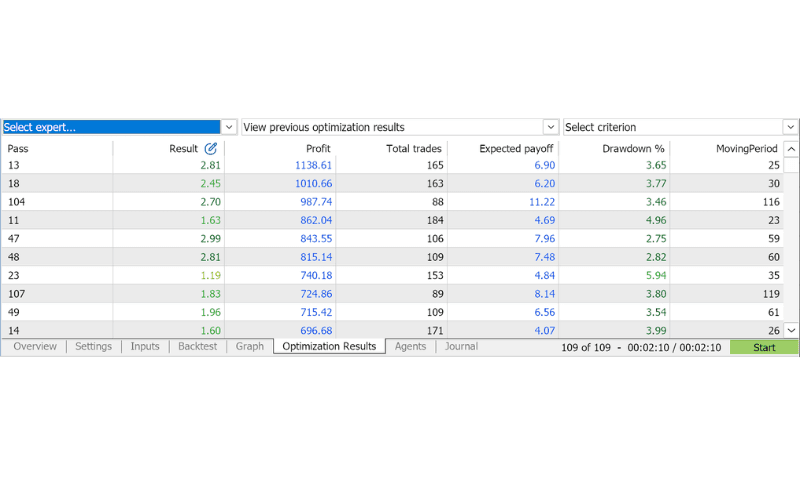
When you run an optimization, the "Optimization Results" tab shows the result for each parameter set. Click a column header to sort by that item.
Saving the Report
Right-click in the "Backtest" tab (on a Mac, Control-click or two-finger click) and choose to save the report. It is saved in HTML format that you can open in a browser. To create a P/L report for your actual trades, see How to Create a Profit and Loss Report on MT5 (Mac).
3. Terms Used in the MT5 Backtest Report
| Term | Meaning |
|---|---|
| History Quality | Quality of the historical data used |
| Bars | Number of bars used |
| Ticks | Number of ticks used |
| Symbols | Number of symbols tested |
| Initial Deposit | Balance at the start of the test |
| Total Net Profit | Total profit and loss |
| Gross Profit | Sum of all profits |
| Gross Loss | Sum of all losses |
| Balance Drawdown Absolute | Largest drop below the initial balance |
| Balance Drawdown Maximal | Largest balance drawdown during the test |
| Balance Drawdown Relative | Largest balance drawdown as a percentage |
| Equity Drawdown Absolute | Largest drop of equity below the initial deposit |
| Equity Drawdown Maximal | Largest equity drawdown during the test |
| Equity Drawdown Relative | Largest equity drawdown as a percentage |
| Profit Factor | Gross profit ÷ gross loss (above 1 means a profit) |
| Expected Payoff | Total net profit ÷ number of trades |
| Margin Level | Lowest margin level during the test |
| Recovery Factor | Total net profit ÷ maximal drawdown |
| Sharpe Ratio | Average P/L per trade ÷ standard deviation of P/L (higher means relatively lower risk) |
| Z-Score | Tendency of wins and losses to run in series (negative: tends to repeat; positive: tends to alternate) |
| AHPR | Arithmetic mean of trades (above 1 is favorable) |
| GHPR | Geometric mean of trades |
| LR Correlation | Correlation of the balance curve with the linear regression line |
| LR Standard Error | Standard error of the balance from the linear regression line |
| OnTester result | Value returned by the EA's OnTester function |
| Total Trades | Number of trades |
| Total Deals | Number of deals |
| Short Trades / Long Trades | Number of sell and buy trades and their win rate |
| Profit Trades / Loss Trades | Number and share of winning and losing trades; the "Largest" and "Average" rows show single-trade values |
| Consecutive wins / losses | Longest winning and losing streaks with their P/L, and the average streak length |