
 Home
- Investment Guide: Strategies for Stocks, Forex, and Metals
- How to Read the COT Report for Forex: Net Positioning
How to Read the COT Report for Forex: Net Positioning and Currency Futures Direction

Forex traders mostly watch the non-commercial group, large speculators such as hedge funds. Their net long or net short positions in yen and euro futures show which way speculative money is leaning, and whether it changed direction this week.
This guide uses Titan FX's IMM Currency Futures Positions and CFTC Commitment of Traders Report Analysis to explain when the COT report is released, how to read the long, short and net figures on the dashboard, how currency futures positions translate into currency pair direction, and how to read net positions alongside the exchange rate on the detail page.
- The COT report reflects positions as of each Tuesday and is usually released on Friday at 3:30 p.m. Eastern Time
- The dashboard shows non-commercial long, short and net positions, and the change from the previous week
- Currency futures are priced in dollars per unit of foreign currency, so a net long in yen, Canadian dollar or Swiss franc futures is bearish for USD/JPY, USD/CAD or USD/CHF
- A net position only means something compared with that market's own history; the detail page plots net positions and the exchange rate on one chart
- COT covers futures only and arrives three days late, so it suits judging position direction over weeks to months
- 1. What Is the COT Report? Release Schedule and What It Contains
- 2. Reading the COT Dashboard: Long, Short and Net
- 3. Translating Currency Futures Positions into Currency Pair Direction
- 4. Reading Net Positions Alongside the Exchange Rate
- 5. Three Rules for Reading COT Data
- 6. Limits of the COT Report
- 7. FAQ
- 8. Conclusion
1. What Is the COT Report? Release Schedule and What It Contains
The CFTC tallies open positions in each futures market every week. There are several versions of the COT report; Titan FX's tool uses the classification from the Legacy report, which splits traders into commercial, non-commercial and non-reportable positions.
Forex traders focus on the non-commercial group, made up mainly of large speculators such as hedge funds and commodity trading advisors (CTAs). Their positioning is widely used as a gauge of where speculative money is heading.
The data reflect positions as of the close on Tuesday. The CFTC takes three days to process them and usually releases the report on Friday at 3:30 p.m. Eastern Time, which is 3:30 a.m. Saturday in UTC+8 during U.S. daylight saving time and 4:30 a.m. in winter. In weeks with a U.S. federal holiday, the release can be delayed by one or two days.
The COT report is useful in situations like these:
| Situation | What to look at |
|---|---|
| You want to know whether speculators are long or short a currency | Whether the net position is positive or negative |
| You want to check whether speculative money is behind a trend | Whether the weekly change in the net position matches the trend |
| You worry that a trade has become crowded | Whether the net position is near the top or bottom of its own history |
| You swing trade over several weeks and want the bigger picture | Net positions and the exchange rate on the detail page |
For the CFTC itself and the different report types, see our CFTC glossary entry.
2. Reading the COT Dashboard: Long, Short and Net
The dashboard groups non-commercial positions from the COT report into FX, precious metals, stock indices, crypto, energy, indices, agriculture and U.S. Treasuries, with one card per market.
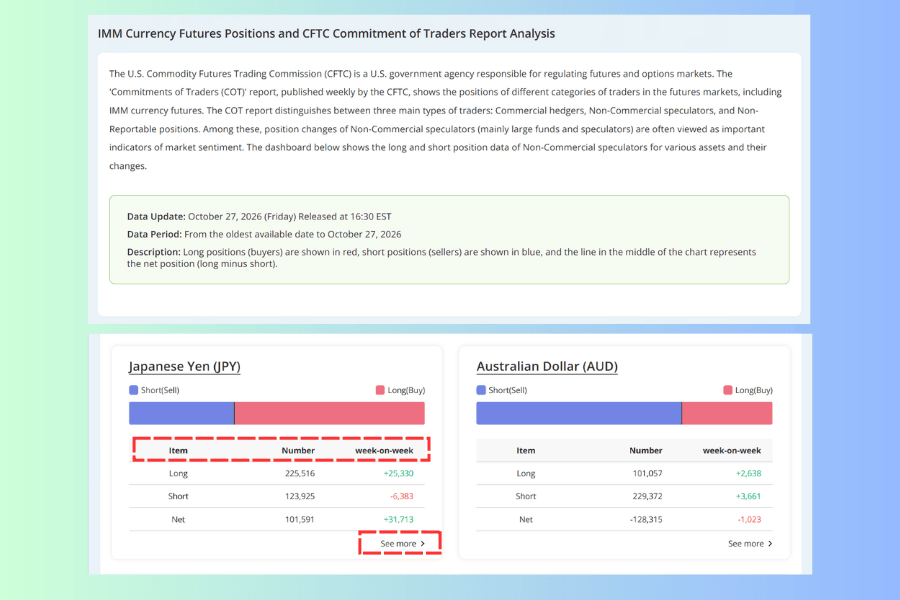
Each card has three rows:
-
Long: the number of long contracts held by non-commercial traders
-
Short: the number of short contracts held by non-commercial traders
-
Net: long minus short, the net position. A positive figure is net long, a negative one net short
These figures are numbers of futures contracts, not dollar amounts. Contract sizes differ from one currency to another, so you cannot compare the size of positions across currencies by contract count alone.
The week-on-week column next to each row shows its change from the previous week. The bar at the top of the card shows longs in red and shorts in blue, with a line marking the net position.
In the October 27 data on the page, yen longs stood at 225,516 contracts and shorts at 123,925, for a net position of 101,591, up 31,713 from the previous week. In other words, speculators were net long the yen and added to that position during the week.
Open IMM Currency Futures Positions3. Translating Currency Futures Positions into Currency Pair Direction
The COT report covers CME currency futures. These contracts price one unit of a foreign currency in U.S. dollars, so a long position is long that currency and short the dollar.
When you translate this into the pairs you actually trade, the direction depends on whether the dollar comes first or second:
| Futures position | Matching pair | A rising net long means |
|---|---|---|
| Euro, British pound, Australian dollar, New Zealand dollar | EUR/USD, GBP/USD, AUD/USD, NZD/USD | Bullish for the pair |
| Japanese yen, Canadian dollar, Swiss franc | USD/JPY, USD/CAD, USD/CHF | Bearish for the pair |
| Mexican peso, South African rand | USD/MXN, USD/ZAR | Bearish for the pair |
The yen is the easiest to get backwards. A rising net long in yen futures means speculators expect the yen to strengthen; because the dollar is the base currency in USD/JPY, a stronger yen means USD/JPY falls.
4. Reading Net Positions Alongside the Exchange Rate
Click See more at the bottom of a card to open that market's detail page, such as "Japanese Yen (JPY) IMM Currency Futures Positions and USD/JPY Exchange Rate Chart".
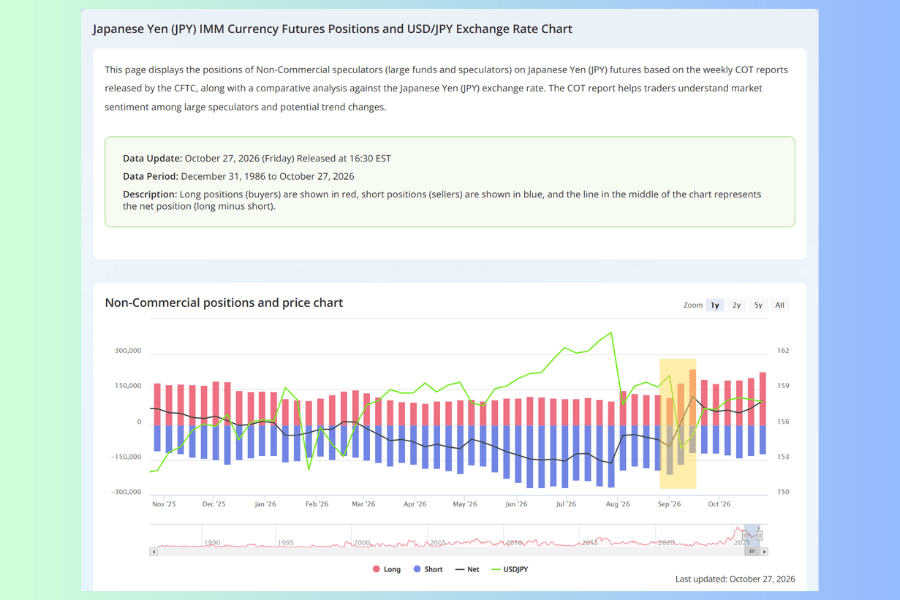
The chart plots long, short and net positions together with the USDJPY price, and you can switch the range between 1y, 2y, 5y and All. Yen data go back to 1986.
Below the chart, the Weekly position data table lists long, short and net positions with their week-on-week changes, and the week's USDJPY rate and change in the last columns.
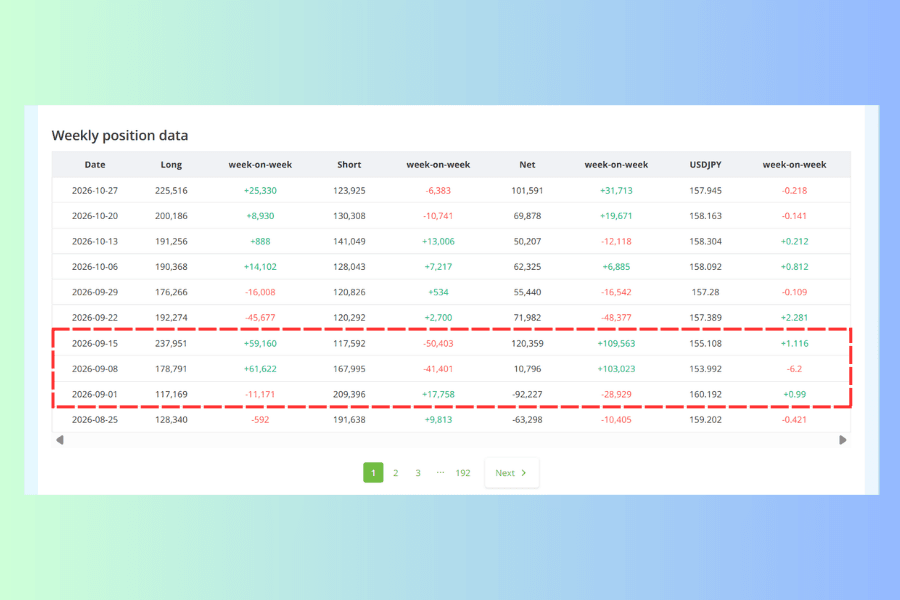
Early September 2026 shows the yen net position flipping:
-
September 1: net position of -92,227 contracts, meaning speculators were net short the yen. USDJPY was at 160.192
-
September 8: net position of 10,796 contracts, a flip from net short to net long in a single week. USDJPY was at 153.992, down 6.2 yen from the previous week
-
September 15: net position of 120,359 contracts, with the net long growing further. USDJPY was at 155.108, a slight rebound from the previous week
Over these three weeks, the yen futures net position went from negative to positive as speculators turned bullish on the yen. In the same period, USDJPY fell from around 160 to around 155, so the stronger yen matched the shift in positioning.
5. Three Rules for Reading COT Data
-
① Direction first, then change: whether the net position is positive or negative tells you which way speculators lean; the week-on-week change tells you whether they added or cut. A net position that is still positive but has fallen for several weeks in a row means longs are heading for the exit
-
② Compare a market with its own history: futures markets differ in size, so a net position of 100,000 contracts means very different things in different markets. Switch the detail chart to 1y or 5y and see where the current reading sits in that range
-
③ Treat extremes as a warning only: a net position near its historical high or low means a lot of positioning is already on one side, and unwinding it can drive a move the other way. But extreme positioning can persist for a while, or become more extreme. The more telling signs are a net position that starts falling week after week, or price and positioning starting to diverge
6. Limits of the COT Report
-
Three days late: the Friday release reflects Tuesday's positions, so you cannot see what happened in between. In fast markets, positioning may already have changed by the time the report comes out
-
Futures only: most currency trading happens in the interbank spot market, which has no public positioning data. The COT report shows speculative positions in futures, not the whole FX market
-
Non-commercial only: the dashboard shows non-commercial positions. Commercial traders are mostly companies and institutions with real exposure that trade to manage price risk, so their positions should not simply be treated as a contrarian signal against speculators
Because it updates once a week, the COT report is best for judging position direction over weeks to months, not for intraday entries. For short-term positioning, see the buy/sell ratios of Titan FX clients. For the drivers beyond positioning, such as interest rates, economic data and central bank policy, see our guide to forex fundamental analysis.
7. FAQ
Q1. Are "IMM positions" the same as the COT report?
IMM, the International Monetary Market, is the part of the Chicago Mercantile Exchange where currency futures have traded. "IMM positions" usually refers to non-commercial positions in currency futures from the COT report, the same data shown in the FX section of the dashboard.
Q2. Can I check COT data for gold or oil?
Yes. The dashboard also lists futures on gold, silver, crude oil, natural gas, stock indices and more. For gold, see the Gold (XAU) CFTC Futures Positions and Gold Price Chart page. These commodity futures are priced in dollars, so a long position is simply a bet on the commodity rising.
Q3. Why is the date on the tool a Tuesday?
The date shown is the date the positions were counted, which is a Tuesday. The CFTC releases the data on the Friday of the same week. For example, positions as of Tuesday, October 27 were released on Friday, October 30.
8. Conclusion
The COT report shows weekly futures positioning, and forex traders focus on the non-commercial net position and how it changes. Currency futures need translating into pair direction: net longs in the yen, Canadian dollar and Swiss franc point to USD/JPY, USD/CAD and USD/CHF falling.
Judge a net position against its own history and treat extremes as a warning. Because the data arrive three days late and cover futures only, use them to confirm the medium- to long-term direction.
Further Reading
Titan FX Research Team. We cover a broad set of financial instruments — foreign exchange, commodities (crude oil, precious metals, agricultural products), equity indices, US equities, and digital assets — producing practical, research-backed educational content for traders.
Primary Sources (by Category)
- Official sources: U.S. Commodity Futures Trading Commission (CFTC) COT report descriptions and FAQ
- Titan FX tools: COT positions dashboard and Japanese yen (JPY) detail page, viewed November 4, 2026