Divergence
Divergence is one of the most closely watched signals in technical analysis. It occurs when the price action moves in one direction while a technical indicator -- such as MACD, RSI, or the Stochastic Oscillator -- moves in the opposite direction.
When the price keeps making new highs or new lows but the indicator fails to follow, divergence may be forming. This typically suggests that market momentum is fading and a trend reversal or correction could be approaching. Traders in forex, equities, and cryptocurrency markets all use divergence to help time their entries and exits.
This article covers divergence definitions, classification, practical applications, and important limitations.
- What divergence means in technical analysis and why it signals potential trend shifts
- The difference between bearish divergence and bullish divergence
- How to spot divergence using MACD, RSI, and the Stochastic Oscillator
- Key risks and best practices when trading divergence signals
1. What Is Divergence?
In technical analysis, divergence refers to a disconnect between the direction of price movement and the direction of a technical indicator such as MACD, RSI, or the Stochastic Oscillator. It is widely regarded as a signal that the prevailing trend may be losing steam, which is why many traders watch for it closely.
For example, if the price prints a higher high but the indicator prints a lower high, a bearish divergence may be forming. Conversely, if the price makes a lower low while the indicator makes a higher low, a bullish divergence may be developing.
Divergence indicates that the momentum driving the current trend is weakening. The trend may be nearing its end, and a reversal or at least a correction could follow. While it is not infallible, divergence is considered a potential early warning signal that encourages traders to stay alert for shifts in market direction.
2. Types of Divergence: Bullish and Bearish
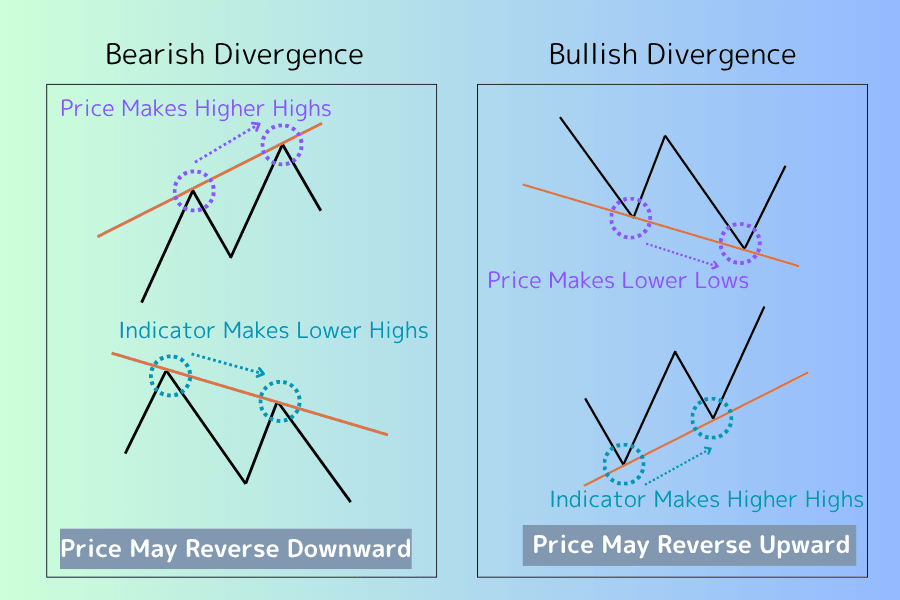
Divergence is primarily classified into two types: bearish divergence and bullish divergence.
| Type | Price Action | Oscillator Behavior | Market Implication |
|---|---|---|---|
| Bearish Divergence | Higher highs | Lower highs | Upward momentum weakening; potential decline |
| Bullish Divergence | Lower lows | Higher lows | Downward momentum weakening; potential rally |
3. How to Apply Divergence in Trading
The following sections demonstrate divergence using three commonly paired oscillators. Each indicator helps traders detect the disconnect between price and momentum that defines divergence.
- MACD
- RSI
- Stochastic Oscillator
MACD Divergence
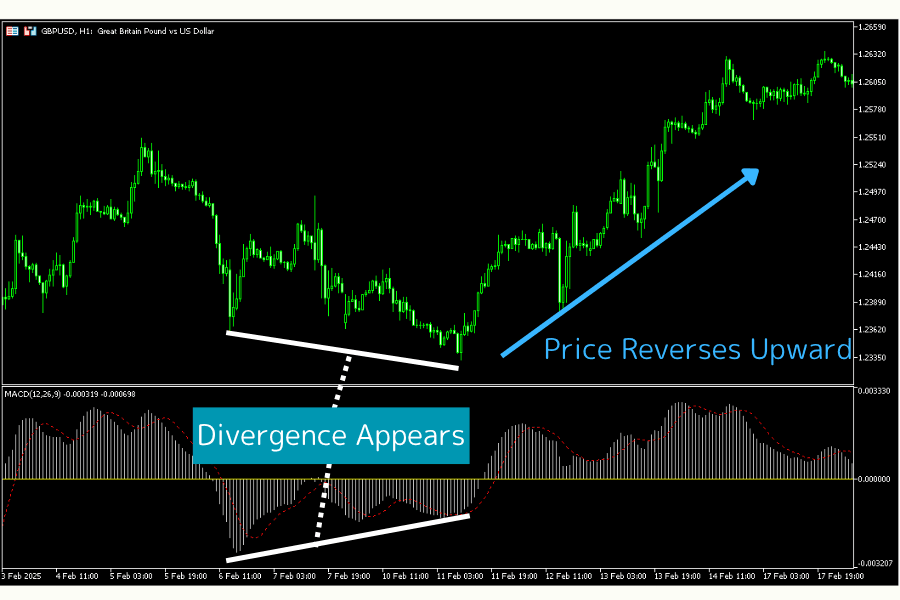
MACD (Moving Average Convergence Divergence) is a versatile oscillator that confirms trend direction and also gauges whether the market is overbought or oversold.
In the chart below, the price makes lower lows while MACD forms higher lows -- a classic bullish divergence pattern suggesting a potential trend reversal to the upside.
MACD Indicator Guide: Concept, Components, Signals, and How to Plot It
RSI Divergence
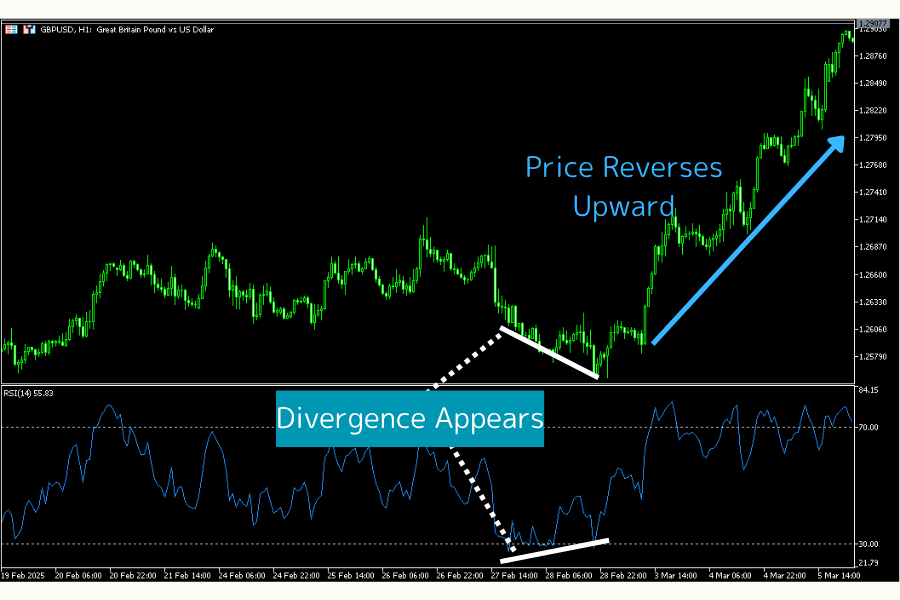
RSI (Relative Strength Index) measures whether a market is overbought or oversold on a scale of 0 to 100. Values above 70 typically indicate overbought conditions, while values below 30 suggest oversold conditions.
In the chart below, the price forms lower highs while RSI forms higher highs. This bullish divergence hints that selling momentum is fading and an upward reversal could be developing.
RSI Indicator Guide: Calculation, Interpretation, and How to Plot on MT4/MT5
Stochastic Divergence
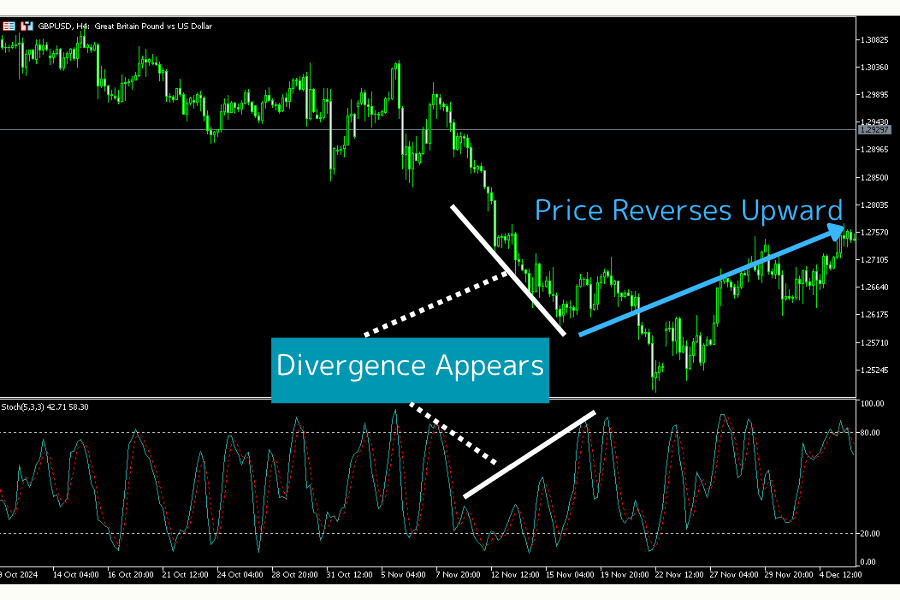
The Stochastic Oscillator is a momentum indicator that compares a security's closing price to its price range over a set period. Like RSI, it oscillates between 0 and 100 and is primarily used to identify overbought or oversold conditions.
When the price and the Stochastic Oscillator diverge, it may signal an upcoming trend reversal. In the chart below, the price makes a new low while the Stochastic forms a higher low, creating a bullish divergence setup.
What Is the Stochastic Oscillator? Types, Formula, Interpretation, and Settings
4. Key Considerations When Using Divergence
Divergence does not always lead to an immediate reversal
Divergence signals that momentum is weakening, but it does not guarantee that the price will reverse right away. Sometimes the market simply enters a consolidation phase before resuming the original trend. Treat divergence as a warning, not a certainty.
Avoid trading on divergence alone
Divergence signals are relatively infrequent, and they often fail in strongly trending markets. Basing trading decisions solely on divergence increases the risk of false signals. Combine divergence with other tools -- support and resistance levels, moving averages, volume, or trendlines -- to confirm the signal before acting.
Combine divergence with market context and other indicators
The reliability of a divergence signal depends on the broader market environment. In ranging or choppy markets, divergence tends to provide more useful signals. In strong trends, divergence can fire repeatedly without an actual reversal, leading to costly false entries.
Because no single indicator is reliable on its own, it is advisable to pair divergence analysis with complementary tools such as support and resistance levels, moving averages, or candlestick patterns to strengthen the overall trading thesis.
5. FAQ
Q1: Can divergence alone guarantee trading success?
Divergence highlights a disconnect between price movement and indicator momentum. While it helps identify potential reversal points, relying on divergence alone does not guarantee success. Combine divergence with support and resistance levels, trendlines, and volume for better accuracy. Divergence is a warning signal, not a standalone trade trigger.
Q2: Which indicators are best suited for divergence analysis?
The most commonly used indicators for divergence analysis are:
| Indicator | Purpose |
|---|---|
| RSI (Relative Strength Index) | Identifies divergence near overbought or oversold levels |
| Stochastic Oscillator | Detects momentum divergence between price and the oscillator |
| MACD | Spots divergence between the MACD line/histogram and price |
| Bollinger Bands | Confirms potential reversal signals when price breaks band boundaries alongside divergence |
Q3: Does divergence work in all markets?
Divergence analysis applies to forex, equities, and cryptocurrency markets alike. However, the reliability of signals varies depending on each market's volatility, liquidity, and participant behavior. Adjust your analysis accordingly and combine divergence with other indicators for a comprehensive view.
Q4: What is hidden divergence?
Hidden divergence occurs when the price makes a higher low (in an uptrend) or a lower high (in a downtrend) while the indicator moves in the opposite direction. Unlike regular (classic) divergence, which signals a potential reversal, hidden divergence is typically interpreted as a trend-continuation signal. It suggests that the prevailing trend still has momentum despite the indicator's conflicting reading.
6. Summary
Divergence occurs when an oscillator and the price action move in opposite directions. It is one of the most widely used early warning signals for potential trend reversals. Observing divergence can help traders anticipate shifts in market direction, but it is not definitive -- a divergence signal does not guarantee an immediate reversal.
For this reason, divergence should always be used alongside other technical indicators (MACD, RSI, Stochastic, etc.) and price patterns. Traders who refine how they incorporate divergence into their strategies will be better positioned to capture trend shifts and manage risk.
Divergence is a powerful tool, but successful trading ultimately depends on thorough analysis and disciplined execution.
Further Reading
- MACD Indicator Guide: Concept, Components, Signals, and How to Plot It
- RSI Indicator Guide: Calculation, Interpretation, and How to Plot on MT4/MT5
- What Is the Stochastic Oscillator? Types, Formula, Interpretation, and Settings
- Introduction to Technical Analysis
- Moving Averages: Types, Calculation, and Trading Applications
Titan FX's financial market research and analysis team produces investor education content across a wide range of financial instruments, including foreign exchange (FX), commodities (crude oil, precious metals, and agricultural products), stock indices, U.S. equities, and crypto assets.
Primary Sources (by Category)
- Technical analysis theory and education: Investopedia (investopedia.com) -- Divergence, MACD, RSI, Stochastic Oscillator reference articles
- Charting and market data: TradingView (tradingview.com) -- Real-time charting platform and oscillator implementation reference
- Trading platforms: MetaQuotes (metatrader5.com) -- Official documentation for technical indicators built into MT4/MT5