What Is the S&P/ASX 200 (AUS200)? Components, Features & Trading Strategies
AUS200 is the core index tracking the overall performance of the Australian stock market, comprising the 200 largest companies by market capitalization listed on the Australian Securities Exchange (ASX) and covering approximately 80% of total ASX market capitalization. From financial heavyweight CBA to mining giant BHP and healthcare leader CSL, these constituents represent the backbone of the Australian economy.
For CFD traders, AUS200 offers a unique combination of strong correlation with global commodity cycles and deep sensitivity to Chinese economic developments, providing trading opportunities distinct from US and European indices. Whether tracking how iron ore price movements feed through to resource stocks or capturing short-term swings around Reserve Bank of Australia (RBA) interest rate decisions, AUS200 is an essential instrument in Asia-Pacific index trading. This article systematically breaks down the AUS200 trading framework, from index composition and price drivers to practical trading strategies.
What Is the Australia S&P/ASX 200 Index (AUS200)?
The S&P/ASX 200 Index was launched in April 2000 and is jointly calculated by the Australian Securities Exchange (ASX) and Standard & Poor's (S&P). It is the most representative benchmark index for the Australian stock market, tracking the 200 largest and most liquid companies listed on the ASX, covering approximately 80% of total market capitalization, and is widely regarded as a barometer of the Australian economy.
| Item | Details |
|---|---|
| Official Name | S&P/ASX 200 Index |
| Trading Symbol | AUS200 (CFD) |
| Launch Year | April 2000 |
| Number of Constituents | 200 |
| Weighting Method | Free-Float Market-Cap Weighted |
| Market Coverage | Approximately 80% of ASX total market cap |
| Rebalancing Frequency | Quarterly review (March, June, September, December) |
How the AUS200 Index Is Calculated
AUS200 uses a free-float market-capitalization weighting methodology, counting only shares available for public trading and excluding shares held long-term by major shareholders. This means companies with larger market capitalizations and higher free-float ratios have a greater influence on the index.
Unlike the price-weighted approach of the Dow Jones Industrial Average (US30), free-float market-cap weighting more accurately reflects the actual distribution of capital in the market. While the weighting logic is similar to that of the S&P 500 Index (US500), AUS200 has a significantly higher sector concentration, with financials and resources together accounting for over 50% of the index.
The index undergoes quarterly constituent reviews, with inclusion and exclusion decisions based on market cap rankings and liquidity criteria, ensuring the index consistently represents the top-tier companies on the ASX.
Components and Sector Distribution
The AUS200 constituent mix closely mirrors Australia's economic structure, with financials and resources dominating. Below is an overview of key constituents and sector breakdown.
Key Constituents
| Sector | Key Companies | Description |
|---|---|---|
| Financials | Commonwealth Bank (CBA), Westpac (WBC), NAB | Australia's Big Four banks collectively account for approximately 20% of the index weight, making financials the single largest sector |
| Resources/Mining | BHP Group, Rio Tinto, Fortescue (FMG) | World-class mining companies whose share prices are directly driven by iron ore, copper, and lithium commodity prices |
| Healthcare | CSL Limited, Cochlear | CSL is a global leader in blood products and one of the largest non-financial companies on the ASX |
| Consumer | Woolworths, Wesfarmers | Australia's largest retail groups, reflecting domestic consumer confidence |
| Energy | Woodside Energy | Australia's largest oil and gas producer, driven by international crude oil and natural gas prices |
| Infrastructure/Telecom | Telstra, Transurban | Telecom and toll road leaders with defensive characteristics |
Sector Distribution
| Sector | Weight (approx.) | Key Companies |
|---|---|---|
| Financials | ~30% | CBA, Westpac, NAB, ANZ, Macquarie |
| Resources/Mining | ~20% | BHP, Rio Tinto, Fortescue, South32 |
| Healthcare | ~10% | CSL, Cochlear, ResMed |
| Consumer (Staples + Discretionary) | ~10% | Woolworths, Wesfarmers, Coles |
| Energy | ~5% | Woodside Energy, Santos |
| Real Estate | ~5% | Goodman Group, Scentre Group |
| Infrastructure/Industrials | ~5% | Transurban, Brambles |
| Telecom/Tech/Other | ~15% | Telstra, Xero, Block (SQ2) |
With financials and resources together accounting for over 50% of index weight, AUS200 is highly correlated with global interest rate environments and commodity price cycles. This is the key structural difference from tech-dominated indices like the Nasdaq 100 (NAS100).
Key Price Drivers
Global Economy and Trade Environment
Australia is a highly open, export-oriented economy, and global economic conditions directly impact AUS200 performance. Key indicators to watch include:
- Global PMI (Manufacturing Purchasing Managers' Index): Reflects global manufacturing activity levels and is positively correlated with commodity demand
- International trade policy: Tariff barriers and trade frictions place direct pressure on Australian export-oriented companies
- Global risk appetite: As a relatively smaller developed market index, AUS200 tends to face greater capital outflow pressure during global risk-off episodes
Chinese Economic Dynamics (Largest Trading Partner)
China is Australia's largest trading partner, with bilateral trade accounting for over 30% of Australia's total foreign trade. China's economic performance can, at times, have a greater influence on AUS200 than domestic Australian factors.
- China GDP Growth Rate: Chinese economic expansion drives demand for iron ore, coal, and natural gas, directly benefiting resource stocks like BHP and Rio Tinto
- China Manufacturing PMI: Manufacturing activity is a leading indicator for commodity demand, and PMI data often impacts AUS200's opening price action immediately upon release
- China Industrial Production: Reflects real economy production activity and is closely linked to resource sector performance
- China real estate and infrastructure policy: Steel demand accounts for a significant share of global iron ore consumption, and China's property regulations and infrastructure investment plans directly affect iron ore prices
Australian Domestic Economy
- GDP Growth Rate: Economic expansion supports corporate earnings and benefits overall index performance
- CPI (Consumer Price Index): Inflation data is a core consideration in RBA rate decisions, with rising inflation potentially boosting rate hike expectations
- Employment Data: Unemployment rate and new jobs figures reflect economic health and influence RBA policy direction
- Retail Sales: Consumer spending is a major GDP component, reflecting the strength of domestic demand
- Real estate market: Housing prices and building permit data affect bank asset quality and consumer wealth effects
Reserve Bank of Australia (RBA) Monetary Policy and AUD Exchange Rate
The Reserve Bank of Australia (RBA) interest rate decision is one of the most critical factors driving AUS200 price action.
- Rate cuts/easing: Lowers corporate funding costs, boosts equity valuations, and may weaken the AUD, benefiting export-oriented companies
- Rate hikes/tightening: Increases the cost of capital, pressures high-valuation sectors, with particularly significant impact on real estate and highly leveraged companies
- AUD exchange rate: AUD weakness generally benefits resource exporters (as USD-denominated revenue converts to more AUD) but may weigh on import-dependent consumer companies
With financials accounting for approximately 30% of AUS200, banks' net interest margins (NIM) are highly sensitive to the rate environment, meaning every RBA policy adjustment directly impacts the index's core-weighted sector.
Commodity Prices and Capital Flows
- Iron ore prices: Highly positively correlated with resource stocks such as BHP, Rio Tinto, and FMG, serving as the core driver of the AUS200 resource sector
- Gold prices: Affect the performance of gold mining stocks such as Newcrest
- Crude oil and natural gas: Drive earnings expectations for energy stocks like Woodside Energy and Santos
- Foreign capital inflows/outflows: Shifts in global asset allocation (such as rotation from Asia-Pacific markets to US equities and vice versa) influence AUS200's medium-term trends
Use Titan FX's Economic Indicators Calendar to track real-time release schedules and market expectations for key Australian, Chinese, and global economic data. The Australia Economic Indicators page and China Economic Indicators page provide more focused information tracking.
Advantages and Risks
Advantages
-
One-stop exposure to the Australian economy: AUS200 covers the 200 largest companies, representing approximately 80% of ASX market cap. A single instrument provides participation in Australia's core sectors including financials, resources, healthcare, and consumer
-
Indirect participation in commodity cycles: By trading AUS200, you can gain indirect exposure to price movements in iron ore, coal, natural gas, and other commodities without directly trading individual commodity futures
-
High dividend yield: The Australian stock market has historically been known for high dividends, and AUS200's average dividend yield ranks among the highest of major global indices, making it attractive for medium- to long-term investors
-
Diversified risk: Compared to investing in individual Australian stocks, AUS200 distributes risk across 200 companies, reducing the impact of company-specific events
-
Asia-Pacific timezone trading opportunities: AUS200's primary trading session falls within the Asia-Pacific timezone, complementing US and European indices and providing convenient access for traders in the Asian timezone
Risks
-
Financial and resource sector concentration: Financials and resources together account for over 50% of index weight, resulting in high sector concentration. Changes in banking regulations or a commodity price crash could significantly impact the index
-
Dependence on the Chinese economy: Australia's export dependence on China means that a Chinese economic slowdown or deterioration in Sino-Australian trade relations could expose AUS200 to greater-than-expected downside pressure
-
Currency risk: For traders with non-AUD denominated accounts, sharp AUD fluctuations can amplify or offset returns from the index itself
-
Relatively limited liquidity: Compared to US stock indices like NAS100 and US500, AUS200 has lower average daily trading volume, and spreads may widen during extreme market conditions
-
Global risk contagion: As the core index of an open economy, external shocks such as global financial crises and geopolitical conflicts tend to have an amplified impact on AUS200
Practical Trading Strategies
Using Technical Analysis Tools (Titan FX Tools)
Titan FX provides multiple analysis tools to help traders assess the technical condition of AUS200:
- Support & Resistance: Identify key price levels for AUS200 and assess breakout or reversal potential
- Order Book (Position Info): Monitor other traders' pending order distribution and long/short ratios
- Trend Analysis: Determine whether AUS200 is currently in an uptrend, downtrend, or range-bound phase
- RSI Analysis: Identify overbought or oversold conditions and support reversal timing decisions
- Volatility Heatmap: Understand AUS200's volatility patterns across different trading sessions
- Percentage Change Ranking: Compare AUS200's real-time performance against other indices
Specific Trading Approaches: Sector Rotation, China Data-Driven, Event Trading
Sector Rotation Strategy
AUS200's dual-core structure of financials and resources creates clear sector rotation patterns across different phases of the economic cycle. During economic expansion (rising global demand, higher commodity prices), resource stocks tend to outperform. In slowdown or rate-cutting cycles, high-dividend financial stocks and defensive utility stocks show relatively resilient performance. Identifying the current phase of the economic cycle is a crucial foundation for determining AUS200 trading direction.
China Data-Driven Trading
The release of Chinese manufacturing PMI, GDP, industrial production, and other data often triggers gaps or rapid directional moves in AUS200 around the Australian market open. When Chinese PMI beats expectations, resource stocks typically rally quickly after the open, pulling AUS200 higher. Conversely, below-expectation data can trigger index pullbacks. Closely following China economic indicators release schedules can help with advance positioning.
RBA Interest Rate Decision Event Trading
The RBA rate decision is the single event with the most concentrated AUS200 volatility. The magnitude of the gap between the outcome and market expectations determines the strength of the price action. When the decision meets expectations, volatility is limited; when it surprises (unexpected hike or cut), the index may experience sharp swings in a short period. When trading around rate decisions, consider reducing standard position sizes by half or more and setting wider stop-loss distances.
Commodity Correlation Strategy
Monitoring iron ore futures price trends (Singapore Exchange iron ore futures being the primary reference) can serve as a leading indicator for the direction of AUS200's resource sector. When iron ore prices break above key resistance levels, AUS200 tends to follow with gains in subsequent trading sessions. Combining commodity price trends with index technical analysis can improve trade win rates.
How to Trade AUS200 on Titan FX
On the Titan FX platform, the Australia S&P/ASX 200 Index is traded as a CFD under the symbol AUS200. You can also trade directly from your browser using WebTrader.
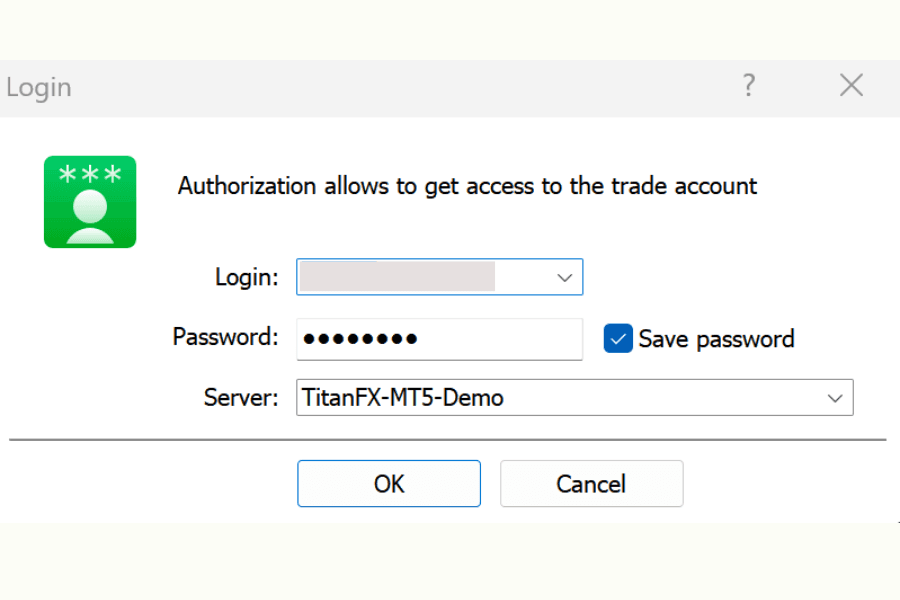
Step 1: Log In to Your Trading Account
Open a Titan FX trading account (Zero Standard or Zero Blade), complete your deposit, download the MT4 or MT5 platform, and log in with your account credentials.
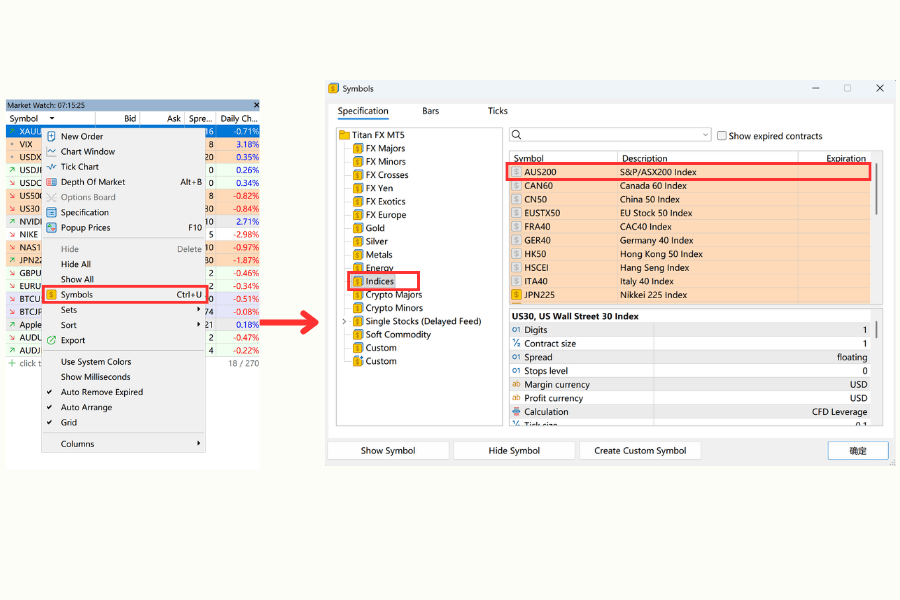
Step 2: Add AUS200 to Market Watch
Right-click in the Market Watch window, select "Symbols," expand the "Indices" category, find AUS200, and double-click to add it to the quotes list.
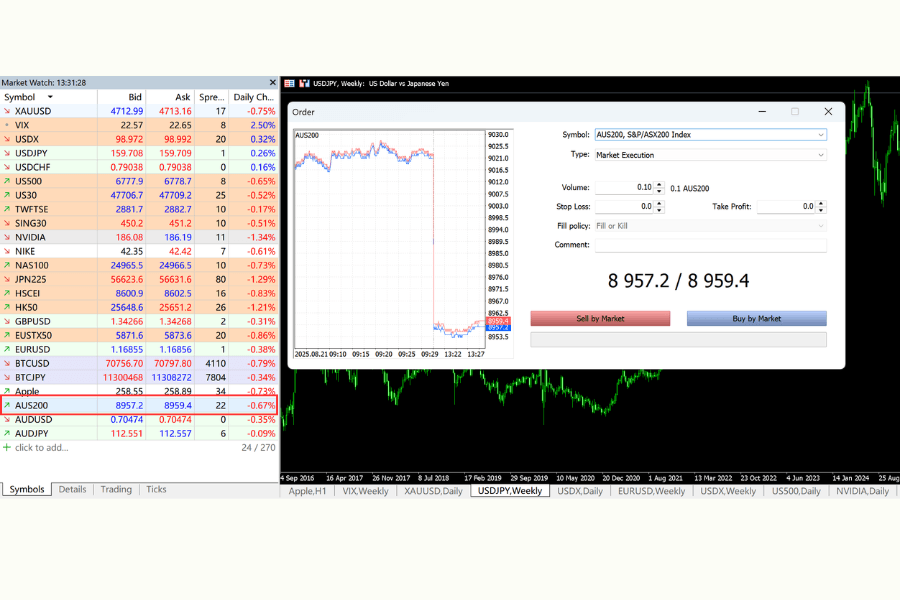
Step 3: Start Trading
Double-click the AUS200 quote or open a chart to access the order window. Enter the lot size (minimum 0.1 lots), choose buy or sell direction, set your stop loss and take profit, and execute the trade.
Trading Hours (MT4/MT5 Server Time GMT+3):
| Session | Server Time (GMT+3) | Eastern Time (GMT-4) |
|---|---|---|
| Session 1 | 02:50 - 09:30 | 19:50 - 02:30 |
| Session 2 | 10:10 - 23:59 | 03:10 - 16:59 |
AUS200 trading is split into two sessions with a 40-minute break in between (09:30 - 10:10 GMT+3). Session 1 covers the Australian stock market's regular trading hours, while Session 2 extends into global market trading hours.
For the latest trading conditions and spreads, please refer to the official page.
Start Trading the AUS200 Index Trade AUS200 CFDs with Titan FX and enjoy up to 500x leverage, low spreads, and the flexibility to go long or short. Both Zero Standard and Zero Blade accounts support index CFD trading (Zero Micro accounts do not support index CFDs).
Key Points for Beginners
Leverage and Risk Management
Titan FX offers up to 500x leverage (Zero Standard / Zero Blade accounts). While AUS200's overall volatility is lower than NAS100, sharp price swings can still occur during major data releases or external shocks, making risk management critical when trading with high leverage.
- Keep the risk per trade within 1-2% of account equity
- Be aware of AUS200's split trading sessions; spreads tend to widen in the minutes before and after the open and close
- Use Titan FX's Margin Calculator to calculate required margin and appropriate position sizes
Impact of Chinese Data on Opening Price Action
Key Chinese economic data (PMI, GDP, industrial production, etc.) is typically released during the morning in Beijing time, coinciding with AUS200's primary trading session. These releases can trigger rapid 50-100 point moves in the index within a short timeframe. It is recommended to check the Economic Indicators Calendar ahead of Chinese data release days to prepare for potential volatility.
Financial Sector Weighting and Interest Rate Sensitivity
The financial sector accounts for approximately 30% of AUS200's weight, and the Big Four banks' performance has a decisive influence on index direction. RBA rate decisions not only affect overall valuations but directly impact bank net interest margins and profitability. Following the RBA interest rate decision schedule and policy signals from the RBA monetary policy meeting minutes is essential for AUS200 trading.
Split Trading Sessions: Key Considerations
AUS200's trading hours are divided into two sessions (02:50-09:30 and 10:10-23:59 GMT+3) with a 40-minute break in between. The following situations tend to occur around the break:
- Before the break (around 09:30 GMT+3): Liquidity gradually decreases and spreads may widen
- At re-open (10:10 GMT+3): Gaps may occur, especially if significant news is released during the break
- Traders should avoid setting stop losses too tight around the break period to prevent unnecessary trigger from price fluctuations
FAQ
How does the AUS200 differ from other Asia-Pacific indices?
| Index | Constituents | Weighting | Sector Characteristics | Titan FX Symbol |
|---|---|---|---|---|
| AUS200 (Australia S&P/ASX 200) | 200 | Free-float market-cap weighted | Financials + resources over 50%, high dividend yield | AUS200 |
| CN50 (FTSE China A50) | 50 | Market-cap weighted | China A-share blue chips, high financials weighting | CN50 |
| NAS100 (Nasdaq 100) | 100 | Modified market-cap weighted | Tech stocks over 50%, high volatility | NAS100 |
AUS200 is suited for traders bullish on the Australian economy and commodity cycles, CN50 for participating in short-term Chinese stock market volatility, and NAS100 for capturing growth opportunities in global technology stocks.
Why do Chinese economic data releases have such a significant impact on AUS200?
China is Australia's largest trading partner, and Australia exports large volumes of iron ore, coal, natural gas, and agricultural products to China. Chinese economic expansion directly boosts demand for these commodities, benefiting the resource stocks that make up approximately 20% of AUS200. Conversely, a Chinese economic slowdown or real estate downturn can suppress iron ore demand and prices, dragging on index performance. This deep trade relationship makes Chinese PMI, GDP, and other data indispensable indicators for AUS200 trading.
Is AUS200 suitable for long-term investment?
AUS200 has historically delivered relatively stable long-term returns with a high dividend yield, ranking among the top global indices for dividend returns. The cyclical nature of the financial and resource sectors means the index experiences clear bull-bear cycles aligned with the economic cycle, but over the long term, supported by Australia's robust financial system and abundant natural resources, the index has shown a sustained growth trajectory. However, due to its high sector concentration, combining AUS200 with other regional indices for risk diversification is recommended.
What are the AUS200 CFD trading hours?
AUS200 CFD trading is split into two sessions: Session 1 from 02:50-09:30 (GMT+3) and Session 2 from 10:10-23:59 (GMT+3), corresponding to Eastern Time 19:50-02:30 and 03:10-16:59 respectively. There is a 40-minute break between the two sessions. The Australian stock market's regular trading hours (approximately 19:50-02:30 Eastern Time) provide the highest liquidity and most concentrated volatility. Detailed trading session information can be found on the Titan FX Index CFD Trading Conditions page.
What technical indicators are useful for AUS200 trading?
Commonly used technical indicators include moving averages (trend direction), RSI (overbought/oversold identification), Bollinger Bands (volatility range measurement), and MACD (momentum confirmation). Since AUS200 is significantly influenced by commodity prices, monitoring iron ore and crude oil trends as supplementary references is recommended. Titan FX's Trend Analysis and RSI Analysis tools provide real-time technical analysis for AUS200.
What costs should I be aware of when trading AUS200?
The main costs in CFD trading include spreads (bid-ask difference), swap (overnight interest), and potentially commissions. AUS200 spread levels and specific trading conditions can be viewed on the Titan FX website. Holding positions overnight incurs swap charges, which can be checked via the Swap Calendar. Additionally, index CFDs may involve dividend adjustments, with corresponding debits or credits applied to your account when constituent stocks go ex-dividend.
Summary
AUS200 is the core benchmark index of the Australian stock market, bringing together leading companies across financials, resources, healthcare, consumer, and other sectors. Its unique sector structure creates a deep linkage with commodity cycles and Chinese economic dynamics, offering trading logic and opportunities distinct from US and European indices.
Understanding RBA monetary policy direction, closely tracking Chinese economic data and commodity price trends, using technical analysis tools for entry and exit timing, and strictly executing risk management form the fundamental framework for AUS200 trading.
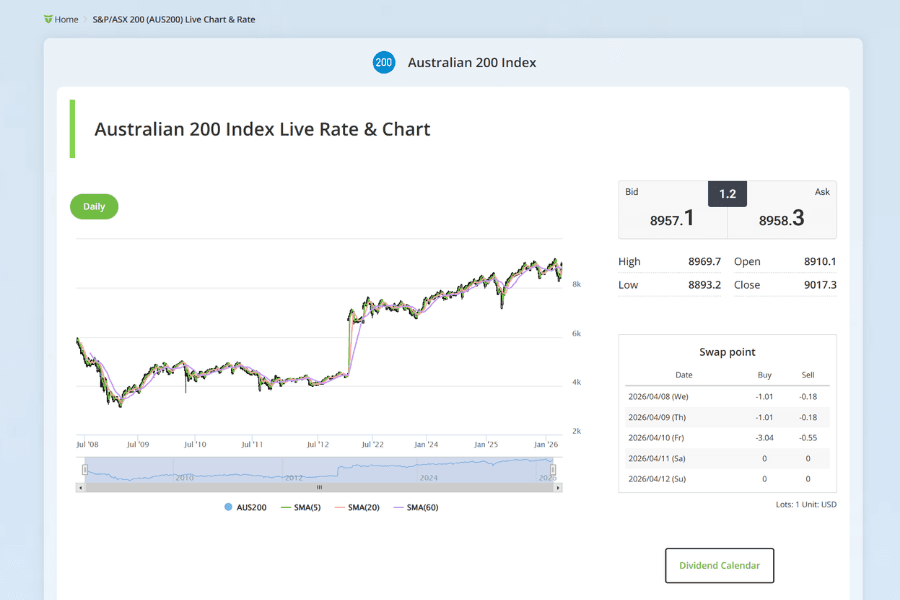
Leverage Titan FX's AUS200 live price and chart page to stay on top of market developments, and apply the analytical framework presented in this article to your actual trading.