What Is a Synthetic Index? A Complete Guide
In financial markets, the index products investors most often encounter are typically derived from real stock markets, such as the S&P 500 (US500) or the Nikkei 225 (JPN225). With the growth of online trading platforms, however, a new category called Synthetic Indices has also emerged. These indices are not based on real market assets—instead, they use algorithms to generate price movements that simulate various degrees of market volatility.
For traders, understanding how Synthetic Indices work and how they differ from traditional stock indices helps clarify the characteristics and potential risks of different trading products. This article introduces the basic concept and mechanics of Synthetic Indices, and outlines the key differences between them and real-market indices.
What Is a Synthetic Index?
A Synthetic Index is a type of price index generated algorithmically by a trading platform. Unlike stock indices or commodity prices, it does not correspond to a real market asset—its prices are simulated by a system based on predefined rules.
These indices are typically designed to model different market volatility environments, such as low-volatility or high-volatility scenarios. Because their prices are not derived from actual trading markets, Synthetic Indices usually run around the clock, unconstrained by stock-exchange or trading-session hours.
| Item | Details |
|---|---|
| Product Type | Algorithmically generated virtual price index |
| Price Source | Random number algorithms or mathematical models, not real market supply and demand |
| Trading Hours | Typically 24/7 |
| Drivers | Platform-defined volatility parameters and pricing models |
| Link to Economic Data | None—unaffected by GDP, interest rates, earnings, etc. |
| Transparency | Varies by platform; some lack robust price-auditing mechanisms |
For traders, a Synthetic Index is essentially a trading product that simulates market behavior. Its price path is driven by the platform's algorithms rather than by actual economic data or corporate fundamentals.
How Synthetic Indices Work
Synthetic Index prices are usually produced by a random number generator (RNG) or a mathematical model. These models continuously generate new price data based on preset volatility and price-change rules, producing a chart that appears similar to a real market.
Price Generation Mechanism
For example, some Synthetic Indices are designed to simulate markets with fixed volatility levels. One index may represent a "high-volatility market" (e.g., Volatility 75 Index), while another represents a "relatively stable market" (e.g., Volatility 10 Index). In such cases, price changes are not determined by market supply and demand but by algorithms following predefined rules.
The Core Difference From Real Markets
Because Synthetic Indices do not depend on actual markets, they can usually provide continuous price updates and longer trading hours. This also means, however, that traditional technical-analysis tools reliant on real trading volume and market sentiment (volume indicators, investor positioning data, and so on) may apply differently to Synthetic Indices.
When trading these products, traders need to understand how their prices are formed and how that differs fundamentally from real market assets.
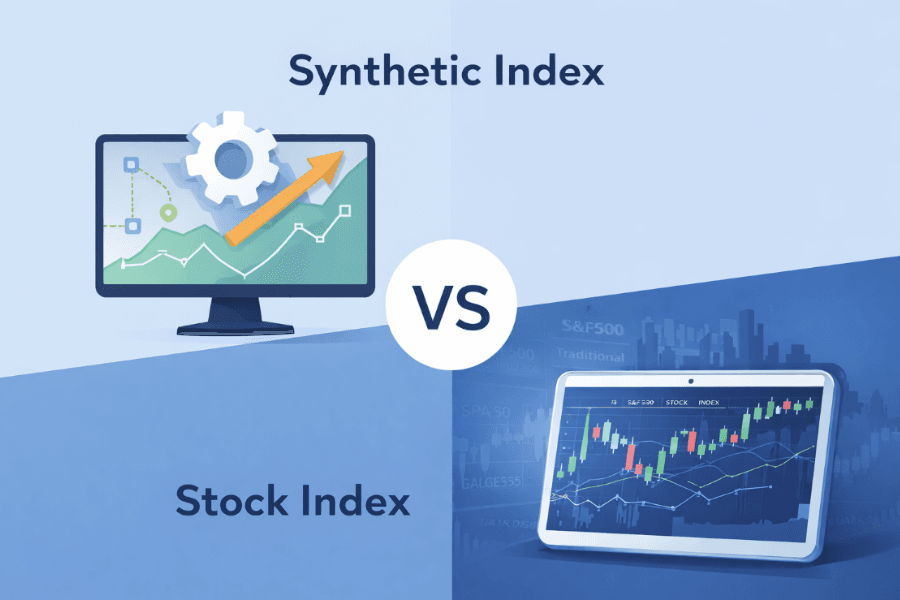
Synthetic Indices vs. Traditional Market Indices
The biggest difference between Synthetic Indices and traditional stock indices lies in the source of prices. The table below summarizes the core differences.
| Comparison | Synthetic Index | Traditional Stock Index (e.g., S&P 500, Nikkei 225) |
|---|---|---|
| Price Source | Algorithmically generated | Composite of prices of multiple listed companies |
| Drivers | Platform volatility parameters | Corporate earnings, economic data, market sentiment |
| Trading Hours | Usually 24/7 | Tied to exchange trading hours |
| Sensitivity to Economic Data | None | High (interest rates, CPI, nonfarm payrolls, etc.) |
| Constituents | None | Yes (e.g., Dow 30 (US30) contains 30 large companies) |
| Market Transparency | Depends on platform | High (public exchanges, regulated) |
| Fundamental Analysis | Not applicable | Applicable (earnings, macro analysis) |
The Fundamental Difference in Price Formation
Stock indices such as the S&P 500 (US500) or the Nasdaq 100 (NAS100) are composed of the share prices of multiple listed companies. Their moves are influenced by corporate performance, economic data, fund flows, and investor sentiment. Synthetic Indices, by contrast, do not reflect corporate earnings, interest-rate policy, or global economic changes—their paths depend primarily on the platform's pricing model.
Differences in Trading Hours
Traditional stock indices typically track exchange trading hours; US equity indices, for example, move during US market sessions. Synthetic Indices, free from reliance on real markets, generally run for extended periods or 24/7.
Understanding these differences is crucial for traders. Real market indices are usually linked to macroeconomic conditions and corporate performance, while Synthetic Indices are more akin to system-generated trading products.
Does Titan FX Offer Synthetic Indices?
Titan FX does not offer Synthetic Index trading. These indices are generated algorithmically by certain platforms, and their prices do not come directly from actual financial markets.
Instead, Titan FX offers stock index CFDs based on real markets. These indices reflect the overall performance of multiple large-cap companies within a country or region, including major benchmarks across the United States, Europe, and Asia.
Through these index products, traders can participate in the price movements of major global stock markets, such as the S&P 500 (US500), Nasdaq 100 (NAS100), Dow 30 (US30), and US Dollar Index (USDX). Because the prices come from real markets, these indices are generally viewed as trading products closer to actual market conditions.
Stock Indices Available at Titan FX
Although Synthetic Indices do not correspond to real financial markets, traders can still access a wide range of major global stock indices through Titan FX. These indices are composed of the share prices of multiple large-cap listed companies and represent the overall performance of specific markets or economies.
Unlike Synthetic Indices, the prices of stock indices come from real markets and are influenced by corporate earnings, economic data, fund flows, and investor sentiment. For traders interested in global equity trends, stock indices offer an important way to observe and participate in the broader market.
Titan FX currently offers index CFDs covering the United States, Europe, Asia, and other regions:
| Symbol | Index |
|---|---|
| AUS200 | Australia 200 |
| CAN60 | Canada S&P 60 |
| CN50 | FTSE China 50 |
| EUSTX50 | Euro Stoxx 50 |
| FRA40 | France CAC 40 |
| GER40 | Germany DAX 40 |
| HK50 | Hong Kong Hang Seng 50 |
| HSCEI | Hang Seng China Enterprises Index |
| JPN225 | Nikkei 225 |
| NAS100 | US Nasdaq 100 |
| NETH25 | Netherlands AEX 25 |
| SING30 | Singapore Straits Times 30 |
| TOPIX | Tokyo Stock Price Index |
| TWFTSE | SGX FTSE Taiwan |
| UK100 | UK FTSE 100 |
| US30 | US Dow 30 |
| US500 | US S&P 500 |
| US2000 | US Russell 2000 |
| USDX | US Dollar Index |
| VIX | CBOE Volatility Index |
Through these stock indices, traders can observe the broader movements of different countries and markets from a macro perspective, rather than focusing on individual company shares alone.
Titan FX Analytical Tools
Titan FX provides a range of analytical tools to help traders assess the technical backdrop of stock indices:
- Support & Resistance: Confirm key price levels for each index.
- Trend Analysis: Determine whether the market is trending up or down.
- RSI Analysis: Identify overbought or oversold zones.
- Volatility Heatmap: Compare volatility levels across different indices.
- Percentage Change Ranking: Compare real-time performance across indices.
- Economic Calendar: Track key economic releases that influence index moves.
For the latest trading conditions and live prices, see the official Titan FX index CFD page.
Start Trading Global Stock Indices Trade real-market stock index CFDs at Titan FX with leverage up to 500x, tight spreads, and full long/short flexibility. Zero Standard and Zero Blade accounts both support index CFDs (Zero Micro does not support index CFDs).
Frequently Asked Questions
How are Synthetic Index prices generated?
Synthetic Index prices are generated by a trading platform using random number algorithms or mathematical models—they are not produced by real supply and demand in financial markets. The platform continuously generates new price data based on preset volatility parameters, simulating different market-volatility environments.
What is the biggest difference between a Synthetic Index and a traditional stock index?
The key difference is the source of prices. Traditional stock indices (such as the S&P 500 or the Nikkei 225) are composed of the share prices of multiple listed companies and are influenced by corporate earnings, economic data, and investor sentiment. Synthetic Index prices are generated algorithmically and do not reflect any real economic activity or corporate performance.
Does Titan FX offer Synthetic Indices?
No. Titan FX focuses on real-market products, including CFDs on multiple major global stock indices such as the S&P 500, Nasdaq 100, and Dow 30. Prices for these indices are sourced from actual financial markets.
Conclusion
A Synthetic Index is a trading product whose price is generated algorithmically and does not originate from real financial markets. Understanding how these products differ from traditional stock indices helps traders better grasp the characteristics and potential risks of various trading instruments.
For investors who want to participate in real-market index trading, Titan FX offers stock index CFDs across major global markets, including the United States, Europe, and the Asia-Pacific region. Through these indices, traders can observe and take part in broader global equity trends from a macro perspective.