
 Home
Home- Investment Guide: Strategies for Stocks, Forex, and Metals
- How to Read the EA Forward Test Ranking
How to Read the EA Forward Test Ranking: Profitability, Profit Factor, Win Rate and Drawdown
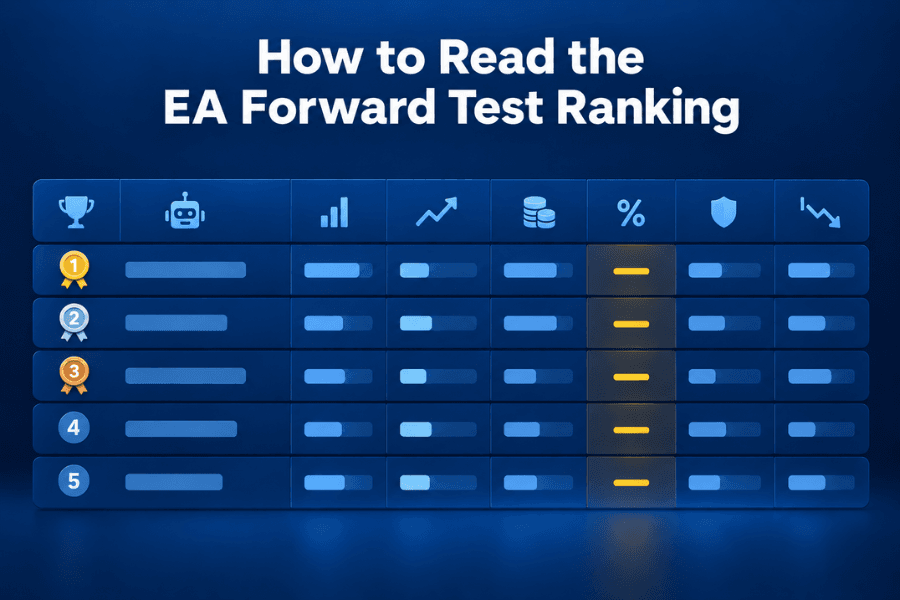
The EA Forward Test Ranking lists the EAs running live on Titan FX demo accounts and ranks them by five measures: profitability, total P&L, profit factor, win rate and drawdown. Every EA places orders against real-time prices on its own demo account, and its record builds up trade by trade.
At first glance the table looks like a list running from strongest to weakest, but each sort looks at a single measure. The page opens on the last 30 days, and the same EA can look very different over another period. The EA at the top of the profitability sort may be carrying open trades worth hundreds of thousands of yen in losses, and the one with the smallest drawdown may be losing money overall.
This article explains how each number in the table is calculated, what the dash in the profit factor column means, and which period to switch to and which fields to check on an EA's detail page. It closes with four steps for comparing EAs.
- Profitability tracks the change in account equity, floating P&L included; total P&L, profit factor and win rate count closed trades only
- A dash in the profit factor column can mean two different things, and the win rate column tells you which
- The ranking and the detail pages both open on the last 30 days, and switching to All can change the win rate and drawdown completely
- A 100% win rate alongside a deep drawdown means losing positions are still open
- Drawdown covers the selected period only, so EAs with short records and few trades tend to show small figures
- 1. What the EA Forward Test Ranking is and when to use it
- 2. Reading the columns: which numbers include open trades
- 3. What the dash in the profit factor column means
- 4. Switching periods on the detail page: trade count and open positions
- 5. Reading drawdown: the smallest figure can belong to a losing EA
- 6. Four steps for comparing EAs
- 7. Frequently Asked Questions
- 8. Summary
1. What the EA Forward Test Ranking is and when to use it
An EA (Expert Advisor, an automated trading program) usually goes through two kinds of testing before anyone trades it for real: a backtest, which replays historical data, and a forward test, which runs the EA on an account against live prices. The EA Forward Test Ranking is where Titan FX Research forward-tests the EAs it offers on demo accounts over long periods and tabulates the results.
Each EA's detail page states its forward test conditions, such as a TitanFX MT4 Demo Account (Standard), initial capital of 1,000,000 JPY and default settings, and some have been running since 2023. Every number in the table comes from the actual trade history of these accounts.
The ranking is most useful in three situations:
| Situation | What the ranking gives you | How to use it |
|---|---|---|
| You want to try an EA but do not know where to start | A list of the EAs currently running, with instrument and platform | Filter by platform and period, then open Details to check the trade count |
| You already run an EA and want to know whether it still works | The same EA's results over different periods | Switch periods and watch how the same EA's numbers change |
| You want to know whether an EA exists for a particular instrument | EA names usually include the instrument code | Look for the code in the EA Name/Symbol column |
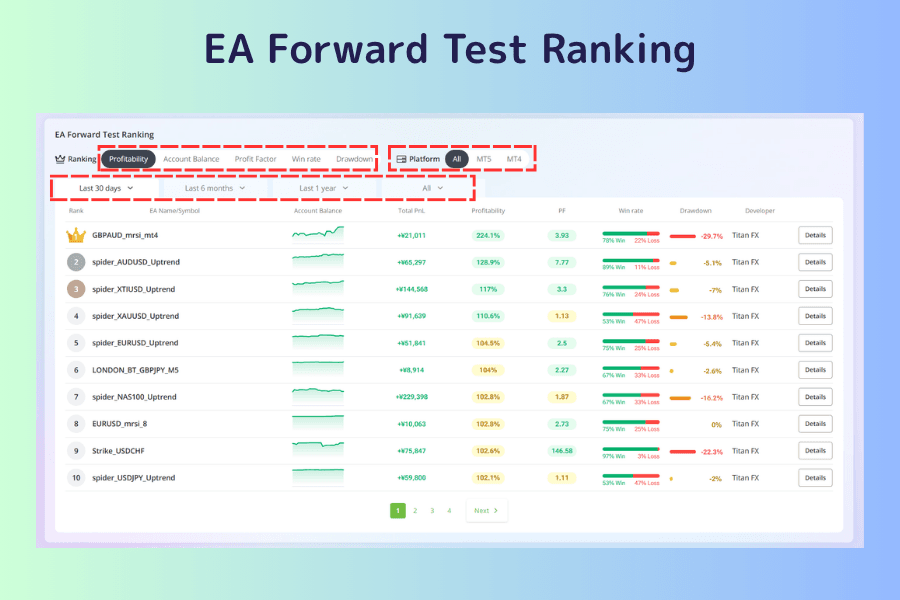
Above the table are three sets of controls: the five sort options, Platform (All, MT5, MT4) and the period (Last 30 days, Last 6 months, Last 1 year, All), with Last 30 days selected by default. Forward test results describe past performance, and a high rank does not guarantee future results.
Open the EA Forward Test Ranking2. Reading the columns: which numbers include open trades
The table has six numeric columns. The first thing to sort out when reading them is whether a number includes positions that have not been closed yet.
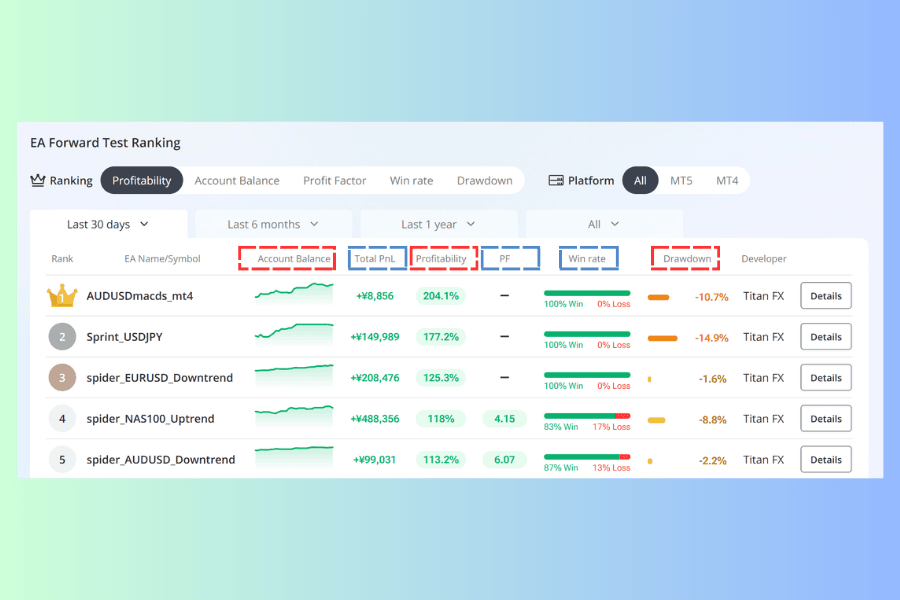
Numbers that include floating P&L: Account Balance, Profitability, Drawdown
The Account Balance column is a small chart. Each EA runs on its own demo account, funded with virtual initial capital (1,000,000 JPY, for example) when the forward test began, not real money. Every closed trade adds to or subtracts from that amount.
The chart records one point a day, and the last point also includes the unrealized P&L of open positions. So although the column is labeled Account Balance, what it really shows is account equity: the settled balance plus the floating profit or loss on trades still open.
Profitability is the end of this line divided by its start. AUDUSDmacds_mt4, first in the profitability sort, saw its equity climb from 316,121 JPY back to 645,360 JPY over the last 30 days, a profitability of 204.1%. Its initial capital was 1,000,000 JPY, so that 204.1% reflects equity recovering from a deep hole, and has little to do with how much the EA earned on trades it closed during the period.
Drawdown is the largest fall in that same equity line from a high. Floating losses show up in this column directly.
Numbers based on closed trades only: Total PnL, Profit Factor, Win rate
Total PnL is the combined result of the trades closed during the period. For the same AUDUSDmacds_mt4, total P&L over the last 30 days was only +8,856 JPY, far from the equity-doubling profitability figure.
Profit factor (PF) is gross profit divided by gross loss, and win rate is the share of trades that closed at a profit. Both look at closed trades only. A losing trade has no effect on either PF or win rate for as long as it stays open.
When profitability and total P&L are far apart, or the win rate is high but the drawdown is deep, the cause is almost always positions that have not been closed.Changing the period changes every column
Switching periods recalculates every column, not just the ranking. An EA with a perfect record and a shallow drawdown over the last 30 days can show a very different win rate and drawdown once you switch to All.
Each of the five sort options ranks by a single column, so changing the sort usually changes the EA in first place too. The figures update continuously, so compare two EAs under the same period setting.
3. What the dash in the profit factor column means
PF is a division, so when either gross profit or gross loss is zero, the PF column shows a dash instead of a number. The win rate column tells you which case it is:
| PF column | Win rate column | What it means |
|---|---|---|
| — | 100% Win, 0% Loss | No losing trades closed during the period |
| — | 0% Win, 100% Loss | No winning trades closed during the period |
Most of the dashes you see in the ranking are the first case.
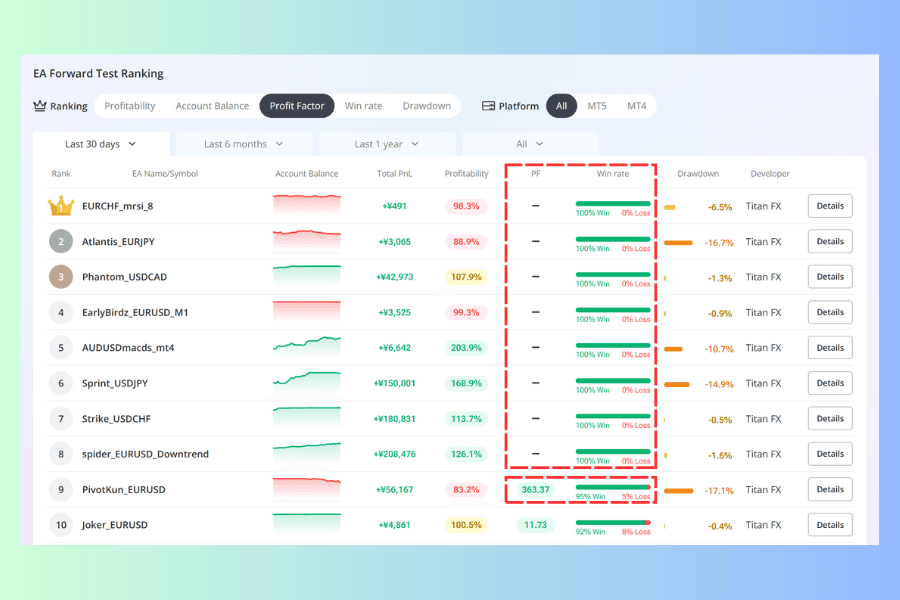
On the detail page, the first kind of dash appears as 1000000. That is a value the system fills in, not a profit a million times the loss. As a result, sorting by profit factor puts these EAs above every EA with an actual figure, and the top of the win rate sort is made up of almost the same names.
What those two sorts really list at the top are EAs that have not yet closed a losing trade in the selected period. Their real risk only becomes visible in the open positions on the detail page.
4. Switching periods on the detail page: trade count and open positions
The list has no number of trades column, and it does not show open positions. Both are on the detail page, reached through the Details button at the right end of each row.
The detail page also lets you switch periods, and it too opens on the last 30 days. Take Phantom_USDCAD as an example:
| Period | Number of trades | Win rate | Profit factor | Maximum drawdown |
|---|---|---|---|---|
| Last 30 days | 10 | 100% | 1000000 | -0.2% |
| Last 6 months | 63 | 100% | 1000000 | -26.4% |
| Last 1 year | 213 | 91.5% | 6.77 | -40.9% |
| All | 617 | 94.2% | 12.32 | -40.9% |
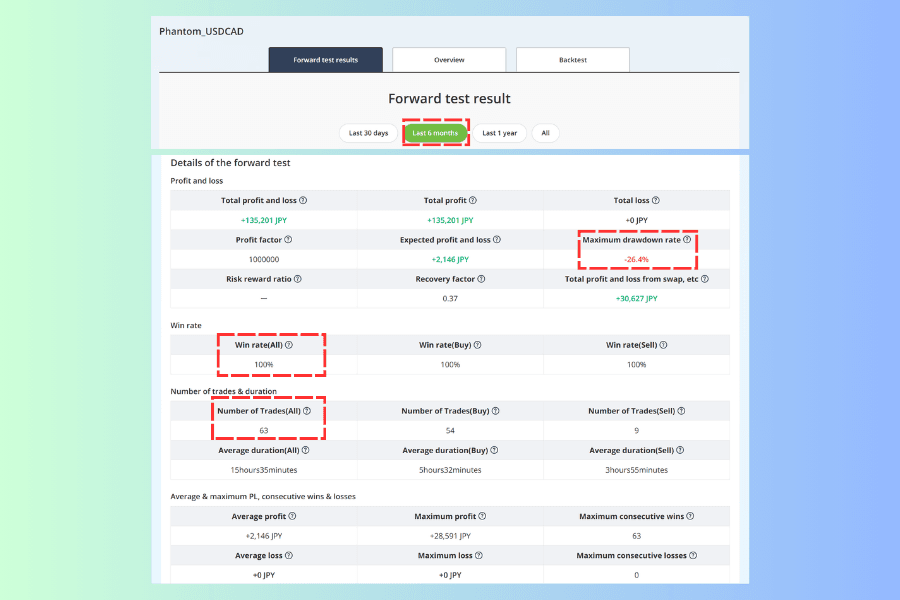
Ten winning trades over the last 30 days is too small a sample to tell you anything. Over the last six months the EA won all 63 trades, yet its maximum drawdown was -26.4%. Not a single losing trade was closed in that period, but equity still fell a quarter from its high, and that fall can only have come from losing positions that were still open.
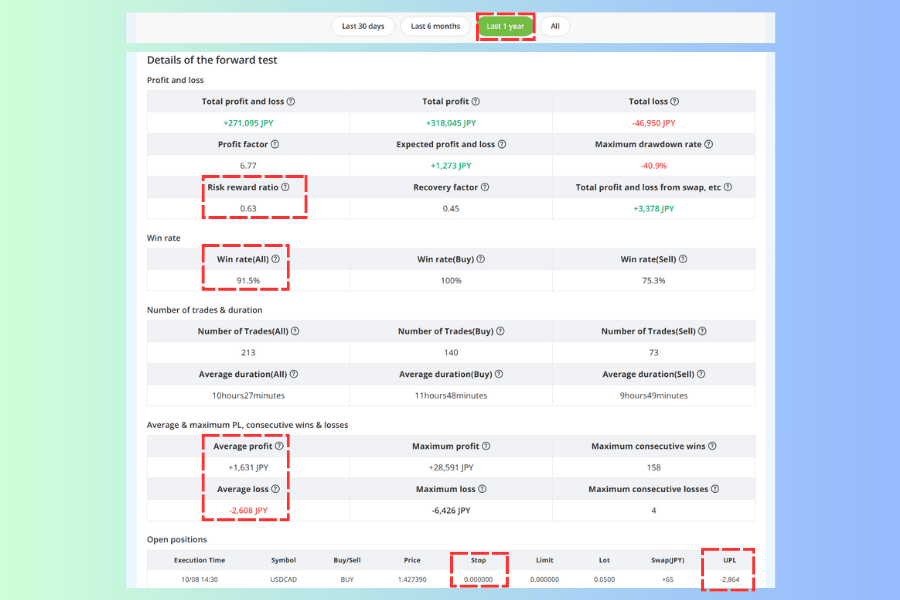
Stretch the window to a year and the losing trades appear: a 91.5% win rate, an average profit of +1,631 JPY against an average loss of -2,608 JPY, and a largest single loss of -6,426 JPY. The EA wins often, but each loss is bigger than each win, which is what the 0.63 in the Risk reward ratio field is telling you.
The Open positions table at the bottom of the page lists trades that are still open, with their stop price and UPL (unrealized P&L). A Stop of 0 means no stop-loss is set on that trade. AUDUSDmacds_mt4, mentioned earlier, is holding several trades opened back in April and May; one of them alone shows an unrealized loss of -277,263 JPY, and its Stop is 0 as well.
Two more fields on the detail page affect how you read the results.
Forward test conditions state the type of demo account, the time frame, the initial capital and whether the parameters are default settings. If the parameters or account conditions differ, results for the same EA cannot be compared directly.
Total profit and loss from swap, etc. separates out the financing cost, or swap. Of Phantom_USDCAD's +42,973 JPY total P&L over the last 30 days, +6,260 JPY came from this line. The longer an EA holds its trades, the more this field matters to total P&L.
5. Reading drawdown: the smallest figure can belong to a losing EA
Drawdown measures how far equity fell from a high, and it says nothing about whether the EA is making money. An EA that trades small and rarely will show a small drawdown for that reason alone.
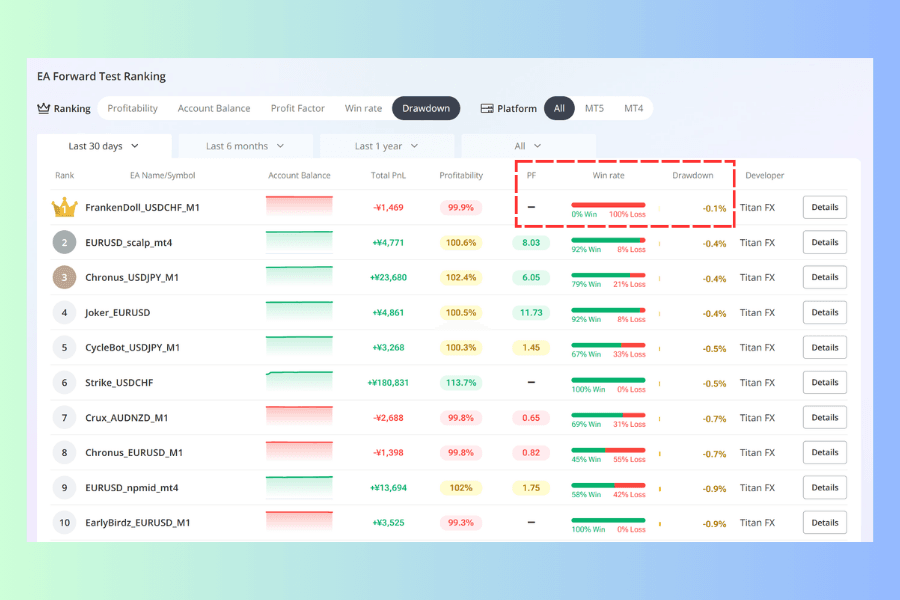
FrankenDoll_USDCHF_M1, first in the drawdown sort, has a drawdown of just -0.1%, yet its win rate reads 0% Win, 100% Loss, and the dash in its PF column is the second case in the previous section's table. Its detail page shows only two trades over the last 30 days, both losers; switch to All and it has 189 trades, a PF of 0.98 and a total P&L of -3,697 JPY, a small but steady loss over the long run.
The top ten of the same sort also includes EAs with a PF of 0.65 and 0.82. A PF below 1 means gross loss exceeds gross profit, so these EAs are losing too, only gently.
Drawdown also covers the selected period only. AUDUSDmacds_mt4 shows -10.7% over the last 30 days and -85.5% over All. The shorter the period and the fewer the trades, the more a historical drawdown figure understates how deep the EA can fall when the market turns against it.
6. Four steps for comparing EAs
When profitability, profit factor, win rate and drawdown point in different directions, work through them in this order.
-
① Switch to All and check the sample and running time. On the detail page, look at the number of trades and the forward test start date. Read the trade count against the strategy's time horizon: a few dozen trades a year is thin for a short-term EA that holds positions for a dozen minutes, while the same count can be reasonable for one that holds for days.
-
② Check open positions and maximum drawdown. If the win rate is high but the drawdown is deep, look for large unrealized losses among the open positions and check whether the Stop column reads 0. This step decides whether the win rate and PF can be taken at face value.
-
③ Read win rate alongside average profit and average loss. A win rate above 90% with an average loss bigger than the average profit means a handful of losers can wipe out a large share of the gains. The risk reward ratio on the detail page gives you the same comparison directly.
-
④ Put the survivors into a simulator. The ranking shows one EA at a time, but in practice traders usually run several together. The FX/CFD Equity Projection Simulator combines several EAs into a single equity curve. A combined historical curve is no guarantee of future results either.
For the main types of EA and what a VPS is for, see Key Types of EA Forex Trading Programs.
7. Frequently Asked Questions
Q1: What is the difference between a forward test and a backtest?
A forward test runs on an account against live prices; a backtest replays historical data. The detail page has both, on separate tabs. A backtest's parameters can be adjusted again and again after the fact, so it tends to produce results that only fit past markets. A forward test cannot be adjusted afterward, but the forward tests in this ranking also run on demo accounts, so execution conditions still differ from a live account.
Q2: How long does a forward test need to run before it means something?
There is no fixed threshold. The practical test is whether the forward test period has covered different kinds of market, such as a clear trend and a long range, and whether the total number of trades is large enough. An EA that has run for years but made only a few dozen trades still has a small sample.
Q3: Will a demo account's results match a live account's?
Not exactly. The EA Terms of Use themselves note that market conditions and the communication environment can make demo forward test results differ from live trading results. Slippage, spread changes and execution delays on a live account do not match what happens in a demo environment.
Q4: How much drawdown is safe?
There is no universal threshold. The same -15% drawdown hits an account very differently depending on the lot size, so it has to be judged against your own capital. To estimate whether an account can survive, see Risk of Ruin: How It Is Calculated.
Q5: Can every EA in the ranking be downloaded?
EAs that can be downloaded have a download button and the EA Terms of Use at the bottom of the detail page, and you have to agree to the terms first. The terms state that the EAs are developed and provided by third parties, that Titan FX does not manage their trading results and that forward tests do not guarantee future returns, and they recommend thorough testing on a demo account before use.
8. Summary
The ranking opens on the last 30 days, and a 30-day window can easily line up with an EA's best stretch. A 100% win rate, a dash for PF and a doubled profitability figure can all come from an account that simply has not booked its losses yet.
When an EA catches your eye, open its detail page, switch the period to All and scroll down to the open positions. The trade count, the true maximum drawdown and any losing trades left open without a stop only come into view after those two steps.
Further Reading
- MQL5 Tutorial: Beginner's Guide to MT5 EA Programming
- What is Leverage Trading?
- How to Choose a Currency Pair: A Five-Step Screen
- Impact of Loss Cut and Strategies for Forex & CFD Traders
The financial markets research team at Titan FX. We produce educational content for investors across a broad range of instruments, including foreign exchange, commodities such as crude oil, precious metals and agricultural products, equity indices, US stocks and digital assets.
Primary Sources (by category)
- Pages and tools: Titan FX Research EA Forward Test Ranking, individual EA forward test result pages, FX/CFD Equity Projection Simulator (screen data as of October 9, 2026)
- Specifications: forward test conditions and EA Terms of Use on each EA's detail page