
 Home
Home- Investment Guide: Strategies for Stocks, Forex, and Metals
- How to Choose a Currency Pair: A Five-Step Screen
How to Choose a Currency Pair: Screening with the Currency Strength Meter and Four More Tools

This guide works through that sequence using the actual screens from the evening of 8 September 2026: the strength meter produces a candidate, the economic calendar clears the event risk, the volatility heatmap decides which hours to watch, the swap point calendar prices the overnight cost, and the correlation matrix checks the trade against what you already hold.
Each tool carries its own detailed guide. Rather than repeat those, this covers what the five answer once they are chained together.
- The strength meter compresses close to 60 pairs into a short candidate list; strongest × weakest is a screening result, not an entry signal
- The tool writes the pair as "JPYNZD", strongest first and weakest second; the platform symbol is NZDJPY, so what it points at is a short candidate
- Each period's scores are rebased to zero at the start of that period, so agreement means the direction matches — the figures cannot be subtracted to measure how long a trend has run
- A currency pair has two sides, and event risk has to be checked on both currencies
- The heatmap shows hours that have historically been active: NZDJPY peaks in the early Asian session, USDJPY during European and US hours
- The strength direction and the swap direction can point opposite ways, and the longer the hold, the more that cost deserves its own line
- Highly correlated pairs share a common currency factor, so multiple positions have to be assessed together
- 1. What the Currency Strength Meter Answers
- 2. Step One: Narrowing 59 Pairs to One Candidate
- 3. Step Two: Clearing Event Risk with the Economic Calendar
- 4. Step Three: Choosing the Hours with the Volatility Heatmap
- 5. Step Four: Pricing the Hold with the Swap Point Calendar
- 6. Step Five: Checking for Overlap with the Correlation Matrix
- 7. FAQ
- 8. Summary: After Five Steps, Back to the Chart
1. What the Currency Strength Meter Answers
An exchange rate is a ratio between two currencies. USDJPY rising on its own does not separate a strong dollar from a weak yen. The Currency Strength Meter takes the move over a chosen period for USD, EUR, JPY, GBP, AUD, NZD, CAD and CHF, subtracts the average of all eight from each, and turns interlocked quotes into eight independent scores. Positive is relatively strong, negative relatively weak, and the scores always sum to zero. The panel at the top also pairs the strongest with the weakest.
What it solves is a specific nuisance. The forex list in the swap point calendar runs to 59 pairs. Opening charts one by one to judge them takes a morning; the strength meter compresses those 59 into a single candidate in seconds.
That is also as far as it goes: which two currencies have separated the most, right now. Whether that candidate is worth taking, when to take it, what holding it costs, and whether it duplicates something you already own — none of those are its job. Each belongs to a different tool, and those are sections 3 through 6.
| The question | The tool |
|---|---|
| What scheduled events over the next few hours could overturn this reading | Economic Calendar |
| Whether this pair actually moves during the hours I can be at the screen | Volatility Heatmap |
| Whether the overnight interest is paid or received, and how much | Swap Point Calendar |
| Whether it overlaps a position I already hold | Correlation Matrix |
What follows runs the five steps on the screens from the evening of 8 September 2026. The figures on the tools change every minute; the sequence is the part that keeps.
None of these five tools tells you to enter now. What the five steps leave you with is a candidate worth opening a chart to analyze further. Entry price, stop placement and position size still come from the price chart and your money management rules.
2. Step One: Narrowing 59 Pairs to One Candidate
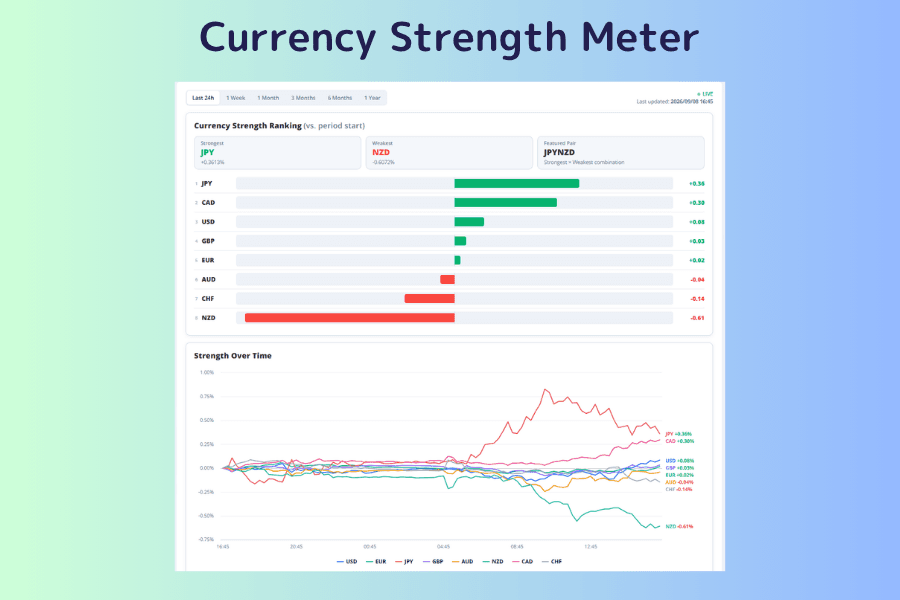
The Last 24 Hours screen from the evening of 8 September: JPY strongest, NZD weakest, and the tool pairs the two into a watch pair directly.
The distribution of the bars is what to read. The top four green bars run to similar lengths, separated by a tenth of a point or so, with nothing standing out. The NZD bar at the bottom, in red, is visibly longer than the rest and sits close to half a point below seventh place. What was sold hardest over these 24 hours was the New Zealand dollar; the yen merely held its ground.
"JPYNZD" Is Called NZDJPY on the Platform
The tool prints JPYNZD as the Watch Pair. That format puts the strongest first and the weakest second, while the symbol on the trading platform is NZDJPY — the reverse order. What it points at is therefore a short candidate in NZDJPY.
The order is easy to read backwards, so watch for it the first time. The tool is saying "buy the strongest, sell the weakest"; before placing anything, confirm which way round the pair is quoted on your platform.
Reading Three Periods Together
Looking only at 24 hours leaves you exposed to a one-off jump. Switch to 1 Week and 1 Month and check each:
| Period | Strongest | Weakest | Second |
|---|---|---|---|
| Last 24 hours | JPY | NZD | CAD |
| 1 week | JPY +3.25 | NZD -1.42 | AUD +0.40 |
| 1 month | JPY +1.76 | NZD -1.46 | AUD +1.46 |
All three periods put JPY and NZD at the ends, so the direction agrees. The strength does not hold still, though. Over one week JPY is +3.25, clear of AUD's +0.40 by 2.85 — that week really was a yen move. Over one month JPY +1.76 and AUD +1.46 sit almost level. And over the last 24 hours the yen's lead has narrowed to well under a point.
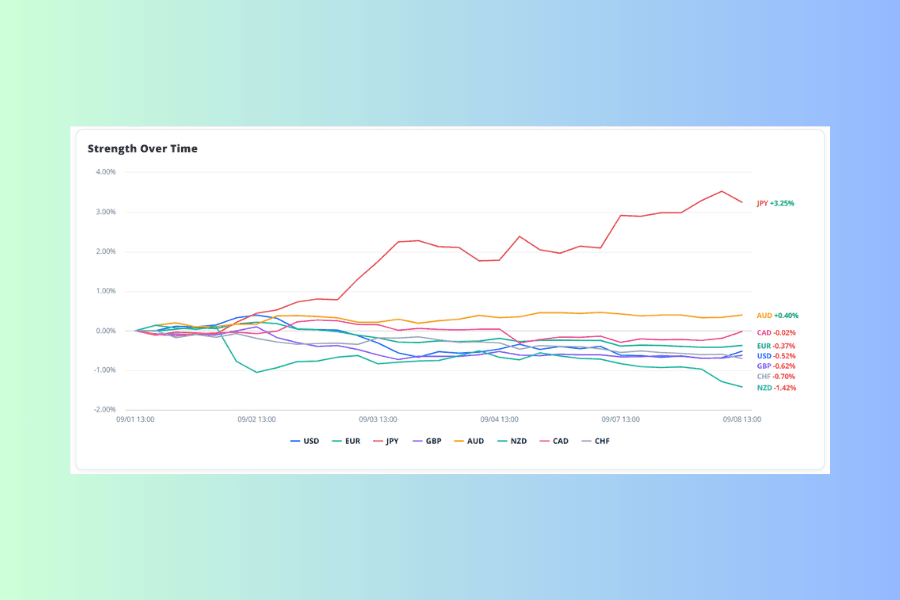
The chart makes the sequence plain: the yen went nowhere through 1 and 2 September, then ran to around 3.5%, and gave some back in the final stretch.
There is one reading trap here. Each period's scores are rebased to zero at the start of that period. The +1.76 over a month and the +3.25 over a week start from different points, so subtracting one from the other tells you nothing about how many days a trend has run. What the figures do support is narrower: the yen's relative gain is concentrated in the recent stretch, and on the 24-hour board it has already begun to fade. "First place across all three periods" is a different claim from "this trend has run steadily for a month".
The Tool's Own Instructions Live on the Tool Page
A full guide sits at the bottom of the tool page: three key terms, the calculation steps behind the strength score, how to read each element of the chart, four common patterns (high trend potential, range-prone, strength reversal, short and long term aligned), plus dos and don'ts, an FAQ and a glossary. None of that is repeated here — to learn the tool itself, that guide is the fastest route.
Open the Currency Strength Meter3. Step Two: Clearing Event Risk with the Economic Calendar
The strength meter reports a result and says nothing about what happens next. A currency pair also has two sides: risk in NZDJPY comes from the yen and the New Zealand dollar alike, so both countries have to be checked.
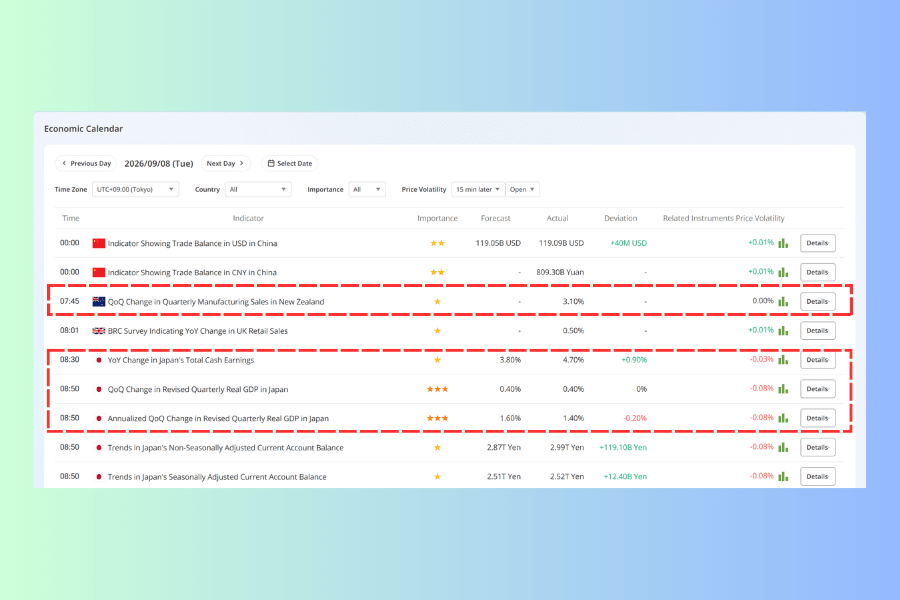
The schedule on both sides for 8 September looked like this:
| Time | Country | Indicator | Importance | Forecast | Actual |
|---|---|---|---|---|---|
| 07:45 | New Zealand | Quarterly manufacturing sales, QoQ | ★ | - | 3.10% |
| 08:30 | Japan | Monthly labour survey, total cash earnings, YoY | ★ | 3.80% | 4.70% |
| 08:50 | Japan | Quarterly real GDP, revised, QoQ | ★★★ | 0.40% | 0.40% |
| 08:50 | Japan | Quarterly real GDP, revised, annualised | ★★★ | 1.60% | 1.40% |
One ★ release on the New Zealand side against three crowded into a single morning on the Japanese side. Total cash earnings at 4.70% came in well above forecast, which is usually read as supporting policy normalisation and therefore as yen-positive. Twenty minutes later, annualised GDP at 1.40% undershot the 1.60% forecast.
Anyone who saw yen strength after 08:30 and chased it could have been pushed back at 08:50. The point of checking the calendar is not to predict direction but to know which moment carries the most risk.
Looking a few days ahead: neither Japan nor New Zealand has a ★★★ item on 9 or 10 September, and the main events on the evening of the 10th are the ECB rate decision and US PPI. That means less known scheduled risk, which is not the same as low market risk. Off-calendar remarks from central bank officials, geopolitical headlines and general risk sentiment never appear on it.
Open the Economic Calendar How to Read the Calendar4. Step Three: Choosing the Hours with the Volatility Heatmap
The right direction in the wrong hours produces nothing. Enter while the market is still and both the stop and the target simply sit there.
The volatility heatmap uses a year of data to average the price range for every day-of-week and hour combination. Put NZDJPY and USDJPY side by side and the dark cells sit in completely different places, even though both are yen crosses.
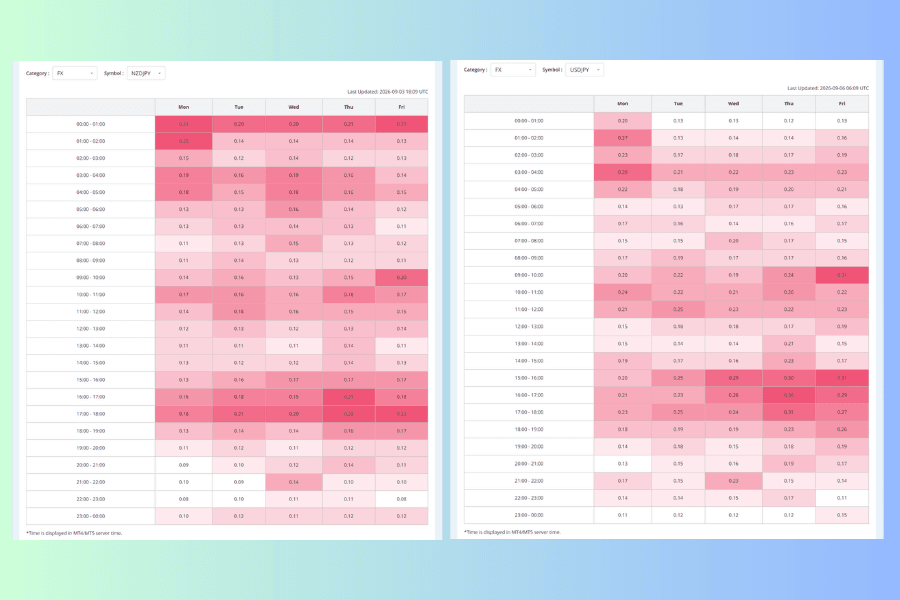
For NZDJPY on the left, the most active hour is platform time 00:00 - 01:00, roughly the early Asian session. That follows: the New Zealand dollar is a Pacific-timezone currency and this is its home stretch. Figures are in yen, and one pip is 0.01 yen, so 0.20 means 20 pips.
| Platform hour | Mon | Tue | Wed | Thu | Fri |
|---|---|---|---|---|---|
| 00:00 - 01:00 | 0.24 | 0.20 | 0.20 | 0.21 | 0.21 |
| 09:00 - 10:00 | 0.14 | 0.16 | 0.13 | 0.15 | 0.20 |
| 17:00 - 18:00 | 0.18 | 0.21 | 0.20 | 0.22 | 0.23 |
| 22:00 - 23:00 | 0.08 | 0.10 | 0.11 | 0.11 | 0.08 |
USDJPY on the right peaks at platform time 16:00 - 17:00 during European and US hours (0.36 on Thursday), and that same early Asian session is one of its quieter stretches.
| Platform hour | NZDJPY | USDJPY |
|---|---|---|
| 00:00 - 01:00 | 0.20 - 0.24 | 0.12 - 0.20 |
| 09:00 - 10:00 | 0.13 - 0.20 | 0.19 - 0.31 |
| 16:00 - 17:00 | 0.16 - 0.21 | 0.21 - 0.36 |
The hours you can actually be at the screen decide which of these two suits you.
The two panels carry last-updated stamps a few days apart (3 September for NZDJPY, 6 September for USDJPY) because each symbol is recalculated separately. Both sample a full year, so a few days moves the annual average by a rounding digit at most.
One more thing about what this chart is. It answers "when does this usually move", not "when is there certain to be an opportunity". A wide range helps a move develop, and it also means stop distances, spreads and short-term noise widen with it. For the underlying concept, see Volatility.
One Note on Converting the Times
The times shown are MT4/MT5 platform time. A note below the table adds that while the United States is on daylight saving time, the real clock time is one hour earlier than the table's second line suggests.
September falls inside daylight saving, so the row printed against 07:00 - 08:00 actually corresponds to 06:00 - 07:00. An hour's drift is enough to miss the move entirely.
Open the Volatility Heatmap5. Step Four: Pricing the Hold with the Swap Point Calendar
If the trade is going to be carried overnight, swap becomes a fixed daily cost or credit.
Selling NZDJPY means selling the New Zealand dollar and buying the yen. New Zealand rates sit above Japanese rates, and selling the higher yielder to buy the lower one puts you on the paying side. The direction the strength meter points at and the direction the swap favors can be opposites, and this step exists to put a number on that.
Open the swap point calendar and set the symbol to NZDJPY, the currency to JPY and the month to September 2026.
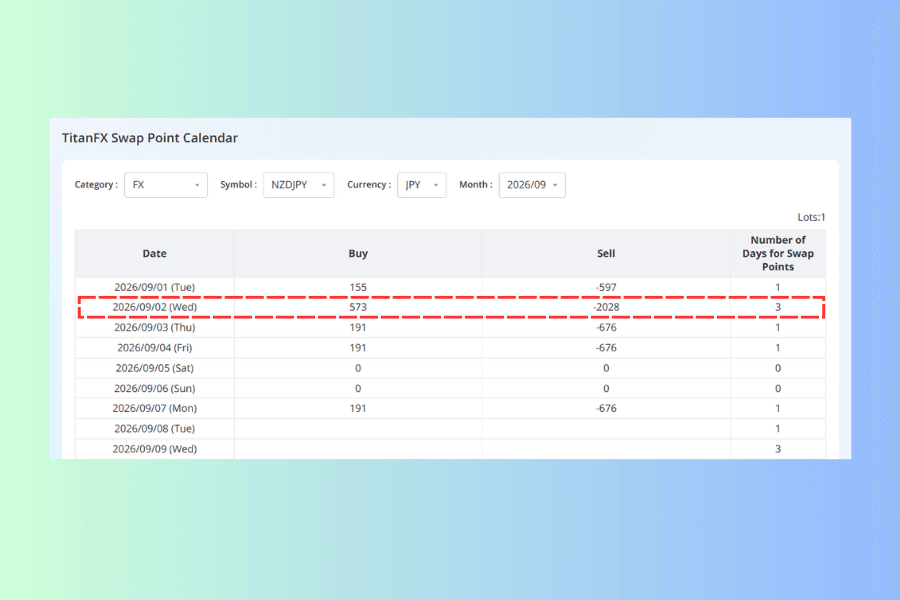
| Date | Buy | Sell | Days |
|---|---|---|---|
| 09/01 (Tue) | 155 | -597 | 1 |
| 09/02 (Wed) | 573 | -2,028 | 3 |
| 09/03 (Thu) | 191 | -676 | 1 |
| 09/04 (Fri) | 191 | -676 | 1 |
| 09/07 (Mon) | 191 | -676 | 1 |
Carrying the short side through a full week costs 597 + 2,028 + 676 + 676 + 676, or 4,653 yen. On one lot a pip is 1,000 yen, so a week of interest works out at roughly 4.7 pips.
NZDJPY's daily range runs somewhere between 80 and 100 pips, so 4.7 does not look large against a single day. Whether it is worth carrying, though, only becomes clear alongside the strategy's expected return, its stop distance and the number of days you plan to hold. It accumulates as the hold lengthens, and the Wednesday row carries a day count of 3 — two pips gone in one day. Which weekday takes the triple charge differs by instrument.
The buy side, conversely, receives 191 yen a day, which is the basic form of a carry trade. The strength meter pointing one way and the interest differential the other is a common enough situation.
Open the Swap Point Calendar How to Check Swap Points6. Step Five: Checking for Overlap with the Correlation Matrix
The last check has nothing to do with this pair on its own and everything to do with what you already hold.
The correlation matrix's instrument correlation ranking takes any symbol and lists its twenty highest correlations across the whole instrument set. With NZDJPY as the base and the period set to one month:
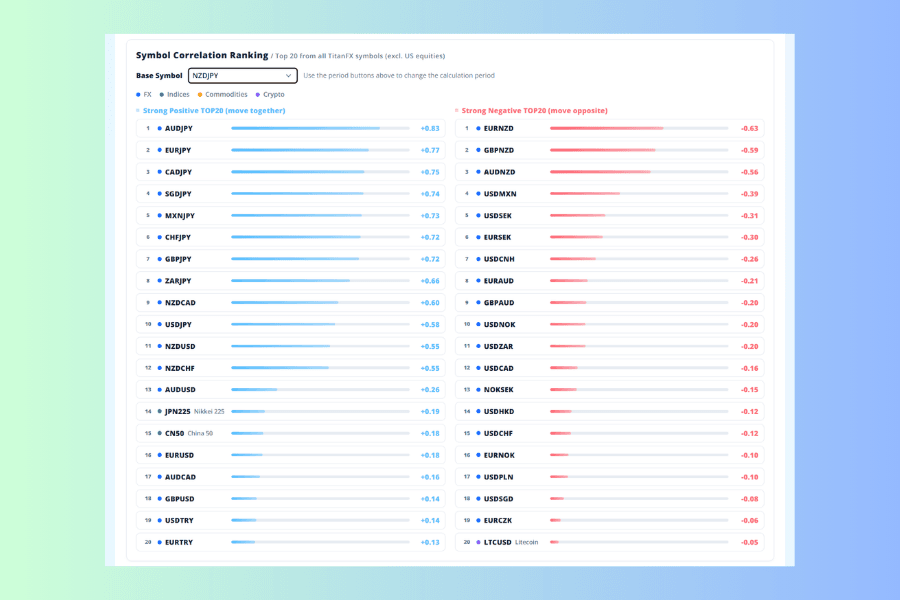
| Rank | Instrument | Coefficient |
|---|---|---|
| 1 | AUDJPY | +0.83 |
| 2 | EURJPY | +0.77 |
| 3 | CADJPY | +0.75 |
| 4 | SGDJPY | +0.74 |
| 5 | MXNJPY | +0.73 |
| 6 | CHFJPY | +0.72 |
| 7 | GBPJPY | +0.72 |
| 8 | ZARJPY | +0.66 |
All eight are yen crosses. Shorting NZDJPY, AUDJPY and EURJPY at once looks like three separate pairs, and every one of them contains the same long-yen factor. While correlations stay high, a turn in the yen takes all three together, and the combined exposure is far more concentrated than "three trades" sounds.
Among Highly Correlated Candidates, Compare the Cost
Given how closely these track each other, the step-four calculation can be applied to AUDJPY and set against it (yen basis, one lot):
| Weekly interest cost | In pips | |
|---|---|---|
| Short NZDJPY | 4,653 yen | about 4.7 pips |
| Short AUDJPY | 8,027 yen | about 8.0 pips |
The two correlate at +0.83 and move almost in step, yet holding AUDJPY costs seventy percent more. All that establishes is which is cheaper to hold — spread, liquidity, stop distance and technical position have not been compared at all, and one line item is not enough to call either the better trade.
For how the coefficient is calculated and which pairings recur, see What Is Currency Correlation? Patterns, Risk & Titan FX Tools.
Open the Correlation Matrix7. FAQ
Q1: How high does a strength score have to be to count as "strong enough"?
The tool sets no threshold, because the magnitude of the scores changes with the period. Rather than the absolute value, look at where the gaps between places fall. On the 24-hour board for 8 September the top four bars run to similar lengths, with nothing standing out; the bar for NZD in last place is visibly longer than the rest. On a board shaped like that, the candidate's value comes from the New Zealand dollar side, with the yen as a supporting player.
Q2: Do all five steps have to be run every time?
Steps one and two are worth running every time. The active hours in step three barely change across a year for the same pair, so once you have seen them, they are worth remembering rather than rechecking. Step four matters when you intend to carry the position. Step five means something only when you already hold something else.
Q3: What if the three periods disagree?
Disagreement does not necessarily mean a reversal — only that short-term and long-term relative strength are not aligned. Go back to the strength-over-time lines and see whether this is a short-term correction, momentum shifting, or two lines genuinely crossing, then confirm on the price chart. Treating a ranking mismatch on its own as a turn tends to get you in too early.
Q4: Does this sequence only work for forex?
The strength meter covers eight major currencies, so step one is limited to forex. The other four are not: the volatility heatmap, the swap point calendar and the correlation matrix all cover indices, commodities, US stocks and crypto as well.
Q5: What if the strength meter and a technical signal disagree?
The two answer different questions. The strength meter is doing screening; the technicals decide where to get in and out. A disagreement usually means the candidate is not yet at the stage of acting on, and leaving it on a watchlist is the safer call.
Q6: Which period should the correlation coefficient be read over?
Match the main period roughly to how long you plan to hold — one month for a few days to a few weeks. Then compare against a longer window. If one month is high and three months is low, that synchrony is coming from a recent event and may not last.
8. Summary: After Five Steps, Back to the Chart
| Step | Tool | Question | The answer on 8 September |
|---|---|---|---|
| 1 | Currency Strength Meter | Which two currencies have separated the most | JPY strongest, NZD weakest, direction agreeing across three periods; candidate is short NZDJPY |
| 2 | Economic Calendar | What is scheduled on each side | Three Japanese releases and one from New Zealand on the morning of 9/8; no ★★★ on either side afterwards |
| 3 | Volatility Heatmap | Does it move in the hours I can watch | Peak at platform time 00:00 - 01:00, the early Asian session |
| 4 | Swap Point Calendar | What does carrying it cost | About 4.7 pips a week on the short side, triple charge on Wednesday |
| 5 | Correlation Matrix | Does it overlap what I hold | The top eight are all yen crosses; AUDJPY correlates at +0.83 |
The whole sequence takes about ten minutes, and the order does not rearrange: there is no cost to discuss before there is a candidate, and no point choosing hours before the events are known.
What you finish with is a candidate that has passed the screen. Entry price, stop placement and position size are decided back on the price chart. Every figure here is a snapshot from 8 September 2026 and the live values update every minute; the part worth keeping is the five questions and which tool answers each one.
Further Reading
- Titan FX Market Analysis Tools: Finding the Right One at Each Step of a Trade
- How to Download Historical Data: One-Minute Bar CSV, Account Type and Importing into MT4 and MT5
- Forex Trading Strategy: A Complete Guide for Beginners to Build and Execute
- What Is Market Sentiment? How It Drives Forex and CFD Markets
- The 2% Rule: Risk Management and Position Sizing for Beginners
Titan FX Trade Strategy Research Lab. We create educational content across a broad range of financial instruments, including forex (FX), commodities (crude oil, precious metals, agricultural products), stock indices, US equities, and crypto assets, for investors.
Primary Sources (by Category)
- Strength data: Titan FX Research Currency Strength Meter, the last 24 hours, one week and one month rankings and the strength over time chart for 8 September 2026
- Event data: Titan FX Research Economic Calendar, Japanese and New Zealand entries for 7 to 10 September 2026
- Volatility data: Titan FX Research Volatility Heatmap, average hourly range over the past year for NZDJPY (updated 2026-09-03 18:09 UTC) and USDJPY (updated 2026-09-06 06:09 UTC)
- Swap data: Titan FX Research Swap Point Calendar, yen-basis figures for NZDJPY and AUDJPY in September 2026
- Correlation data: Titan FX Research Correlation Matrix, instrument correlation ranking with NZDJPY as the base over a one-month period, updated 8 September 2026