
 Home
Home- Investment Guide: Strategies for Stocks, Forex, and Metals
- How to Download Historical Data: CSV, Account Type, Import
How to Download Historical Data: One-Minute Bar CSV, Account Type and Importing into MT4 and MT5
Four settings and the file is yours; the download itself is not the hard part. What this guide covers is everything after it: what the file actually contains, how to import it, and why the same stretch of market produces different backtest results depending on the account type.
What follows works through the four groups of settings, why account type and trading costs have to be aligned, and how to import into MT4 and MT5 afterwards.
- What you get is a one-minute bar CSV, with a separate symbol list behind each of the five asset categories
- Set Account Type to the one you actually trade, but price data is not trading cost — commission, swap and slippage all have to be configured separately in the tester
- Micro uses a different lot specification from Standard and Blade, so confirm the contract size before backtesting on fixed lots
- One-minute bars suit strategy screening, but open-high-low-close cannot tell you whether price reached your stop or your target first within the same bar
- The download has to be imported into MT4 or MT5 to be usable; both import guides are linked at the bottom of the page
- To look up a rate on a particular day rather than run a backtest, there is a different tool for that
1. What This Tool Does
This page supplies Titan FX's own historical prices, downloadable as a one-minute bar CSV. It serves one purpose above all: backtesting — taking a set of trading rules, running them through past market data, and seeing whether they would have made or lost money at the time.
A backtest is only as good as two things: price data fine enough for the strategy, and conditions that match the environment you actually trade in. Free historical data is everywhere, but most of it comes from other platforms, where the price source, server time and trading conditions may all differ. Results obtained there do not necessarily carry over to a live Titan FX account.
Three situations where it earns its place:
-
You have an EA or a set of entry and exit rules and want to know how they behaved in past markets
-
You are moving a strategy to Titan FX and want to re-run it on the platform's own price data first
-
You are choosing between a Standard and a Blade account and want to see what the cost difference actually does to this particular strategy
What it does not do is equally clear. There is no tick data finer than one minute, and it does not run the backtest for you — the download has to be imported into your platform.
One-minute bars suit strategy screening and mid-to-low frequency backtests. Where stops and targets sit close together, open-high-low-close cannot tell you which side price touched first inside the same bar. Treat backtest results for that kind of strategy conservatively rather than as a precise execution simulation.
2. Where to Open It
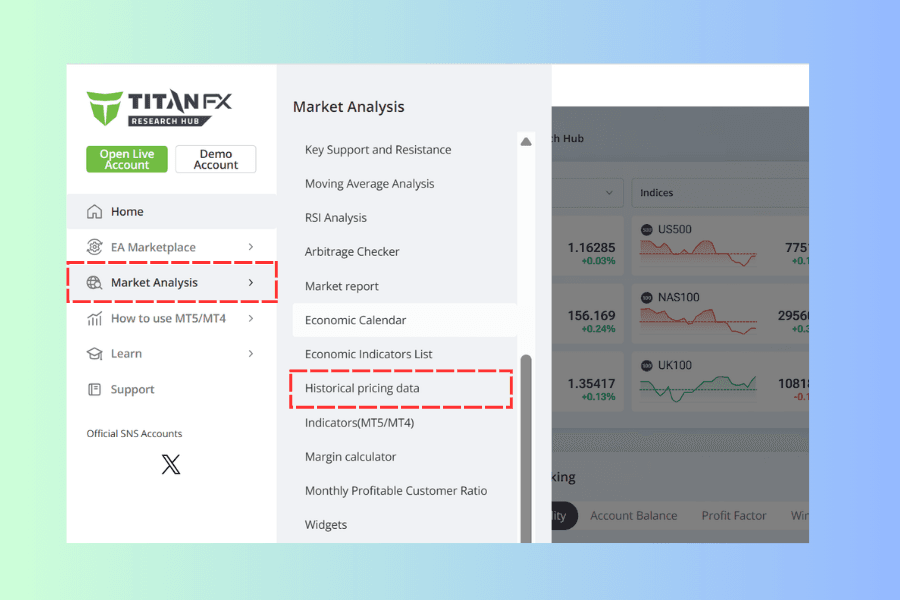
From the Titan FX Trade Strategy Research Lab menu, open Market Analysis and select Historical pricing data from the list.
3. The Four Settings to Confirm
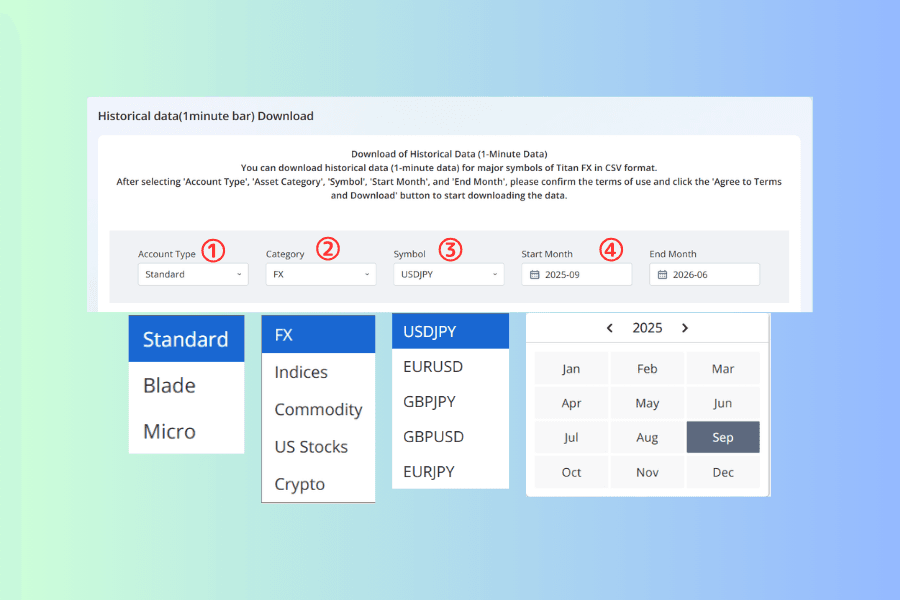
The four groups correspond to ① to ④ in the image below.
① Account Type
Standard, Blade or Micro. This is the setting people get wrong most often and the one that matters most, so section 4 takes it on its own.
② Category and ③ Symbol
The second dropdown is labelled Category on the page. It splits into FX, Indices, Commodity, US Stocks and Crypto, and switching it replaces the Symbol list with that category's instruments. Pick whichever one you intend to test.
④ Start Month and End Month
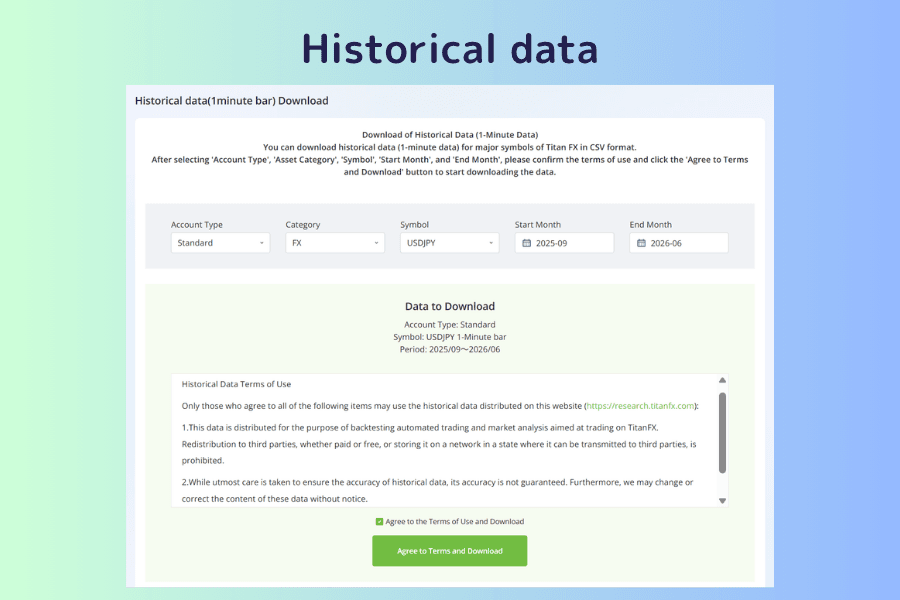
The range is set by calendar month; the two fields count as one group. Fill both and the summary line in the middle shows the account type, symbol and period. Reading that line before downloading is quicker than discovering a wrong selection afterwards.
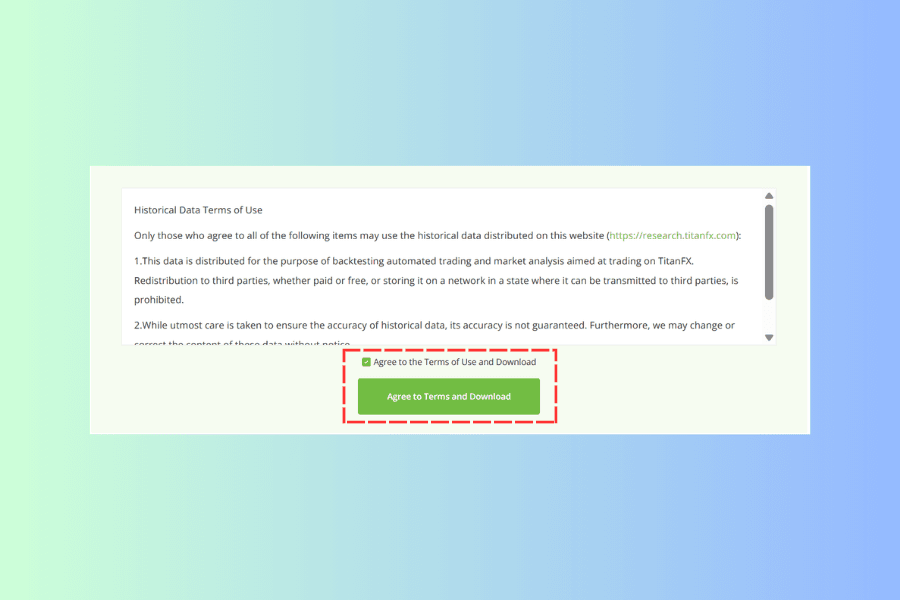
With all four confirmed and the terms of use accepted, the Agree to Terms and Download button becomes active. Until then it stays disabled.
4. Why Account Type and Trading Costs Have to Be Aligned
The three accounts carry different trading conditions. Standard puts all cost into the spread and charges no separate commission. Blade compresses the spread to as little as 0.0 points and charges 3.5 US dollars per lot each way, 7 dollars round turn, instead. Micro uses a micro-lot design with a different minimum trade size from the other two.
Choosing the account type you actually trade is the basic alignment step before a backtest. It does not, however, mean the costs are now accounted for.
Price data and trading cost are two different things. What you receive is a price series; commission, swap and slippage all have to be configured in the backtesting software. Take a Blade account: 20 round turns a day at one lot each is 140 US dollars in commission alone, close to 2,800 across twenty trading days. If that figure never reaches the tester's settings, net performance comes out overstated even when the price data matches the account.
Micro needs one further check. Its lot specification differs from Standard and Blade, so a testing program that keeps the same "1 lot" setting without aligning the contract size will have position size and profit and loss out by a wide margin.
The order of operations in practice: select price data matching your account type → align the contract specification → add commission and swap in the tester → run the backtest → validate with forward testing.
5. After the Download: Importing and Checking
A CSV cannot be backtested as it stands; it has to go into the platform first. Two official guides sit at the bottom of the page: How to Import Historical Data into MT5 (Windows) and How to Import Historical Data into MT4 (Windows). The import path differs between the two platforms, so follow whichever applies.
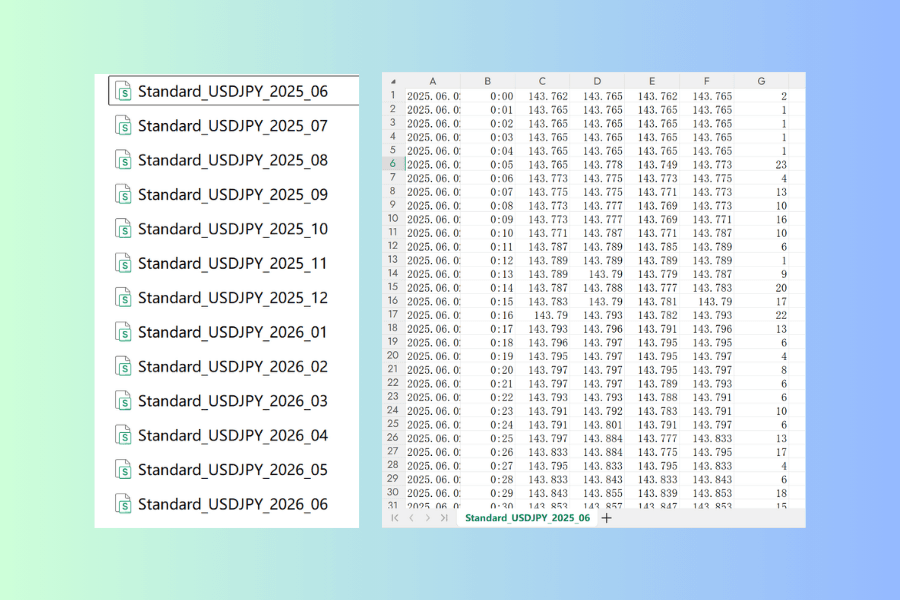
Open the files before importing. Select a range spanning several months and you get one file per month, named in the pattern account type, symbol, year, month. Each file runs left to right as date, time, open, high, low and close, with a final column giving the number of ticks in that minute.
Once open, check that dates and times look right, that there are no missing values or duplicate rows, and that the monthly files cover the whole period you selected. A problem in the source file is far more awkward to find after importing than before.
After importing, spot-check once more. Pick a trading day you remember and compare the highs and lows on the chart against what actually happened. Pay particular attention to timestamps against the platform's server time — a mismatched time base puts events on the wrong bar, while a wrong format or period setting shows up as missing bars or an odd data range. Neither raises an error in the backtest; they just quietly distort the numbers.
There is one more step after the backtest finishes. Historical data can show that a set of rules held up in the past, but it cannot reflect slippage, disconnections or shifts in liquidity in a live environment. Running a stretch of forward testing afterwards, validating the same rules against live prices, is the piece to add before acting on any backtest result.
6. Backtest Data Versus Historical Rates
When the question is simply what USDJPY closed at on 7 August 2026, a one-minute CSV is far more than the job needs.
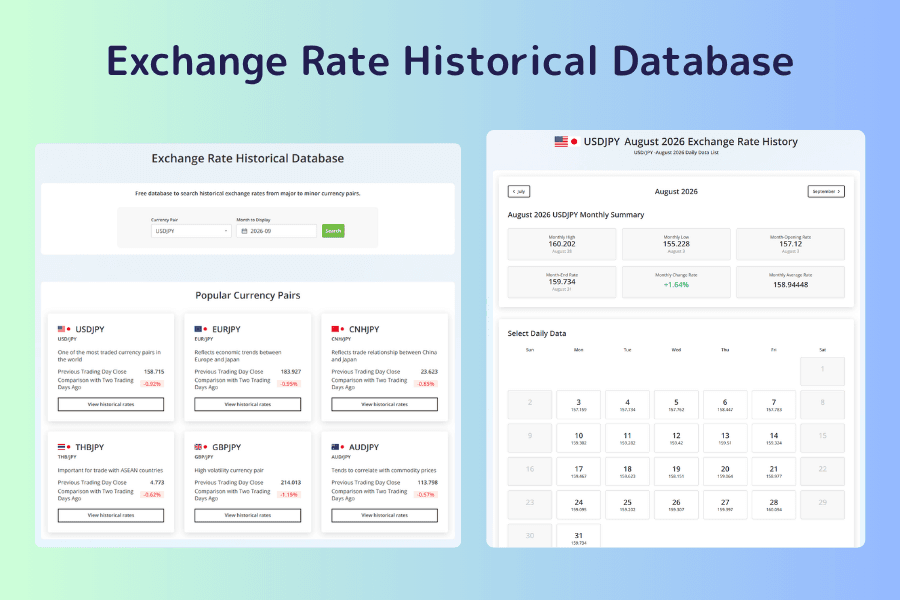
The research site has a separate historical exchange rates tool covering daily history for 57 currency pairs, queried directly in the browser with no download. Open an individual pair and a calendar lets you pick a date, with data going back to 2000, alongside a chart of the last 30 trading days and a table of open, high, low and close.
The division is clear: one-minute CSVs for programmatic backtesting, the online daily database for checking a level on a given day.
Open Historical Exchange Rates7. FAQ
Q1: Do I need an account or a login to download?
No. Accepting the terms of use is enough.
Q2: Which instruments can I download?
There are five categories — FX, Indices, Commodity, US Stocks and Crypto — and switching Category replaces the Symbol list. The dropdown itself is the authority on what is currently available.
Q3: Does the data include swap and commission?
What you get is a price series; commission and swap are configured in the backtesting software. For the actual swap figures day by day, see how to check swap points.
Q4: Why does downloading historical data ask for an account type?
Different accounts carry different trading conditions and product specifications, so align it with the one you actually use. Micro deserves particular attention: its lot specification differs from Standard and Blade, so confirm the contract size before backtesting on fixed lots.
Q5: Are one-minute bars suitable for backtesting a scalping strategy?
They work for initial screening, but the limits grow as the timeframe shortens. Open-high-low-close cannot recover whether price hit the stop or the target first inside the same bar, and neither slippage nor live spread appears in a price series at all. Always validate this kind of strategy with forward testing afterwards.
Q6: Can I share the downloaded data with a friend?
No. The terms of use prohibit redistribution outright, whether paid or unpaid.
8. Summary
Four steps: choose the right account type, select the symbol and the start and end months, accept the terms and download, then import into MT4 or MT5 and spot-check once.
Two things deserve the most attention. First, match the account type to what you actually trade — the shorter the strategy, the more sensitive it is. Second, the data carries no guarantee of accuracy, so leave a margin of safety in any conclusion and use forward testing to cover the part of reality that history cannot.
If all you want is a level on a particular day, skip the CSV and use the online daily database instead.
One last note on the terms of use. The data may be used only for backtesting and market analysis related to trading with Titan FX, and redistribution is prohibited whether paid or unpaid. Accuracy is not guaranteed and the right to correct without notice is reserved, so treat backtest results as estimates rather than guarantees and leave adequate margin when judging whether a strategy has an edge. Any profit or loss arising from use of the data is the user's own.
Further Reading
- Titan FX Market Analysis Tools: Finding the Right One at Each Step of a Trade
- How to Read the Economic Calendar: Filters, Columns and Post-Release Price Moves
- EA in FX Trading: Development, Pros, Cons, and Risks
- What is a Lot? Understanding Its Calculation and Importance in Forex and CFD Trading
- What is Leverage Trading? Types, Calculation Methods, and Investment Strategies
- Forex Margin Calculation: How to Calculate Required Margin with Leverage
Titan FX Trade Strategy Research Lab. We create educational content across a broad range of financial instruments, including forex (FX), commodities (crude oil, precious metals, agricultural products), stock indices, US equities, and crypto assets, for investors.
Primary Sources (by Category)
- Tool specification: the selection options, summary line and download flow of the Titan FX Research historical data page as displayed
- Terms of use: the three clauses of the historical data terms published on that page
- Import procedure: the official Titan FX guides for importing historical data into MT4 and MT5