
 Home
Home- Investment Guide: Strategies for Stocks, Forex, and Metals
- How to Check Swap Points: The Triple-Charge Day and Cost
How to Check Swap Points: Reading the Columns, the Triple-Charge Day and Holding Cost
Swap is the interest that accrues when a position is held overnight. It can be a cost or a credit. The daily amount is rarely large, but it compounds, and the two directions on the same instrument often differ by several times over. On any trade held longer than a week, this figure moves the result.
Most people glance at it once before opening a position, just to see whether it is positive or negative. This tool answers more precisely: what the instrument actually paid each day this month, which day counts as three, and which side of the trade is the better one to be on.
What follows works through the four dropdowns, reads the table column by column, and then converts the numbers into an actual holding cost in two worked examples.
- The table splits into Buy and Sell. The two are not mirror images, and it is common for both to be negative.
- Number of Days for Swap Points tells you how many days a date is charged for. A 3 marks the triple-charge day.
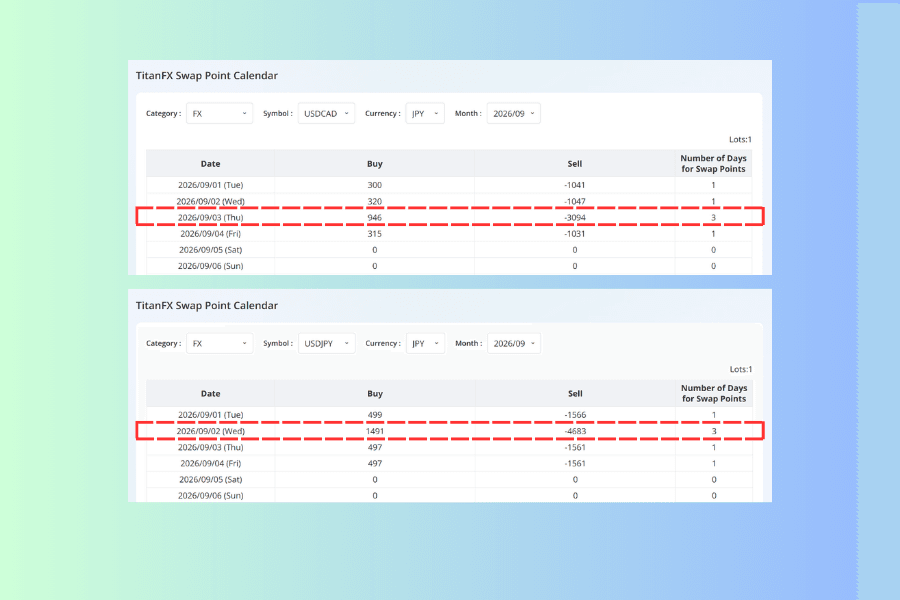
- The triple-charge day cannot be inferred from the asset category. Even inside FX there are exceptions: USDCAD and USDTRY fall on Thursday rather than Wednesday.
- Currency only changes the display currency. It does not change what you actually pay.
- Every figure assumes 1 lot. Scale it to your real position size.
- What you see here is a historical record. What tonight will actually cost is governed by the instrument specification in MT4/MT5 and by what posts to your account.
1. What This Tool Answers
Swap is the interest that arises when a position carries across the rollover point. Whether you receive it or pay it depends on the conditions attached to each side of that instrument, not on whether your view of price turned out to be right. On some instruments both directions pay.
The difficulty is that most platforms show you a single current figure before you open. That figure changes daily, and on the triple-charge day it suddenly triples. Hold for a week and the running total can differ considerably from what you saw on day one.
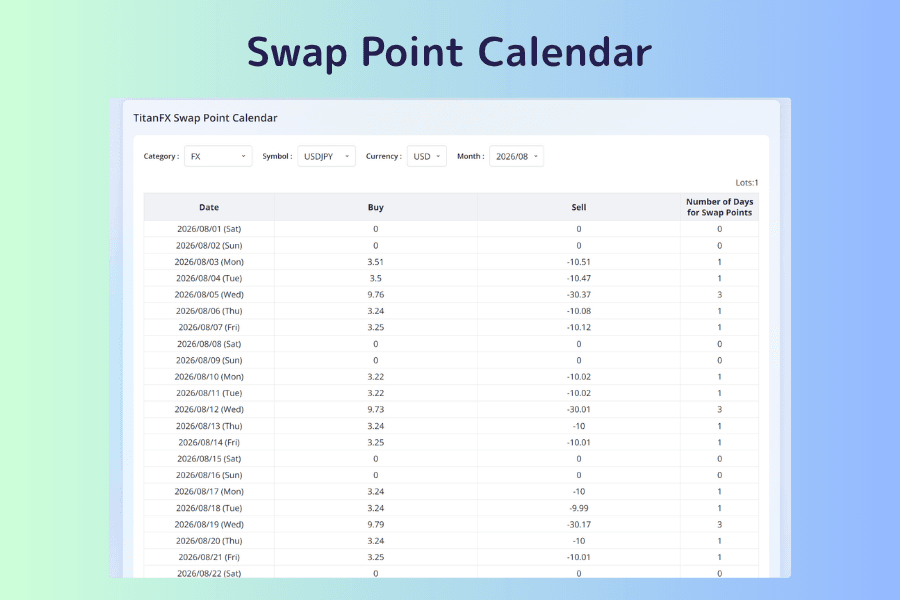
The tool lays out a full month of actual amounts: the zeros over the weekend, the triple day, and the day counts already assigned to dates that have not arrived yet. It turns holding cost from a rough impression into a figure you can add up day by day.
Four moments where it earns its place:
-
Before opening, when the trade is going to be held overnight — add up the amounts across the intended holding period first
-
When choosing between buying and selling — the two sides differ by several times over, and on some instruments both of them pay
-
When planning to hold across a week — confirm which weekday carries the triple charge
-
When reconciling — an unfamiliar debit on the account sends you back to check how many days that date was charged for
Two things to keep separate. What is recorded here is history, not tonight's quote — for the current setting, check the instrument specification in MT4/MT5, and your actual cost is whatever posts to the account. Separately, the figures contain only swap: spread and commission are not in them.
2. Where to Open It
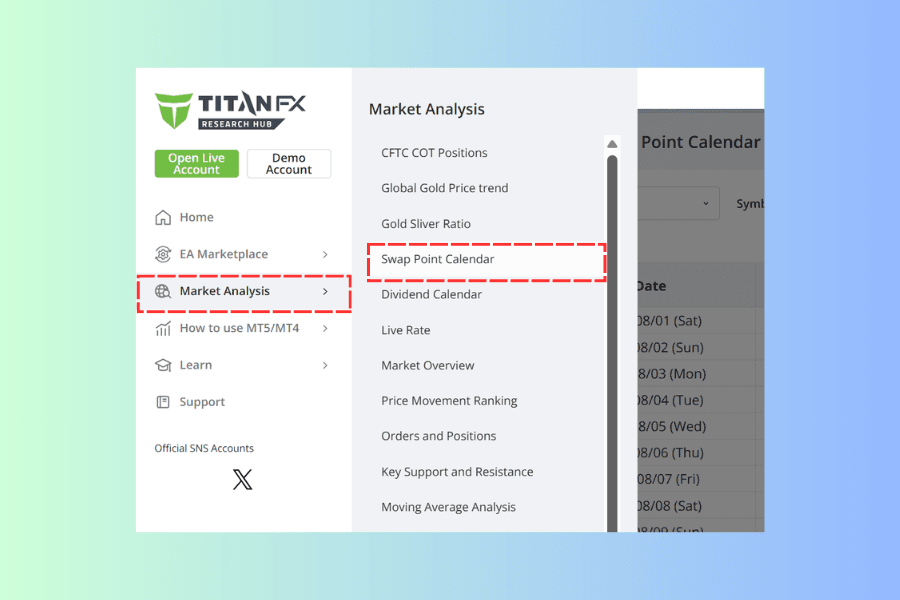
From the Titan FX Trade Strategy Research Lab menu, open Market Analysis and select Swap Point Calendar from the list.
3. The Four Dropdowns
Four dropdowns sit above the table, numbered ① to ④ in the image below.
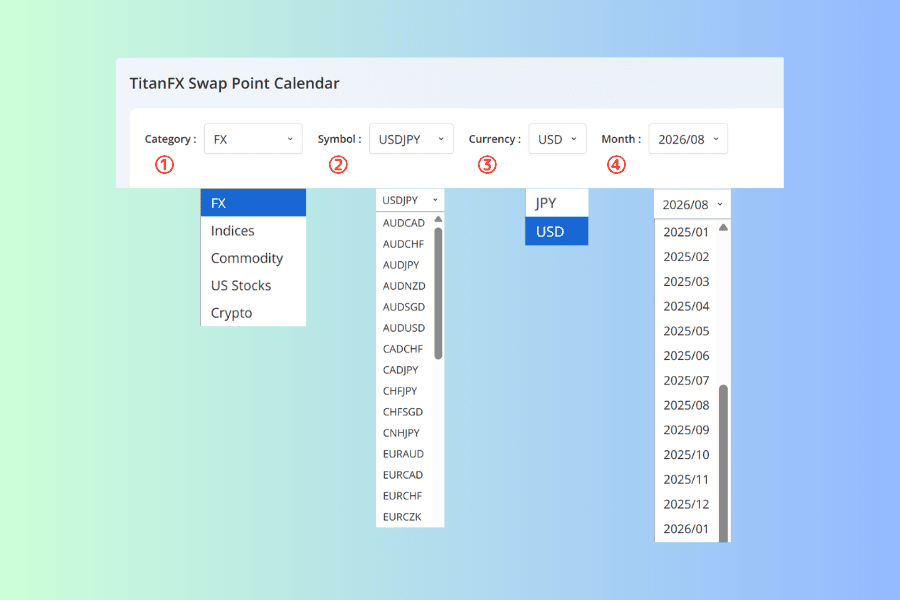
① Category
Five groups: FX, Indices, Commodity, US Stocks and Crypto. Switching category replaces the symbol list in ② entirely.
② Symbol
Pick one instrument from within the selected category. Changing the symbol recalculates the whole table — not only the amounts, but potentially which weekday carries the triple charge.
③ Currency
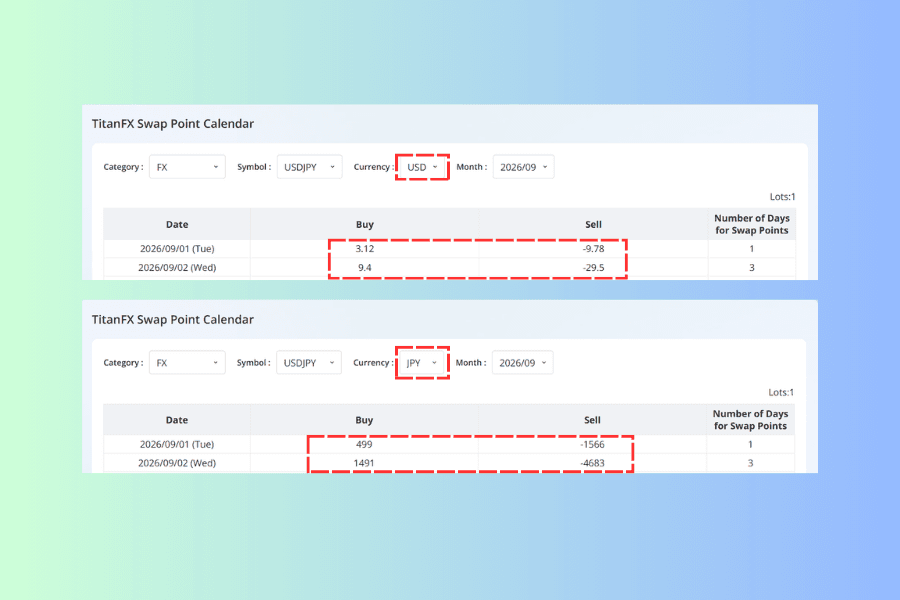
Two options, JPY and USD, deciding which currency the amounts are shown in. For USDJPY on 1 September 2026, USD shows a buy of 3.12 and a sell of -9.78; switch to JPY and the same date reads 499 and -1566. That is a display conversion. What posts to the account is denominated in your account currency.
④ Month
Queried by calendar month. It currently reaches back to March 2024, though the dropdown itself is the authority on the range. Going back lets you reconcile charges that have already happened; going forward shows only the day counts, because the amounts are not set until the date arrives.
4. Reading the Four Columns
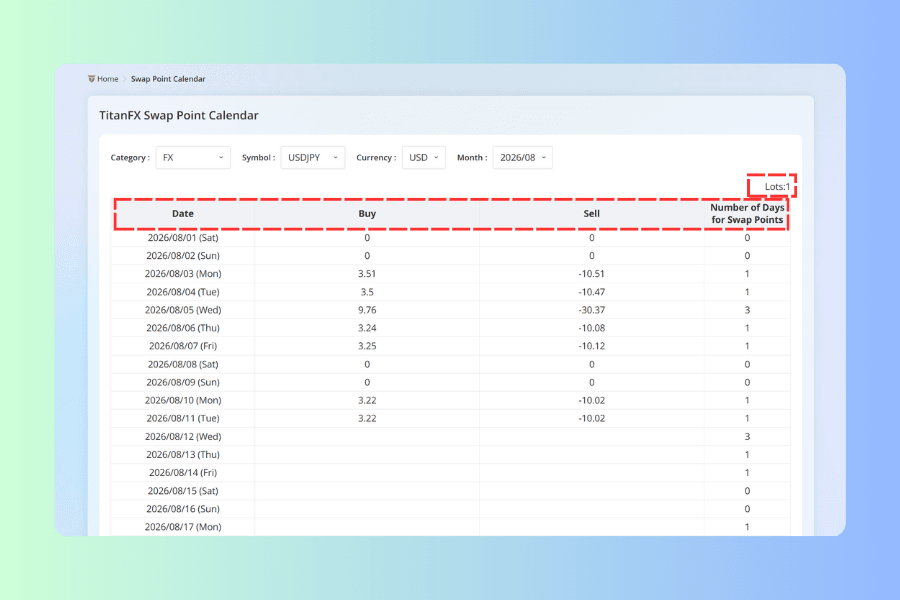
Above the table sits Lots: 1. That is the premise for everything below it: every figure assumes a single lot. A 0.3 lot position multiplies by 0.3, a 5 lot position by 5. Contract size per lot differs by instrument, so scale using the table's own per-lot figure rather than carrying an FX sense of what a lot means over to indices or crypto.
Buy and Sell are not mirror images of one another. Each side is shaped by rate differentials, the carrying cost of the instrument and the trading conditions attached to it, so one can be positive while the other is negative, or both can be negative. For USDJPY on 3 August 2026 the buy was +3.51 and the sell -10.51: a long position received 3.51 US dollars a day, a short paid 10.51. EURUSD ran the other way, buy -7.2 and sell +1.99. Read both figures as shown; do not flip the sign on one to infer the other.
Both sides being negative is common. Indices, US stocks and crypto are mostly like this: US500 showed a buy of -1.2 and a sell of -0.18, Apple -6.24 and -3.68, BTCUSD -53.75 and -10.75. Either direction pays; only the amount differs. For a strategy that holds for any length of time, this column belongs in the decision about which way to trade.
Number of Days for Swap Points sets the multiplier for the date. Most days show 1, weekends show 0, and one day each week shows 3. The column is already populated for future dates, so you can identify the coming triple-charge days ahead of time and build them into the cost of the position.
5. Finding the Triple-Charge Day
"FX triples on Wednesday" is the version most widely repeated, and many traders apply it to everything else as well. Checking instrument by instrument in the tool shows the rule does not even hold inside FX.
Queried in September 2026:
| Instrument | Day showing 3 |
|---|---|
| USDJPY, EURUSD, CADJPY, USDMXN | Wednesday |
| USDCAD, USDTRY | Thursday |
| XAUUSD, XAGUSD, XPTUSD, XPDUSD (precious metals) | Wednesday |
| XTIUSD, XBRUSD, XNGUSD (energy) | Friday |
| US500, JPN225, AUS200 (indices) | Friday |
| Apple and other US stocks, BTCUSD | Friday |
Two things stand out. USDCAD and USDTRY, both FX pairs, land on Thursday, because their settlement convention differs from most currency pairs; CADJPY and other Canadian dollar crosses stay on Wednesday, so the exception is confined to those two US dollar pairs. And precious metals and energy sit inside the same Commodity category yet split between Wednesday and Friday.
Which points at how the tool is actually meant to be used: select the instrument, then look for the date where Number of Days for Swap Points reads 3. Do not try to memorize weekdays. Settlement conventions, weekend accrual and product rules were never consistent across markets in the first place, and the rules themselves can change. Checking once is more reliable than carrying a rule around.
6. Two Worked Examples
Example 1: the real cost of holding for a week
Say you sell 0.5 lots of USDJPY and hold from Monday to Friday's close.
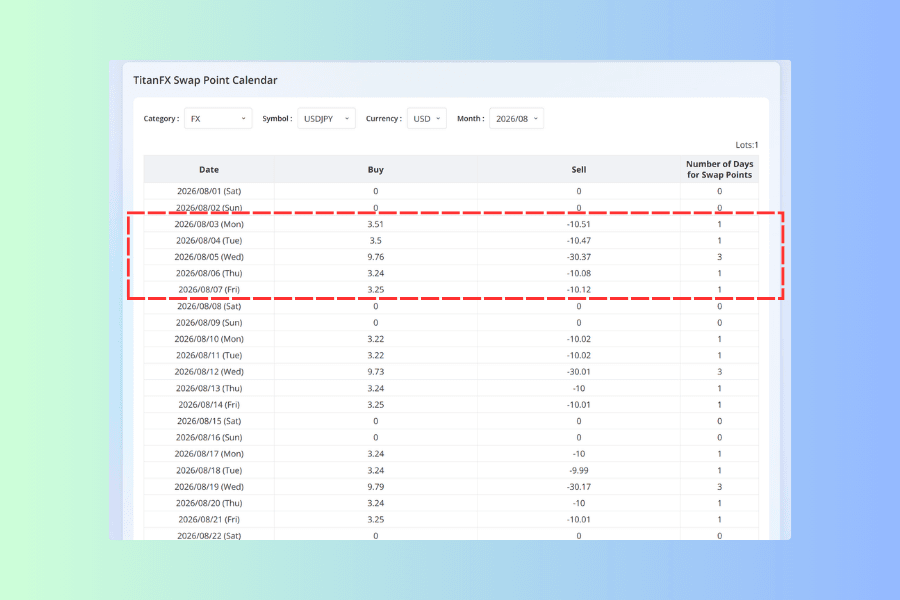
For the week of 3 to 7 August 2026, the sell side ran -10.51, -10.47, -30.37 (the triple day), -10.08 and -10.12, totalling -71.55 US dollars across five days. At 0.5 lots the real cost is about -35.8 US dollars.
That number has to sit next to the expected gain. If the target is 30 pips (one pip on USDJPY is normally 0.01 yen), 30 pips on 0.5 lots comes to 15,000 yen, which converted at the rate at the time is under 100 US dollars. Swap takes more than a third of it. Being right on direction is not enough; time in the position counts too.
Long the same pair over the same five days, the credit is 3.51 + 3.50 + 9.76 + 3.24 + 3.25 = 23.26 US dollars, about 11.6 at 0.5 lots. Same instrument, same week, and the paying side pays more than three times what the receiving side collects. That is why carry trades only work in one direction.
Example 2: deciding whether it is worth carrying across the triple day
Once you know which day it is, put it into the expected result for the trade and then decide whether to carry across it.
On the paying side, check whether the two extra days still sit inside what the trade can absorb. On the figures above, carrying across the triple day rather than an ordinary one costs roughly 20 US dollars more per lot. Where the expected gain was thin to begin with, that gap is worth a look at the holding period.
On the receiving side, the triple credit counts as part of the return on the position, but it is not a reason to open one. Price risk over those days dwarfs the interest.
If you are considering closing before the triple day and re-entering afterwards, price in the fresh spread, the slippage you might take and whatever the market does while you are flat. Swap is one component of holding cost, and it should not decide entries and exits on its own.
7. Three Common Misreadings
Treating past amounts as a fixed future value
Three days at +3 US dollars does not mean next week will be +3. Swap moves with market rates. Historical figures are good for estimating an order of magnitude and comparing the two directions; they are not a promise about what comes next. For the current setting, go back to the instrument specification in MT4/MT5.
Reading a change of display currency as a change in cost
Switch to JPY and 3.12 becomes 499, which looks much larger, but it is the same money expressed differently. This dropdown changes what you see, not what you pay.
Forgetting the one-lot premise
Most real positions are not whole lots. At 0.1 lots the actual figure is a tenth of what the table shows; at 3 lots it is triple. Estimating cost straight off the table's numbers scales the error with the position.
8. FAQ
Q1: When is swap applied?
At the platform's daily rollover point, and only if the position is open across that moment. A position opened and closed the same day incurs none.
Q2: Why are the weekend days zero?
Markets are closed and there is no new settlement. Those two days' interest is folded into the instrument's triple-charge day, which is why that date reads 3.
Q3: Why do future dates show a day count but no amount?
The day count comes from the trading calendar and can be assigned ahead of time. The amount depends on rates and market conditions on the day itself. So future dates will tell you which day is charged three times, but not how much.
Q4: Why are the buy and sell figures asymmetric?
They are not simple opposites. In FX the difference is driven mainly by the interest rate differential between the two currencies; on CFD instruments the financing and carrying costs of the product come into it as well. That leaves the two directions at different magnitudes, and sometimes both negative. Read the two figures for the day directly rather than deriving one from the other.
Q5: Can I avoid the triple charge by closing and re-entering?
If there is no open position at the rollover point, that charge does not arise. But re-entering means paying the spread again, accepting whatever slippage occurs, and being exposed to the price move while you were out — none of which is guaranteed to be smaller than the interest saved.
Q6: Do these figures include spread and commission?
No, only swap. A full picture of holding cost also needs the spread and whatever commission your account type carries.
9. Summary
The routine reduces to three steps: choose the instrument, find the date where the day count reads 3, then add up the daily figures across the holding period and multiply by your actual lot size.
The value here is turning holding cost from a vague impression into something you can reconcile day by day. And the piece most often overlooked is which weekday carries the triple charge, because there is no general rule to memorize. Even within FX there are exceptions, and every instrument has to be checked on its own.
For any trade held beyond two or three days, spending ten seconds adding up the swap over that period before opening is among the cheapest habits available.
Further Reading
- Titan FX Market Analysis Tools: Finding the Right One at Each Step of a Trade
- How to Read the Economic Calendar: Filters, Columns and Post-Release Price Moves
- Passive Income
- What is Leverage Trading? Types, Calculation Methods, and Investment Strategies
- Forex Margin Calculation: How to Calculate Required Margin
- The 2% Rule: Risk Management and Position Sizing for Beginners
Titan FX Trade Strategy Research Lab. We create educational content across a broad range of financial instruments, including forex (FX), commodities (crude oil, precious metals, agricultural products), stock indices, US equities, and crypto assets, for investors.
Primary Sources (by Category)
- Tool specification: the dropdown options, column definitions and table contents of the Titan FX Research Swap Point Calendar as displayed on the page
- Recorded data: the daily buy and sell amounts and day counts for August and September 2026, queried instrument by instrument in the tool
- Settlement conventions: the delivery and weekend accrual arrangements applying to each asset class and currency pair