

Consumer Confidence Index (CCI)
Consumer spending makes up about 70% of US GDP, so how households feel about the economy shapes whether they keep spending. That is why markets treat consumer confidence as an early read on spending. In the US, two surveys are cited most often: The Conference Board's Consumer Confidence Index and the University of Michigan's Index of Consumer Sentiment.
This article explains how consumer confidence is measured, how the two US indexes differ and when they are released, how to read the data, why sentiment and actual spending can diverge, how releases affect the dollar and US stocks, and which consumer confidence gauges other countries publish.
- The Consumer Confidence Index turns survey answers about the economy into a single number and serves as an early read on consumer spending
- The Conference Board's index is based at 1985 = 100; the University of Michigan's index is based at Q1 1966 = 100 and also reports inflation expectations
- Start with the gap between the actual reading and the forecast, then check the present-situation and expectations components, and whether the move has lasted several months
- The Conference Board treats an Expectations Index below 80 as a recession warning, but the signal has been wrong before
- Sentiment is not spending: when the Michigan index hit a record low in May 2026, US real consumer spending was still rising
1. What is the Consumer Confidence Index?
The Consumer Confidence Index is a survey-based indicator. Each month, the survey asks consumers how they see business conditions, jobs, income and prices, with questions such as "Are business conditions good right now?" and "Will jobs be harder to find six months from now?" The answers are combined into a single number and compared with a base period: a reading above the base means consumers are more optimistic than they were then, and a reading below it means they are more pessimistic.
Markets pay attention because worried consumers tend to delay big purchases such as cars and homes, which can slow retail sales and personal spending. Consumer confidence is released earlier than those hard spending figures, so it offers an early look at how households feel about the economy.
2. Consumer Confidence vs. Consumer Sentiment: the two US indexes
The two US gauges have similar names but are built differently:
| Item | Conference Board Consumer Confidence Index | University of Michigan Index of Consumer Sentiment |
|---|---|---|
| Publisher | The Conference Board (private research organization) | University of Michigan Surveys of Consumers |
| Base | 1985 = 100 | Q1 1966 = 100 |
| Frequency | Once a month | Twice a month (preliminary and final) |
| Release time | Usually the last Tuesday of the month, 10:00 a.m. ET | Preliminary mid-month, final at month-end, 10:00 a.m. ET |
| Components | Present Situation Index, Expectations Index | Current conditions, expectations, inflation expectations |
| Question focus | Includes questions on the job market and business conditions | Asks more directly about household finances, buying conditions and inflation expectations |
Both surveys ask about current conditions, the outlook and household finances; the difference lies in how the questions are designed. The Conference Board asks more about jobs, such as whether jobs are "plentiful" or "hard to get." The University of Michigan asks about household finances and whether it is a good time to buy big-ticket items, and it also tracks expected inflation over the next year and the next 5 to 10 years. The Fed often looks at these figures when judging whether inflation expectations are anchored.
Because the methods differ, the two indexes can diverge in the short run. During periods of high inflation, the Michigan index usually falls more sharply.
3. How to read consumer confidence data
Four steps for reading a release
-
① Compare the reading with the forecast: markets have already priced in the consensus, so the bigger the surprise, the more likely prices are to react
-
② Check the components: the present-situation index reflects how consumers rate current business and job conditions, while the expectations index reflects their outlook. When both move in the same direction, the signal is more consistent
-
③ Look for a sustained move: a one-month rise or drop is often reversed the next month. A trend becomes clearer only after several months in the same direction
-
④ Confirm with hard spending data: finally, check retail sales, real personal consumption expenditures and employment data to see whether the change in mood is showing up in actual spending
The Expectations Index below 80
The Conference Board treats an Expectations Index below 80 as a warning sign of a recession ahead. The threshold comes from past experience, and it has given false signals: the index fell below 80 several times in 2022 and 2023, yet the US did not enter a recession. The expectations gauge helps show how worried consumers are about the future, but it does not reliably predict how much they will spend.
Low sentiment does not always mean less spending
The chart below shows the University of Michigan Index of Consumer Sentiment since 1978.
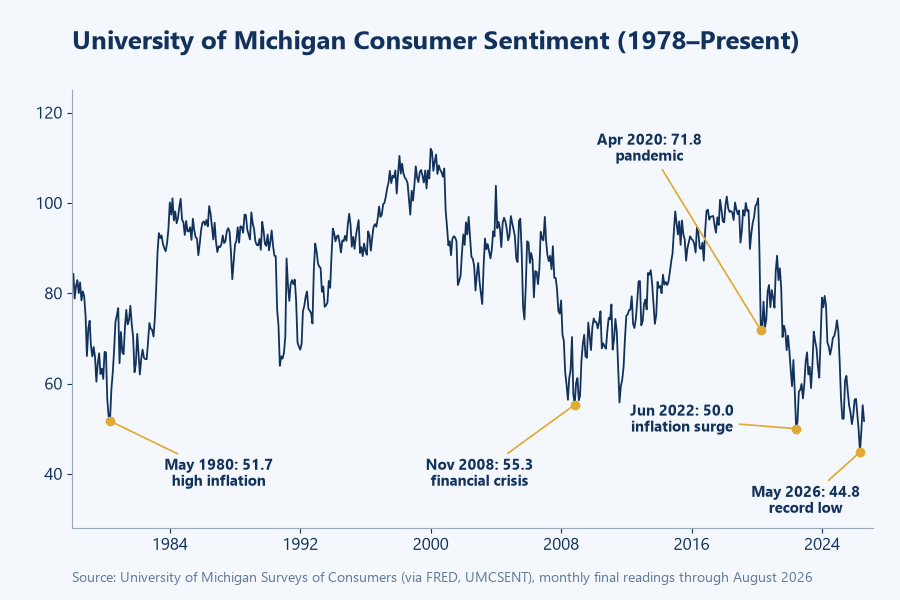
Most of the deepest lows came during periods of rapidly rising prices, such as 1980 and 2022. In April 2020, early in the pandemic, the index fell to 71.8. Each low also reflected other factors, including jobs, income and policy uncertainty.
The most recent example is 2026. With prices and oil costs rising, the Michigan index fell to 44.8 in May (final reading), a record low. Over the same period, US real personal consumption expenditures rose every month from May through August. Sentiment measures how people feel, and it often diverges from how they actually spend. The signal becomes clearer when sentiment keeps falling and real spending starts to slow as well.
4. How consumer confidence affects forex and US stocks
A stronger-than-expected reading generally supports the outlook for US consumers and the economy, but the dollar and US stocks do not always rise together. Strong data can lift rate expectations and support the dollar. For stocks, better consumer demand helps earnings, but if the data also pushes Treasury yields higher, that can weigh on share prices. The actual reaction depends on the rate backdrop and on whether other data is released at the same time.
Compared with nonfarm payrolls and CPI, consumer confidence is usually a second-tier release. When it does move markets, the most direct effects are on the dollar and US stocks, including USD/JPY, EUR/USD and the US500.
Checking the price reaction on the indicator page
Titan FX's US Consumer Confidence Index by the Conference Board page lists past forecasts, actual readings and deviations, along with price changes 1, 5, 10, 15, 30 and 60 minutes after each release for USD/JPY, EUR/USD, XAU/USD, US30, US500 and NAS100.
For September 2026, the reading of 81.9 came in 7.2 points below the 89.1 forecast, yet the short-term move in USD/JPY was limited. A large miss does not necessarily produce a price move of similar size. The price changes shown reflect actual market moves in that window, so not all of each move can be attributed to this release.
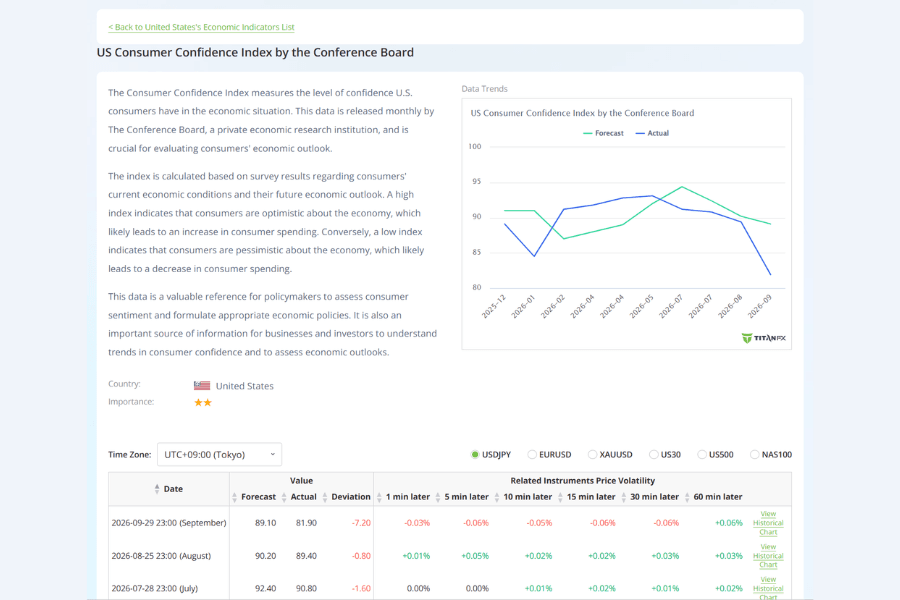
The University of Michigan index has its own preliminary release page. You can check the next release dates for both indexes on the Economic Calendar.
5. Consumer confidence indicators in other countries
Other major economies publish their own consumer surveys:
| Country | Indicator | Publisher |
|---|---|---|
| Japan | Consumer Confidence Index for General Households | Cabinet Office |
| Germany | GfK Consumer Confidence Survey | GfK |
| UK | GfK Consumer Confidence Survey | GfK |
Each uses its own method and base, so the numbers cannot be compared directly across countries. The better use is to follow the direction of each index; for example, several months of gains in Japan's index mean Japanese households are feeling better about the economy.
6. Consumer Confidence Index FAQ
Q1: What is a good Consumer Confidence Index reading?
There is no fixed benchmark. A reading of 100 on the Conference Board index means confidence is at its 1985 level, and 100 on the Michigan index means sentiment matches Q1 1966. In practice, what matters is the change from the prior month, the forecast and the long-term average.
Q2: Is consumer confidence a leading indicator?
It is often used as one, because it is released before hard data on retail sales and personal spending and reflects how households feel about the months ahead. Its track record is mixed, though: in 2022 and 2026, sentiment hit record lows while real spending kept growing. Treat it as an early signal to be confirmed by spending and employment data.
Q3: What is the difference between the preliminary and final Michigan readings?
The University of Michigan releases a preliminary reading mid-month based on the first part of the month's interviews, and a final reading at month-end that includes the full month. The two can differ, so check which one a figure refers to. The Conference Board also revises the previous month's reading when it publishes a new one.
Q4: How is consumer confidence different from the Consumer Price Index?
Consumer confidence is a survey of how consumers feel about the economy, while the Consumer Price Index (CPI) is a price statistic that measures changes in what goods and services cost. When CPI rises and prices climb, consumer sentiment tends to weaken, so the two are often watched together.
7. Summary
The Consumer Confidence Index turns survey answers into a measure of how consumers view the economy now and ahead, making it an early read on spending. Of the two US gauges, the Conference Board's index asks more about jobs, while the University of Michigan's index asks more directly about household finances and inflation expectations.
When reading a release, compare it with the forecast, check the components and the trend over several months, then confirm with retail sales, personal spending and employment data. Consumer confidence offers an early view of household mood, but it cannot on its own predict actual spending, a recession or market moves.
Further Reading
The financial market research team at Titan FX. We produce educational content for investors across foreign exchange, commodities (crude oil, precious metals, agricultural products), stock indices, US equities and digital assets.
Primary Sources
- Survey publishers: The Conference Board Consumer Confidence Survey; University of Michigan Surveys of Consumers; Japan Cabinet Office Consumer Confidence Survey
- Statistics: Federal Reserve Bank of St. Louis FRED (UMCSENT University of Michigan Consumer Sentiment, PCEC96 real personal consumption expenditures)
- Market coverage: Reuters and other reports on the record-low Michigan reading in May 2026 and the Conference Board Expectations Index below 80 in 2025