

Retail Sales

The US report draws the most attention. Personal consumption accounts for roughly two-thirds of US economic activity, which makes retail sales an important early read on both consumer demand and the broader cycle. When the print diverges meaningfully from consensus, the dollar, Treasury yields, and equities all tend to move quickly.
This article covers what retail sales measures and what it includes, when the US data lands and how to read it, the difference between the headline, ex-autos, and control group figures, how the release transmits into markets, how other countries' releases compare, and how retail sales differs from PCE and consumer confidence.
- Retail sales measures the change in sales at retail and food service businesses, and it is the earliest monthly read on consumer spending.
- The US data comes from the Census Bureau roughly nine business days after the reference month ends—so, mid-month.
- "Core" usually means ex-autos, while the control group strips out gasoline, building materials, and food services as well; the control group is what economists lean on when estimating goods consumption in GDP.
- US retail sales is reported in nominal terms with no inflation adjustment, so a strong print during a high-inflation period does not necessarily mean real spending rose.
- What markets trade is the gap against consensus, not the level of the number itself.
- 1. What Is Retail Sales? The Basics of a Consumption Indicator
- 2. When Is US Retail Sales Released, and How Do You Read It?
- 3. Headline vs Ex-Autos vs Control Group
- 4. How Does Retail Sales Move Financial Markets?
- 5. How Do Other Countries' Retail Releases Differ?
- 6. Retail Sales vs PCE vs Consumer Confidence
- 7. Retail Sales FAQ
- 8. Summary
1. What Is Retail Sales? The Basics of a Consumption Indicator
Definition: What Retail Sales Measures
Retail sales tracks the change in sales at retail and food service businesses over a given period, normally reported month-over-month. It captures revenue that companies actually reported, rather than intentions or sentiment gathered from a survey, which is what makes it the earliest clear read on goods consumption.
Why Markets Care So Much
Personal consumption accounts for roughly two-thirds of US gross domestic product—the single largest driver of growth—and retail sales is the first consumption signal available each month.
Solid spending generally implies steady employment and incomes. A run of weak prints, on the other hand, gets markets worrying about slowing growth and revising their view of where central bank policy goes next.
What the Report Covers
US retail sales is presented across 13 main retail and food service categories, including motor vehicles and parts, gas stations, food and beverage stores, department stores and clothing, building materials and garden supply, electronics, nonstore retailers (e-commerce), and food services.
Motor vehicles and parts is the largest single category. It is big and it swings hard, so it often drives the headline number—which is exactly why markets look at a figure that strips it out.
2. When Is US Retail Sales Released, and How Do You Read It?
Publisher and Release Time
US retail sales is published by the US Census Bureau, part of the Department of Commerce. The data comes from the Advance Monthly Retail Trade Survey (MARTS), which samples around 4,800 firms, and the monthly release is titled Advance Monthly Sales for Retail and Food Services.
It lands roughly nine business days after the reference month closes—so, mid-month—at 8:30 a.m. US Eastern Time. Note that daylight saving time shifts the GMT equivalent:
| US clock | Eastern Time | GMT |
|---|---|---|
| Daylight saving (roughly March to November) | 08:30 | 12:30 |
| Standard time (roughly November to March) | 08:30 | 13:30 |
Exact dates shift month to month, so check the official release schedule or an economic calendar.
Nominal: There Is No Inflation Adjustment
An easily missed point: US retail sales is reported in nominal dollars, with no adjustment for price changes.
In other words, when inflation is running hot, sales values can rise on higher prices alone, even if nobody bought more. Read the print alongside the same period's price data to separate "bought more" from "paid more."
The eurozone mainly publishes retail trade volumes, and the UK provides both value and volume figures. Before comparing any of them with the US number, check whether you are looking at value or real volume.
Watch the Revisions
The advance estimate comes from a fairly small sample—fast, but limited in precision. The Census Bureau puts the average absolute revision to that advance estimate at about 0.2 percentage points. Each release also revises the prior month, and when that revision is large it can change the read on the consumption trend entirely. That is why experienced traders check the revision alongside the new print.
3. Headline vs Ex-Autos vs Control Group
This is the part of the release most often confused, and also the most important. One report contains three measures, each excluding different things and each useful for something different. Broadly: the headline drives the initial market reaction, the ex-autos figure strips out the noisiest component to show the trend, and the control group is the one to watch for consumption as it relates to GDP.
| Measure | What it excludes | Main use |
|---|---|---|
| Headline retail sales | Nothing—all 13 categories | Overall spending, and the first market reaction |
| Retail sales ex-autos | Motor vehicles and parts | Trend, with the most volatile component removed |
| Control group | Motor vehicles and parts, gasoline, building materials, food services | Used to estimate goods consumption in GDP/PCE; economists' preferred measure |
Why the Control Group Matters Most
The categories the control group excludes are either unusually volatile or better estimated from other sources when building the national accounts. Auto and gasoline spending have other statistics available, and building materials get classified as residential investment rather than personal consumption.
The Bureau of Economic Analysis (BEA) applies what it calls the retail control method, which makes the goods component of personal consumption expenditures grow at the same rate as the control group. So the control group is not itself the consumption line in GDP, but it is the closest reference point for estimating PCE and growth—and the reason economists look there before the headline.
"Core" Does Not Have a Single Definition
Worth flagging: "core retail sales" means different things in different places.
Most financial media and economic calendars use "core" to mean ex-autos. Some research publications use it for a narrower basket that also strips out gasoline and building materials—closer to the control group.
So when you see "core," check what that particular source excludes before drawing conclusions. It is why this article says "ex-autos" rather than relying on the label.
4. How Does Retail Sales Move Financial Markets?
The Transmission Chain
The path from the release to market pricing runs roughly like this:
- 1. The spending data: retail sales comes in above or below consensus.
- 2. Growth expectations: the control group feeds into the consumption side of GDP through the BEA's retail control method.
- 3. Inflation and rate expectations: strong spending signals firm demand, which can push out expected cuts or reinforce the case for hikes.
- 4. Bonds and FX: Treasury yields react first—shorter maturities are the most sensitive to the policy path—and the dollar follows.
Markets Trade the Gap, Not the Number
What sets the move is the distance between the actual figure and what was expected, not whether the number itself looks high or low.
A clear beat, with the control group and prior-month revision pointing the same way, can lift growth and rate expectations, push short-dated yields and the dollar higher, and weigh on rate-sensitive equities. A miss does the reverse. That said, the actual reaction depends on what was already priced in and on whatever else is released the same morning—so not every retail sales print produces a big move.
Which Instruments React Most
Dollar pairs feel it most directly. EUR/USD is deeply liquid and one of the clearest places to watch the dollar's immediate reaction, while USD/JPY is more sensitive to rate differentials and tracks Treasury yields closely. GBP/USD, USD/CAD, and the risk-linked AUD/USD often see meaningful moves as well.
Gold responds indirectly through real yields, usually moving inversely to the dollar.
A Worked Example: January 2021
The January retail sales report released on 17 February 2021 came in at +5.3% month-over-month, well above a consensus of roughly +1.2%, with the ex-autos figure up about 5.9%. Stimulus cheques reaching households that month were the main driver, lifting online purchases, building materials, and sporting goods. It is a good illustration of how consumption data can jump far beyond expectations in a single month when fiscal policy puts money directly into disposable income.
5. How Do Other Countries' Retail Releases Differ?
Other major economies publish comparable indicators, but the names, the basis, and the timing all vary. Knowing the differences keeps you from misreading cross-country comparisons.
| Region | Indicator | Publisher | Timing and characteristics |
|---|---|---|---|
| United States | Retail sales | Census Bureau | Mid-month; nominal, month-over-month |
| Mainland China | Total retail sales of consumer goods | National Bureau of Statistics | Mid-month; January and February published together |
| Eurozone | Retail trade volume | Eurostat | About five weeks after the reference month; real (volume) index |
| United Kingdom | Retail sales | Office for National Statistics | Mid to late month; reported in volume terms, with emphasis on three-month comparisons |
| Hong Kong | Retail sales value | Census and Statistics Department | Around the end of the following month; both value and volume indices |
| Japan | Current Survey of Commerce | Ministry of Economy, Trade and Industry | Preliminary at the end of the following month; year-over-year is the headline |
Australia, meanwhile, has been shifting toward the broader Monthly Household Spending Indicator (MHSI). When reading more recent material, check which framework the statistics agency was using at the time.
The above reflects general release patterns; for exact dates and methodology, always defer to each agency's current publications.
6. Retail Sales vs PCE vs Consumer Confidence
Retail sales is not the only window onto consumption, and two other measures are easy to confuse with it.
Versus Personal Consumption Expenditures (PCE)
Personal consumption expenditures measures total household spending on goods and services. Its scope is broader than retail sales—alongside goods, it captures healthcare, education, financial services, and other services—and it is the official statistic behind the consumption line in GDP. Retail sales wins on speed: it arrives mid-month, while PCE comes later, so it is widely used as a leading input for estimating PCE and GDP.
One caveat: "PCE" in market commentary often refers to the PCE price index, also called the PCE deflator, which is built from the same report. That is the Federal Reserve's preferred inflation gauge and a different thing from the spending figure discussed here. It also comes from a different agency—the BEA, not the Census Bureau.
Versus Consumer Confidence
Consumer confidence indices are survey-based and measure how people feel about the economy and what they expect. Retail sales counts transactions that actually happened. The two do not always line up—confidence can be depressed while spending holds up, and vice versa—so they are best used together rather than as substitutes.
Tools: Tracking the Release Schedule
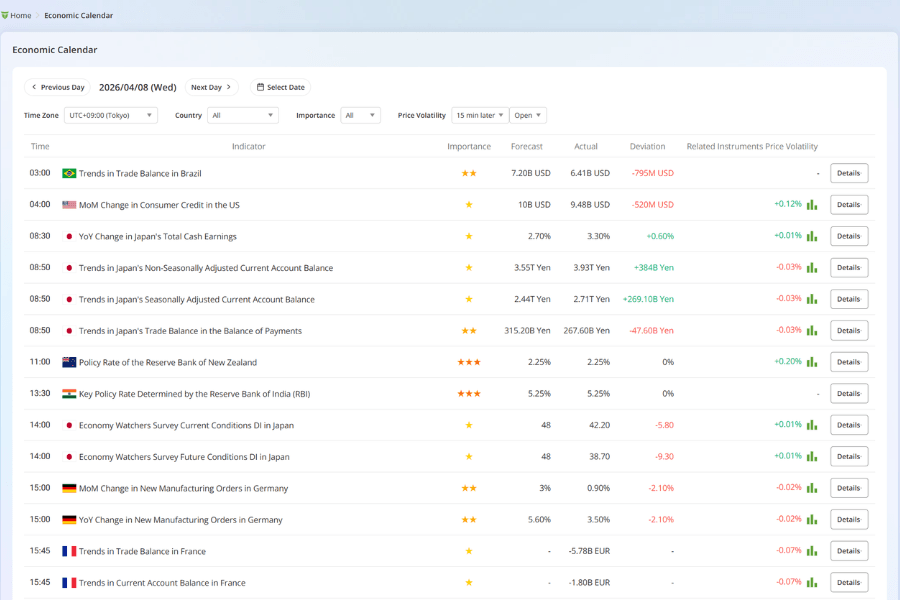
Because the reaction concentrates in the moments around the release, knowing the schedule in advance matters. Titan FX's economic calendar shows release times and consensus figures for retail sales and other major data worldwide.
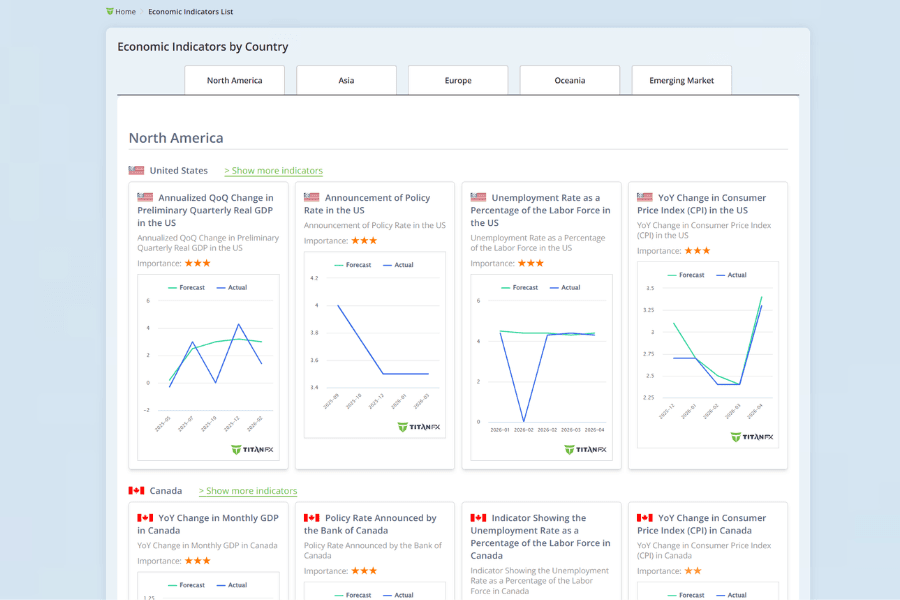
To follow longer-run trends, the global economic indicators tool lets you compare consumption, price, and growth data across countries.
7. Retail Sales FAQ
Q1. If retail sales rises, does that always mean the economy is improving?
Not necessarily. Because the US data is nominal, rising prices alone can lift the value. And if the growth is concentrated in a few categories, or the prior month was revised down at the same time, the underlying momentum may be weaker than the headline suggests.
Q2. Are core retail sales and the control group the same thing?
No, though they often get used interchangeably. On most economic calendars, "core" simply excludes autos, while the control group additionally strips out gasoline, building materials, and food services, and is the measure most often used to estimate goods consumption in PCE and GDP. Check the definition your source is using.
Q3. How long does the move after the release usually last?
In most cases the sharpest move is concentrated in the first few minutes. What happens afterwards depends on whether the data changed the outlook for rate policy—if it was just a single-month wobble, price action often returns to the prior trend.
Q4. Is online shopping included in retail sales?
Yes. E-commerce sits in the "nonstore retailers" category and is one of the components of retail sales, with its share continuing to grow. Watching that category is a useful way to track shifts in how people shop.
Q5. Which number should a beginner focus on?
Look at three together: the headline month-over-month figure, the control group, and the prior-month revision. The headline sets the initial market reaction, the control group better reflects the consumption trend that feeds GDP, and the revision tells you whether the trend itself has been redefined.
8. Summary
Retail sales is the earliest monthly read on consumer spending and a fixture in the FX calendar. Understanding what it covers, when it lands, and how the headline, ex-autos, and control group figures differ is what allows you to read the release for what it actually says.
Two things matter most for investors. What gets traded is the gap against expectations, not the number itself. And because the US data is nominal, a strong print during a period of high inflation does not necessarily mean real spending rose.
Further Reading
- What Is Non-Farm Payrolls (NFP)?
- What Is the Purchasing Managers' Index (PMI)?
- What Is the US Dollar (USD)?
- What Does It Mean to Raise Interest Rates?
- What Is Volatility?
Titan FX Trading Strategy Lab. We produce investor-education content covering forex, commodities (crude oil, precious metals, agricultural goods), stock indices, US equities, and digital assets.
Primary Sources (by Category)
- Official statistics: U.S. Census Bureau — Advance Monthly Retail Trade Survey (MARTS) survey documentation and release schedule; U.S. Bureau of Economic Analysis (BEA) — definition of the retail control method
- Central bank research: Federal Reserve Bank of Richmond — on how "core retail sales" is defined
- National statistics agencies: National Bureau of Statistics of China, Eurostat, UK Office for National Statistics, Hong Kong Census and Statistics Department, Japan Ministry of Economy, Trade and Industry