

Recession
The most common rule of thumb is that "two consecutive quarters of negative GDP growth" means a recession, but that is only a shortcut. In the US, recessions are dated by the National Bureau of Economic Research (NBER), a private research organization that looks at employment, income, spending and production. Its decisions usually come months, sometimes more than a year, after a recession has begun.
This article explains how a recession is defined and dated, why two negative GDP quarters are not the same thing, how long postwar US recessions have lasted, the warning signs markets watch, and how recessions affect currencies, stocks and gold.
- A recession is a broad and sustained contraction in economic activity; in the US, the NBER dates it based on depth, diffusion and duration
- "Two negative GDP quarters" is only a rule of thumb: the US briefly met it in the first half of 2022, but the NBER did not call a recession, and revised data now show only one negative quarter
- The US has had 13 recessions since 1945, averaging about 10 months; the longest lasted 18 months (2007–2009) and the shortest 2 months (2020)
- The yield curve and the Sahm rule are widely watched warning signs, but both have given signals that were not followed by a recession
- During recessions, money tends to flow into Treasuries, the yen and the Swiss franc, and central banks tend to cut rates
- 1. What is a recession?
- 2. Do two quarters of negative GDP mean a recession?
- 3. US recessions since World War II
- 4. Recession warning signs: three indicators markets watch
- 5. Recession vs depression, stagflation and soft landing
- 6. How recessions affect currencies, stocks and gold
- 7. Recession FAQ
- 8. Summary
1. What is a recession?
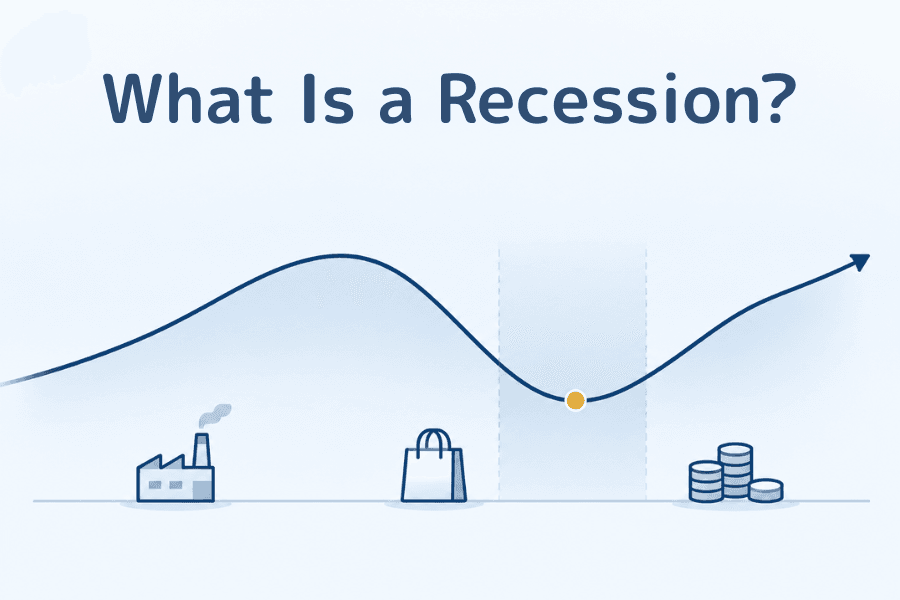
A recession is the contraction phase of the business cycle. After an expansion, the economy reaches a peak, turns down, falls to a trough and then recovers. The period from the peak to the trough is the recession.
In the US, the start and end dates of recessions are set by the NBER's Business Cycle Dating Committee. The NBER defines a recession as "a significant decline in economic activity that is spread across the economy and that lasts more than a few months," and weighs three criteria:
- ① Depth: whether the decline in activity is large enough
- ② Diffusion: whether it spreads across most industries and regions rather than staying in one sector
- ③ Duration: whether it lasts for some time rather than being a brief dip
The three criteria can offset one another. The 2020 recession lasted only two months, but the decline was so deep and so widespread that it still qualified.
The NBER has no fixed rule such as "a certain number of negative GDP quarters." It combines several monthly data series to decide in which month the economy peaked and in which month it bottomed.
The committee looks at real personal income, nonfarm payrolls, real personal consumption, industrial production and real GDP, among other data. Because it waits for data to accumulate and be revised, its calls come late: the recession that began in December 2007 was not announced until December 2008.
2. Do two quarters of negative GDP mean a recession?
Two consecutive quarters of negative real GDP growth are often called a technical recession. It is a simple, memorable shortcut that media and markets use often, but it is not the standard used to date US recessions officially.
The first half of 2022 is a good example. The data released at the time showed negative real GDP growth in both the first and second quarters, and markets debated whether the US had already slipped into recession. But over the same period nonfarm payrolls kept rising, unemployment stayed low and consumer spending did not contract broadly, so the NBER did not call a recession. The Bureau of Economic Analysis (BEA) later revised the data, turning the second quarter positive; current figures show only the first quarter as negative.
It also works the other way: a recession does not need two negative GDP quarters. Because the NBER dates recessions by month, the 2020 recession ran only from February to April and was over before quarterly GDP could post two consecutive declines.
3. US recessions since World War II
According to the NBER, the US has had 13 recessions since 1945, lasting about 10 months on average. The longest, during the 2007–2009 financial crisis, lasted 18 months; the shortest, during the 2020 pandemic, lasted 2 months. Here are the seven since the 1970s:
| Peak | Trough | Length | Main backdrop |
|---|---|---|---|
| November 1973 | March 1975 | 16 months | First oil crisis |
| January 1980 | July 1980 | 6 months | High inflation and Fed tightening |
| July 1981 | November 1982 | 16 months | Aggressive Fed rate hikes to fight inflation |
| July 1990 | March 1991 | 8 months | Savings and loan crisis, Gulf War and higher oil prices |
| March 2001 | November 2001 | 8 months | Dot-com bust |
| December 2007 | June 2009 | 18 months | Subprime crisis and the financial crisis |
| February 2020 | April 2020 | 2 months | COVID-19 pandemic |
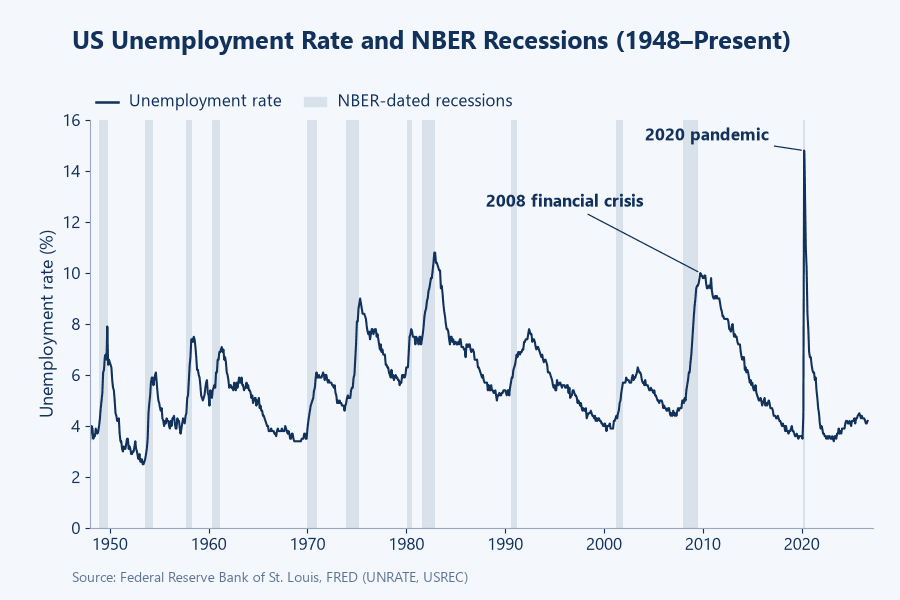
Putting the unemployment rate next to recession periods shows that unemployment rose in all 12 recessions since 1948, by between 1.9 and 11.3 percentage points. In 8 of them it peaked after the recession ended, and in the other 4 it peaked in the month the recession ended. Unemployment is a lagging indicator: companies tend to cut jobs heavily only after the economy has been weakening for a while, so by the time unemployment clearly rises, a recession has usually already begun. That is why markets also track indicators that move earlier.
4. Recession warning signs: three indicators markets watch
Since a recession can only be confirmed after the fact, markets track indicators that have historically changed before recessions:
-
① Yield curve inversion: short-term Treasury yields rise above long-term yields, signaling that markets expect rate cuts and slower growth. Most past US recessions were preceded by a yield curve inversion, but the inversion that began in July 2022 and lasted more than two years has not been followed by a recession
-
② The Sahm rule: when the three-month average unemployment rate rises 0.5 percentage points or more above its low over the previous 12 months, it is treated as a recession signal. The rule is designed to spot quickly whether a recession has already started; it does not forecast the economy months ahead. It was triggered early in every recession since 1970. July 2024 jobs data also triggered it, but a rapid increase in the labor force was pushing unemployment up at the time, and no recession followed
-
③ Purchasing managers' indexes: a manufacturing or services PMI below 50 means activity among surveyed companies is contracting. A single month below 50 does not mean the economy is in recession; several months of weak readings are more often treated as an early sign of a slowdown in the business sector
These indicators point to a higher probability of recession; none of them can confirm one on its own. Reading several together, alongside monthly jobs data such as nonfarm payrolls, gives a clearer picture of where the economy is heading.
Tracking recession data with Economic Indicators by Country
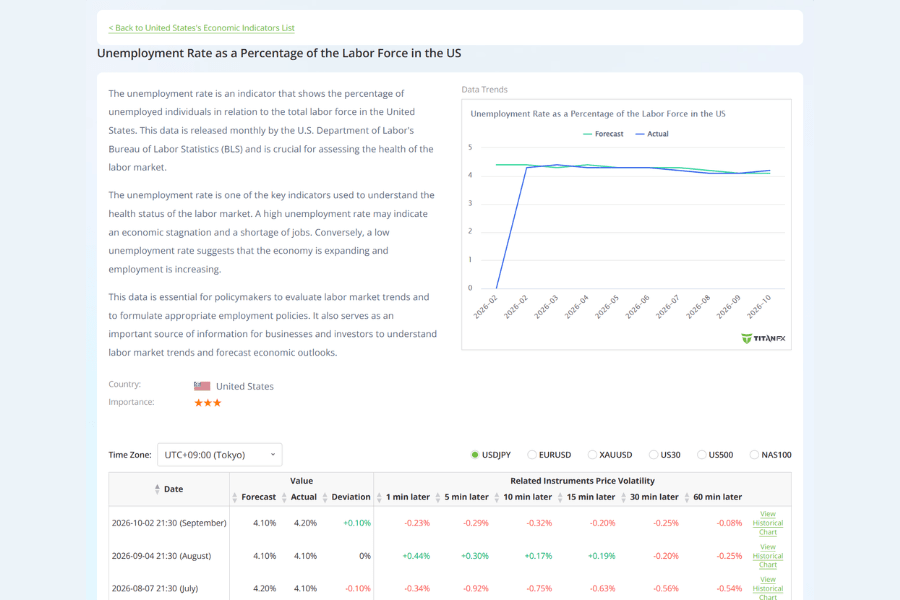
Titan FX's Economic Indicators by Country brings together GDP, unemployment, inflation and policy rate data for major economies. Open a single indicator, such as the US unemployment rate, to see:
-
Past releases with actual and forecast values, and the gap between them
-
The date and time of each release, with a choice of time zones
-
How USD/JPY, EUR/USD, gold and US stock indices moved in the 1 to 30 minutes after each release
5. Recession vs depression, stagflation and soft landing
When growth slows, recession is often discussed alongside depression, stagflation and soft landing. What separates them is how deep the downturn is, which way prices are moving, and whether the economy actually falls into recession.
| Term | Meaning | Relationship to recession |
|---|---|---|
| Recession | A broad contraction in economic activity lasting several months or more | — |
| Depression | A severe and prolonged recession, with no agreed numerical definition | Deeper than a recession; the Great Depression that began in 1929 is the classic case |
| Stagflation | Stagnant growth combined with high inflation | Not necessarily a recession; central banks struggle to address growth and prices at the same time |
| Soft landing | Rate hikes bring inflation down and growth slows without a recession | The outcome central banks aim for |
The key difference between a recession and stagflation is prices. In a typical recession, falling demand cools inflation, so central banks can cut rates with confidence. In stagflation, prices are still rising, so rate cuts risk making inflation worse, and policy choices become much harder. The US in the 1970s is the textbook example.
6. How recessions affect currencies, stocks and gold
Recessions change corporate profits, interest rates and capital flows. Markets usually price in a recession early, so asset prices often start moving before economic data clearly deteriorate. Common patterns include:
-
Central bank rate cuts: to support the economy, central banks usually cut interest rates. During the 2008 financial crisis and the 2020 pandemic, the Fed cut its policy rate to 0–0.25%. Lower rates push down bond yields and change interest-rate differentials between currencies
-
Safe-haven currencies strengthen: when markets turn risk-averse, money tends to flow into safe-haven currencies such as the yen and the Swiss franc, while growth-sensitive currencies such as the Australian and New Zealand dollars tend to weaken. The US dollar has no fixed direction: it often gains on safe-haven demand during global panics, but deep Fed rate cuts that narrow rate differentials can weaken it
-
Pressure on stocks: as earnings forecasts are cut, stocks usually fall during recessions, and they often rebound before economic data improve. Cyclical sectors are usually hit harder than defensive ones such as utilities and consumer staples
-
Support for gold: lower rates reduce the opportunity cost of holding gold, and safe-haven demand adds support, so gold often holds up during recessions. But in phases of acute liquidity stress, such as 2008 and early 2020, gold also fell alongside stocks for a time
Volatility usually rises during recessions, so watch for sharp moves around major data releases and keep position sizes under control.
7. Recession FAQ
Q1: Do two quarters of negative GDP growth mean a recession?
Not necessarily. "Two negative quarters" is a common rule of thumb known as a technical recession. US recessions are dated by the NBER using employment, income, spending and production data, and when US GDP briefly fell for two straight quarters in the first half of 2022, the NBER did not call a recession.
Q2: Who decides when the US is in a recession, and when is it announced?
The NBER's Business Cycle Dating Committee. Its announcements usually come several months to more than a year late: the recession that began in December 2007 was announced in December 2008, while the February 2020 peak was announced that June.
Q3: How can traders track recession risk?
Check releases such as US preliminary real GDP and the unemployment rate against market forecasts in Economic Indicators by Country, and read them together with the yield curve and PMIs. Single indicators often give false signals; it is more meaningful when several weaken at the same time.
Q4: Does the yen always rise in a recession?
No. The yen tends to strengthen when risk aversion rises, but the exchange rate also depends on the US–Japan rate gap and Bank of Japan policy. If the Fed cuts quickly early in a recession and the rate gap narrows, a stronger yen is more likely; changes in Japan's own economy or policy can produce a different result.
Q5: Do stocks always fall in a recession?
Stocks usually come under pressure, but the timing rarely lines up with the recession itself. Because stock prices reflect expected future earnings, they often start falling before a recession is officially confirmed and bottom before economic data improve. By the time the NBER announces a recession, much of the decline may already be over.
Q6: Should you buy gold during a recession?
Gold is often supported by rate cuts and safe-haven demand during recessions, but it does not rise every time. In 2008 and early 2020, when markets scrambled for cash, gold fell alongside stocks for a time. When trading gold, also watch real interest rates, the US dollar and overall market liquidity.
8. Summary
A recession is a broad and sustained contraction in economic activity. US recessions are dated after the fact by the NBER using a range of data, and "two quarters of negative GDP" is only a simplified shortcut; the first half of 2022 showed that the two can disagree.
Postwar US recessions have averaged about 10 months, with rising unemployment, central bank rate cuts and flows into safe-haven assets. The yield curve, the Sahm rule and PMIs can warn that risks are rising, but each has exceptions. Reading several indicators together is more reliable than relying on any single signal.
Further Reading
The financial market research team at Titan FX. We produce educational content for investors across foreign exchange, commodities (crude oil, precious metals, agricultural products), stock indices, US equities and digital assets.
Primary Sources
- Official bodies: National Bureau of Economic Research (NBER) Business Cycle Dating Committee; Bureau of Economic Analysis (BEA) real GDP data; Bureau of Labor Statistics (BLS) unemployment data
- Statistics: Federal Reserve Bank of St. Louis FRED (USREC, UNRATE, SAHMREALTIME, A191RL1Q225SBEA)