

Yield Curve Inversion
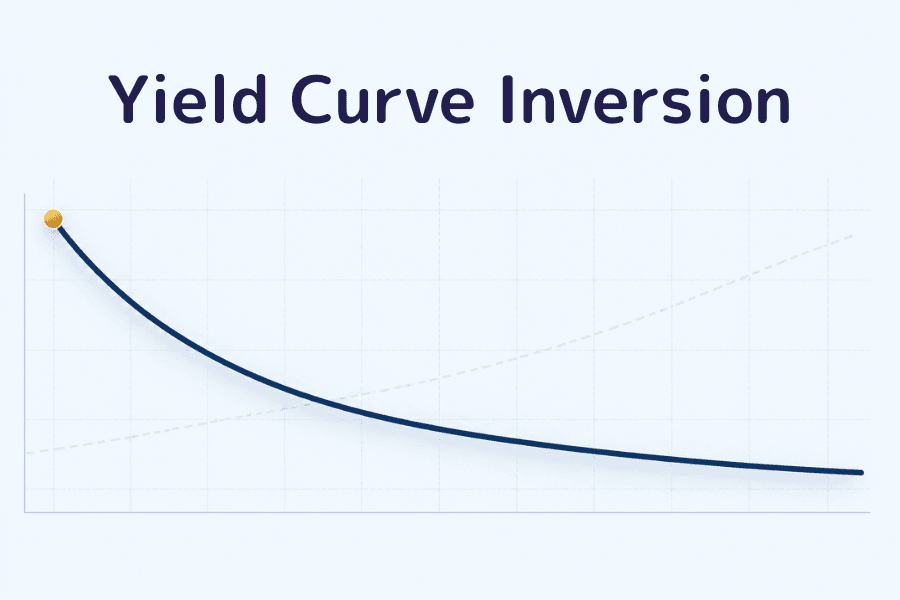
Normally, the longer money is lent, the higher the rate investors demand, so the 10-year Treasury yield is usually higher than the 2-year. An inversion signals that the market expects interest rates to be lower in the future than they are today, and usually that it expects the economy to slow.
Over the past half-century, US yield curve inversions have appeared before almost every recession, making the curve one of the most closely watched recession signals. Yet the inversion that began in 2022 and lasted more than two years has so far not been followed by a recession. This article explains the two common ways to measure an inversion, how past inversions lined up with recessions, what was different about 2022, what it means when an inversion ends, and how it affects currencies and stocks.
- Markets mainly watch two spreads, 10-year minus 2-year and 10-year minus 3-month, and they do not invert at the same time
- Most past recessions were preceded by an inversion, with a lag that has varied, typically between one and two years
- The inversion that began in July 2022 lasted until early September 2024, the longest on record, and has so far not been followed by a recession
- The end of an inversion does not mean the risk has passed; what matters is whether the curve steepened on rate-cut expectations or on rising long-term yields
- An inversion helps place the economy in the business cycle; it is not a tool for timing trades
- 1. What is a yield curve inversion?
- 2. Two ways to measure it: 10-year minus 2-year, or 10-year minus 3-month?
- 3. Does an inversion always lead to a recession? History and exceptions
- 4. 2022 to 2024: why the longest inversion was not followed by a recession
- 5. After the inversion ends: two ways the curve steepens
- 6. How a yield curve inversion affects the dollar, stocks and gold
- 7. Yield Curve Inversion FAQ
- 8. Summary
1. What is a yield curve inversion?
A yield curve is a line connecting the yields of bonds from the same issuer across different maturities. When people talk about the yield curve, they usually mean US Treasuries, from 3-month bills out to 30-year bonds. For the basics of Treasury yields and how maturities are grouped, see our dedicated guide.
The curve takes three main shapes:
| Shape | Short vs long end | Typical backdrop |
|---|---|---|
| Normal (upward-sloping) | Long-term yields above short-term | Economic expansion; the market expects rates to hold or rise |
| Flat | Short and long yields close together | Late in a hiking cycle; views on the outlook are split |
| Inverted (downward-sloping) | Short-term yields above long-term | The market expects rate cuts and slower growth |
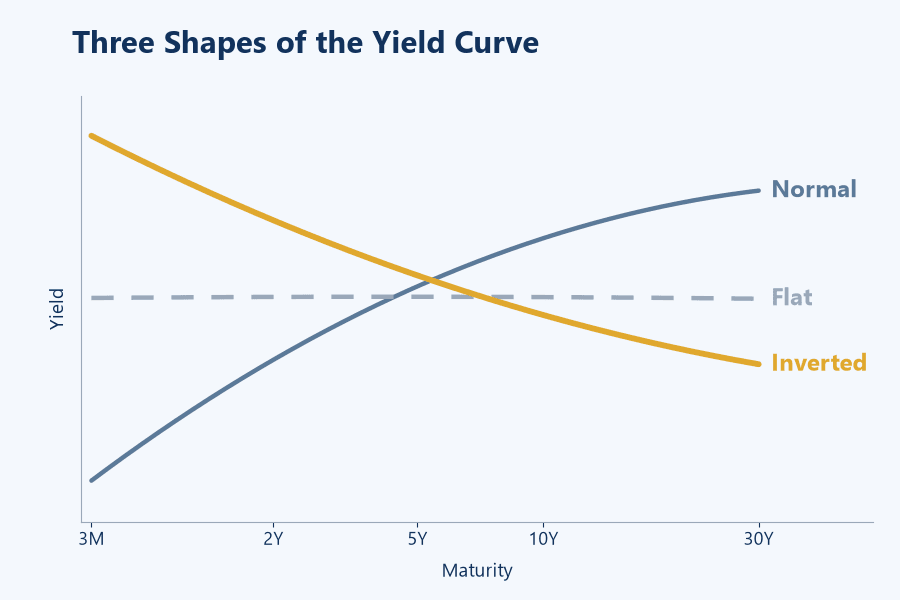
Short-term yields mainly track the policy interest rate. When a central bank raises interest rates, yields out to about two years are pushed up directly. Long-term yields reflect the market's expectation of average rates over many years, plus extra compensation for holding long-dated bonds, known as the term premium.
When a central bank pushes short-term rates very high but the market believes that level cannot last and that it will eventually have to cut interest rates, long-term yields stay below short-term yields and the curve inverts.
2. Two ways to measure it: 10-year minus 2-year, or 10-year minus 3-month?
There is no single way to measure a yield curve inversion. The two most widely quoted are:
| Spread | Calculation | Typical users |
|---|---|---|
| 10-year minus 2-year (2s10s) | 10-year Treasury yield − 2-year Treasury yield | Most often cited by financial media and traders |
| 10-year minus 3-month | 10-year Treasury yield − 3-month Treasury bill yield | The New York Fed's recession probability model and most academic research |
The difference lies at the short end. The 2-year yield already prices in the market's expectations for rate hikes or cuts over the next two years, so it moves ahead of the policy rate. The 3-month bill sticks closely to the current policy rate.
As a result, the two spreads invert at different times. In 2022, the 10-year minus 2-year spread turned negative in July, while the 10-year minus 3-month spread did not follow until late October, because the Fed was still raising its policy rate. When you see a headline about the yield curve inverting, check which spread it refers to first.
3. Does an inversion always lead to a recession? History and exceptions
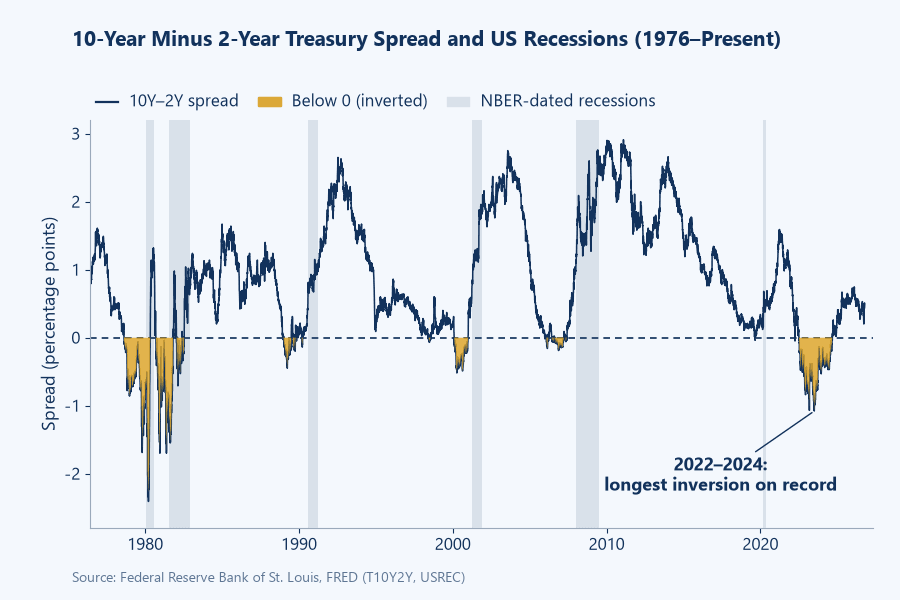
Since 2-year yield data begins in 1976, every US recession has been preceded by an inversion of the 10-year minus 2-year spread.
| Inversion | Recession began (NBER) | Notes |
|---|---|---|
| 1978 | January 1980 | Second oil shock and high inflation |
| 1980 | July 1981 | Fed raised rates sharply to fight inflation |
| 1988 to 1989 | July 1990 | |
| 1998 | No recession | Brief inversion; the Fed then cut rates |
| 2000 | March 2001 | Dot-com bust |
| 2005 to 2006 | December 2007 | Subprime crisis and global financial crisis |
| 2019 | February 2020 | The direct cause of the recession was COVID-19 |
| 2022 | None so far | See the next section |
The lag from inversion to recession varies widely, from under a year to nearly two years. An inversion can suggest the business cycle is entering its later stages, but it cannot tell you which quarter a recession will start in.
The track record is not perfect either. The brief inversion in 1998 was not followed by a recession, and while a recession did follow the 2019 inversion, its direct cause was the pandemic, so it is hard to say the curve "predicted" it. With only a handful of cases, any rule of thumb can be broken by the next exception.
US recessions are dated after the fact by a committee at the National Bureau of Economic Research (NBER), often months after they begin, so any statistic on how long a recession follows an inversion can only be known in hindsight.
4. 2022 to 2024: why the longest inversion was not followed by a recession
In 2022, the Fed raised rates rapidly to bring down inflation, and the 10-year minus 2-year spread turned negative in July 2022. It stayed inverted until early September 2024, the longest inversion on record. At its deepest in July 2023, the 10-year yield was about 1.08 percentage points below the 2-year, the deepest inversion since the early 1980s.
Based on past experience, a recession might have been expected between 2023 and 2024. In practice, the US economy did not enter an NBER-dated recession, and for a time markets described what happened as a soft landing. The main explanations for why the signal missed this time are:
-
A compressed term premium: years of quantitative easing left central banks holding large amounts of long-dated bonds, and foreign safe-haven demand for Treasuries added to it, keeping long-term yields low for a long time. That made the curve easier to invert and weakened the signal.
-
Households and companies had locked in low rates: during the pandemic, large amounts of mortgages and corporate bonds were fixed at low rates, so rate hikes hit spending more slowly and more lightly than in the past.
-
Fiscal spending supported demand: large-scale government spending kept propping up the economy while rates were rising.
-
A resilient labor market: unemployment did not rise quickly during the hiking cycle, so household income and spending held up and demand did not contract as sharply as in past cycles.
-
A longer lag: another view is that the signal has not failed, and that the lag this time is simply longer than in the past.
These explanations are still debated. The yield curve reflects market expectations, and those expectations can be distorted by policy and capital flows, so calling a recession on an inversion alone is risky.
5. After the inversion ends: two ways the curve steepens
When an inversion ends and the spread turns positive again, it does not mean the risk has passed. Several past recessions began after the curve had steepened back out of an inversion. What matters is why the curve steepened, and there are two ways it can happen, with different meanings:
| Type | What happens | Typical backdrop |
|---|---|---|
| Bull steepening | Short-term yields fall more than long-term yields | The market expects rapid rate cuts, often as the economy weakens |
| Bear steepening | Long-term yields rise more than short-term yields | Rising inflation expectations, wider fiscal deficits or a rebound in the term premium |
The end of the inversion in early September 2024 came mainly from a sharp fall in the 2-year yield on rate-cut expectations, a bull steepening. Long-term yields later rose on fiscal and inflation worries, and the curve steepened further.
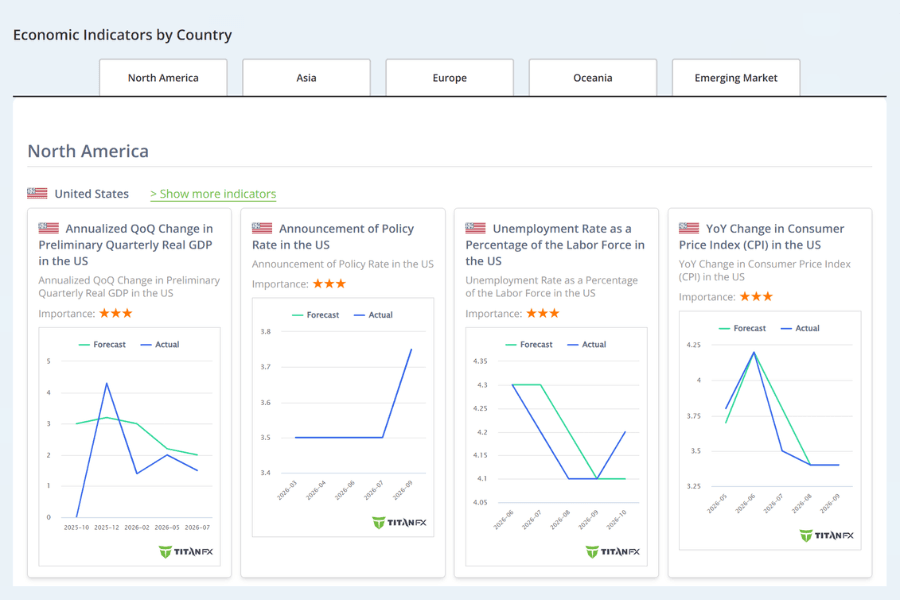
To judge which kind of steepening is underway, combine the jobs and inflation data in the Economic Calendar with the Fed meeting results in Central Bank Watch, and see which end of the curve is driving the change in yields. The United States section of Economic Indicators by Country puts recent readings for GDP, the FOMC policy rate, unemployment and CPI side by side, a quick way to check which direction growth and inflation are heading.
6. How a yield curve inversion affects the dollar, stocks and gold
An inversion does not directly push any asset up or down; the effect comes from the rate expectations and economic outlook behind it.
| Asset | What often happens during an inversion | What to watch |
|---|---|---|
| US dollar | High short-term rates usually keep the dollar's rate advantage in place | Once rate-cut expectations build and the 2-year yield falls, support for the dollar weakens |
| US stocks | Stocks do not necessarily fall early in an inversion; US stocks even hit record highs during 2022 to 2024 | Pressure on stocks usually comes from falling earnings and tighter financial conditions; banks borrow short and lend long, so an inversion squeezes their margins and financial stocks often weaken before the broader market |
| Gold | When the market starts to expect rate cuts, falling real rates usually support gold | If the inversion comes with high inflation and continued hikes, gold may come under pressure first |
For the link between the dollar and Treasury yields, see the US Dollar Index; for how the yen relates to US-Japan rate differentials, see our USD/JPY trading guide.
7. Yield Curve Inversion FAQ
Q1: Does a yield curve inversion always lead to a recession?
No. Most past recessions were preceded by an inversion, but the inversions that began in 1998 and 2022 were not followed by one. It is best used as a sign that the business cycle may be entering its later stages, read alongside data on jobs, consumer spending and corporate earnings.
Q2: Which is more accurate, 10-year minus 2-year or 10-year minus 3-month?
There is no settled answer, and each has its users. In practice, the signal is generally considered more reliable when both spreads invert at the same time.
Q3: Do yield curves invert in other countries too?
Yes. A yield curve can be drawn for any country's government bonds, and the UK, Canada and Germany have all seen inversions during hiking cycles. The US Treasury market is the largest and has the longest history, though, so most research and discussion focuses on the US.
Q4: How should traders use this indicator?
As background for reading the economy. During an inversion, watch for signs of slowing growth and shifts in rate-cut expectations; when it ends, work out whether it is a bull or a bear steepening. Actual entries and exits still come down to price, data and position management.
8. Summary
The yield curve inversion has a long record as a US recession signal, but the lag between inversion and recession varies widely, and the longest inversion on record, from 2022 to 2024, has not been followed by a recession.
More worth tracking than the inversion itself is how it ends. A bull steepening, with short-term yields falling quickly on rate-cut expectations, has tended to appear as the economy weakens. A bear steepening, with long-term yields rising on inflation or fiscal worries, points to a different kind of pressure. When you see a headline saying the curve has un-inverted, check which end is moving before drawing a conclusion.
Further Reading
- Stagflation
- What Is Quantitative Tightening (QT)?
- Business Cycle
- FOMC 2026: Schedule, Rates and Warsh Outlook
The financial market research team at Titan FX. We produce educational content for investors across foreign exchange, commodities (crude oil, precious metals, agricultural products), stock indices, US equities and digital assets.
Primary Sources
- Official data: US Treasury daily yield curve rates; Federal Reserve Bank of St. Louis FRED database (10-year minus 2-year and 10-year minus 3-month spreads)
- Business cycle dating: National Bureau of Economic Research (NBER) business cycle dates
- Research: New York Fed yield curve recession probability model; St. Louis Fed analysis of yield spreads
- Market tools: Titan FX Research Economic Calendar, Central Bank Watch, Economic Indicators by Country