Daily Chart
A daily chart is a price chart where each candle represents one day’s movement (open, high, low, close), widely used to analyze medium- to long-term trends.
Of all the timeframes, the daily chart is the baseline most swing and position traders rely on in technical analysis: by compressing a full session into a single candlestick, it strips out intraday noise and makes the underlying trend far easier to read.
This article covers the daily chart's definition, how to read it, common use cases with technical indicators, and how to display it on MT4/MT5.
- What a daily chart is and how it is structured
- How to read daily candlesticks in the forex market, including server-time rules
- How to combine the daily chart with moving averages and Bollinger Bands
- Step-by-step instructions for switching to the daily timeframe in MT4/MT5
1. Definition of Daily Chart
Basic Concept
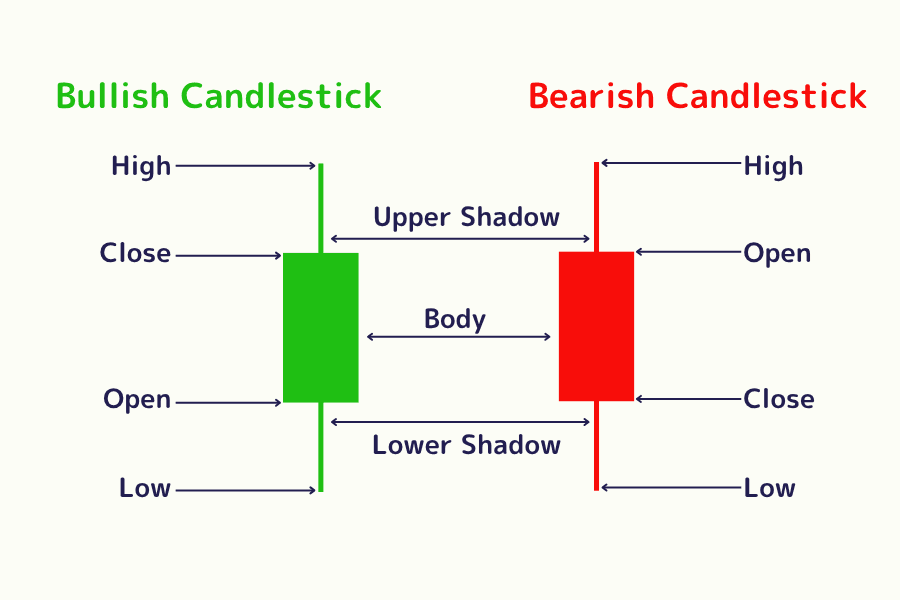
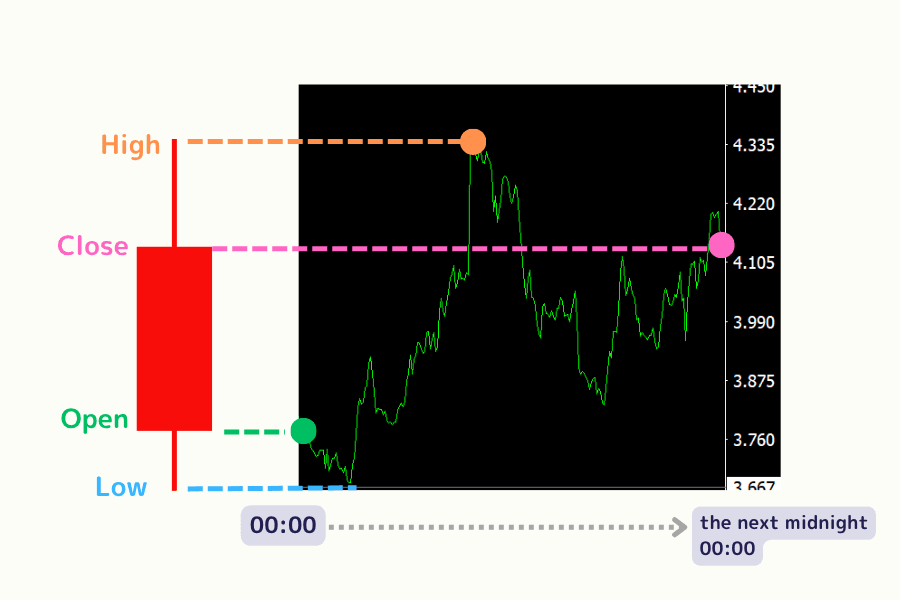
A daily chart uses one candlestick to represent one day of price movement. Each candlestick has four data points:
- Open: The price at the start of the trading day.
- Close: The price at the end of the trading day.
- High: The highest price reached during the day.
- Low: The lowest price reached during the day.
If the close is above the open, the candlestick is a bullish candle (green or white). If the close is below the open, it is a bearish candle (red or black).
Components of a Daily Chart
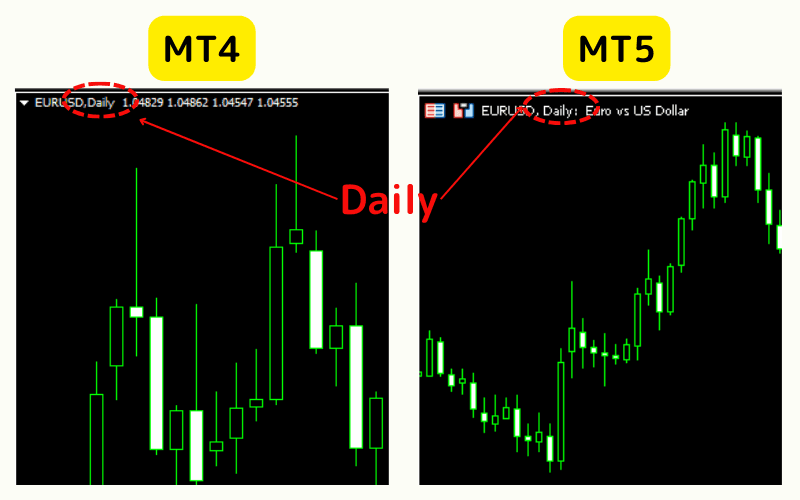
A daily chart is a sequence of daily candlesticks in chronological order.
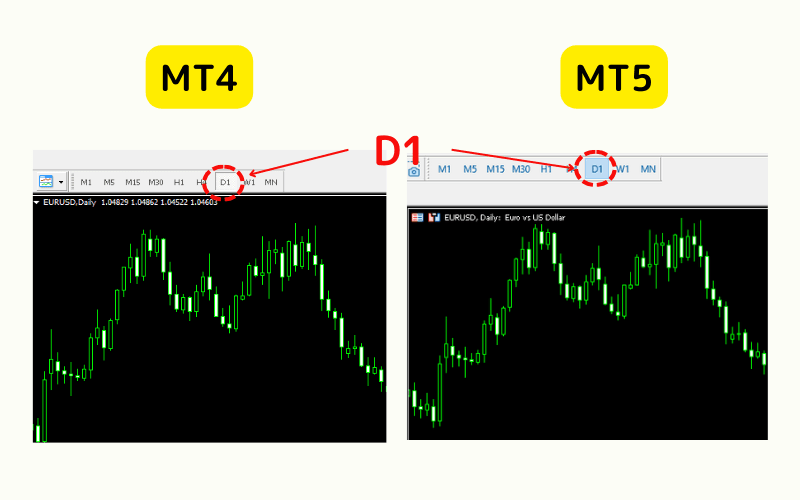
On MT4/MT5, the daily timeframe is labeled "Daily" in the upper-left corner of the chart, as shown below:
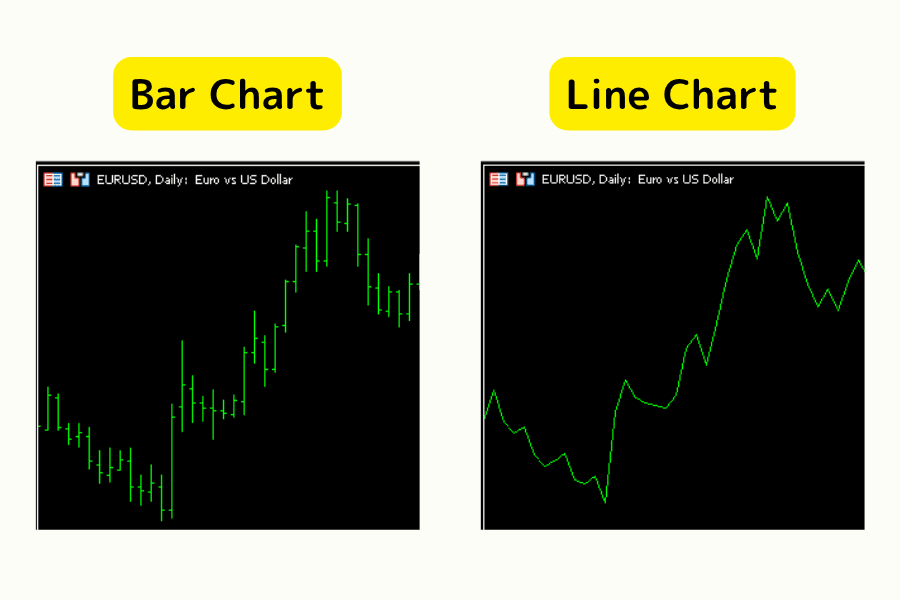
Daily data can also be shown as a bar chart (OHLC bar) or a line chart. A bar chart displays the same four prices as a candlestick, while a line chart plots only the closing price.
2. How to Read the Daily Chart
In the forex market, the daily chart's timeframe is typically defined as midnight-to-midnight server time (00:00 to 00:00).
When a bullish candlestick forms, price typically moves through the following stages during the day:
Most brokers set MT4/MT5 server time to GMT+2 (standard) or GMT+3 (DST) so each daily candle closes at 5:00 PM New York time.
| Period | MT4/MT5 Server Time | New York Time |
|---|---|---|
| Standard (Nov - Mar) | 00:00 - 23:59 (GMT+2) | 17:00 - 16:59 next day |
| Daylight saving (Mar - Nov) | 00:00 - 23:59 (GMT+3) | 17:00 - 16:59 next day |
In short, each daily candle in forex starts and ends at the 5:00 PM New York close.
3. Common Uses of the Daily Chart
3.1. Moving Averages
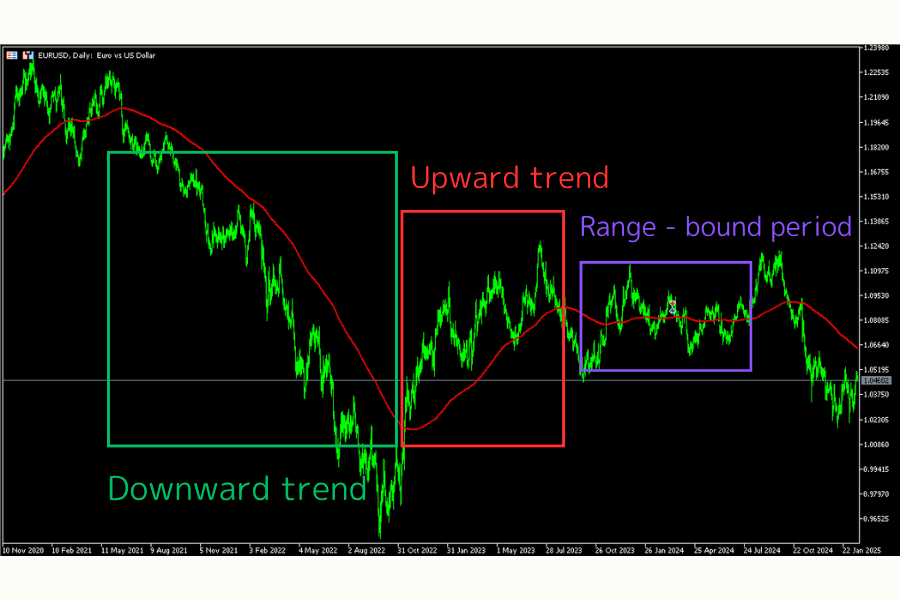
A moving average smooths price data over a chosen period and is one of the most popular overlays for daily charts.
A classic framework is Granville's Rules, which uses the slope of the moving average, the price's position relative to it, and the degree of divergence to generate signals.
The 200-day moving average on a daily chart is one of the most widely watched combinations.
3.2. Bollinger Bands
Bollinger Bands place two standard-deviation bands around a central moving average to gauge volatility. A breach of either band can signal an extreme state and a potential reversal or breakout.
Bollinger Bands Application 1: Breakout and Reversal
A break above the upper band may indicate overbought conditions and a possible downward reversal. A break below the lower band may signal oversold conditions and a potential rally.
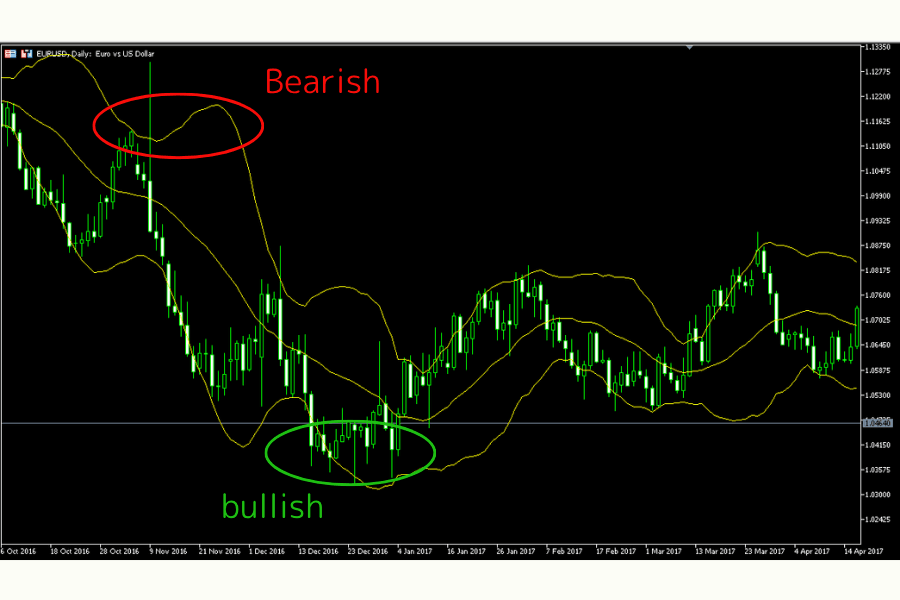
Bollinger Bands Application 2: Squeeze and Expansion
A squeeze (contracting bands) indicates declining volatility. The subsequent expansion often signals that a significant price move is about to begin.

4. Displaying Daily Chart in MT4/MT5
In both MT4 and MT5, click "D1" in the top toolbar to switch to the daily timeframe.
Timeframe abbreviations:
| Abbreviation | Timeframe |
|---|---|
| D1 | 1 Day |
| M1 | 1 Minute |
| H1 | 1 Hour |
| W1 | 1 Week |
5. FAQ
Q1: What time range does a daily chart cover?
It depends on the market:
- Forex (24-hour): Server time 00:00 to the following 00:00 (aligned with the 5:00 PM New York close).
- Stocks: The exchange's regular session (e.g., 9:30 AM - 4:00 PM ET for U.S. equities), excluding pre-market and after-hours.
Further reading: Forex Trading Hours
Q2: What is the difference between daily, minute, weekly, and monthly charts?
| Chart Type | Period per Candlestick | Best Suited For |
|---|---|---|
| Daily | One trading day | Medium- to long-term trend analysis |
| Minute | 1 min, 5 min, etc. | Scalping and intraday trading |
| Weekly | One week | Swing trading and medium-term analysis |
| Monthly | One month | Long-term macro trend analysis |
Q3: How can I use the daily chart to time entries and exits?
Study candlestick patterns (e.g., engulfing candles, doji) and overlay indicators such as moving averages or Bollinger Bands. A breakout above a key moving average or a confirmed reversal pattern on the daily chart can serve as a high-probability entry signal.
Q4: Which financial markets use daily charts?
Daily charts are used across forex, equities, futures, and cryptocurrency markets. They capture a full session of price action, making them ideal for medium- and long-term traders tracking trends and key levels.
6. Summary
The daily chart is an essential technical analysis tool for understanding medium- and long-term trends and building data-driven strategies.
Combined with moving averages, Fibonacci retracements, or other indicators, it provides actionable insight for more informed trading decisions. Mastering the daily chart will improve your analysis whether you are a swing trader or a long-term investor.
Further Reading
- What Is Technical Analysis? Essential Knowledge for Forex Trading
- Forex Basics -- How the Foreign Exchange Market Works
- What Is the FOMC? Monetary Policy and Its Impact on Markets
Titan FX's financial market research and analysis team produces investor education content across a wide range of financial instruments, including foreign exchange (FX), commodities (crude oil, precious metals, and agricultural products), stock indices, U.S. equities, and crypto assets.
Primary Sources by Category
- Trading platforms: MetaQuotes Ltd. - MetaTrader 4 / MetaTrader 5
- Technical analysis theory: John Bollinger, Bollinger on Bollinger Bands (McGraw-Hill, 2001); Joseph Granville, Granville's New Key to Stock Market Profits (Prentice-Hall, 1963)