Dividend Payout Ratio
In equity investing, the dividend payout ratio is one of the most-cited indicators. It tells you how a company splits its earnings — between rewarding shareholders today and reinvesting for future growth.
This guide walks through the basics of the dividend payout ratio, how to compute it, and how to read it correctly in practice.
- Definition: Dividend payout ratio = total dividends ÷ net income × 100% — the share of earnings the company hands back to shareholders
- Two ways to calculate: aggregate basis (total dividends ÷ net income) or per-share basis (DPS ÷ EPS); both give the same result
- Growth-stage reading: growth / startup firms — low or zero payout (capital reinvested); mature firms — high payout, sometimes near 100%
- Market differences: U.S., HK, and JP equities pay mostly cash dividends; Taiwan equities mix cash and stock dividends
- The high-payout trap: a payout ratio sustained above 100% may be funded by retained earnings or debt — always check cash-flow durability
1. What Is the Dividend Payout Ratio?
The dividend payout ratio (English: Dividend Payout Ratio), also called the dividend distribution ratio, measures how much of a company's after-tax net income is paid out as dividends.
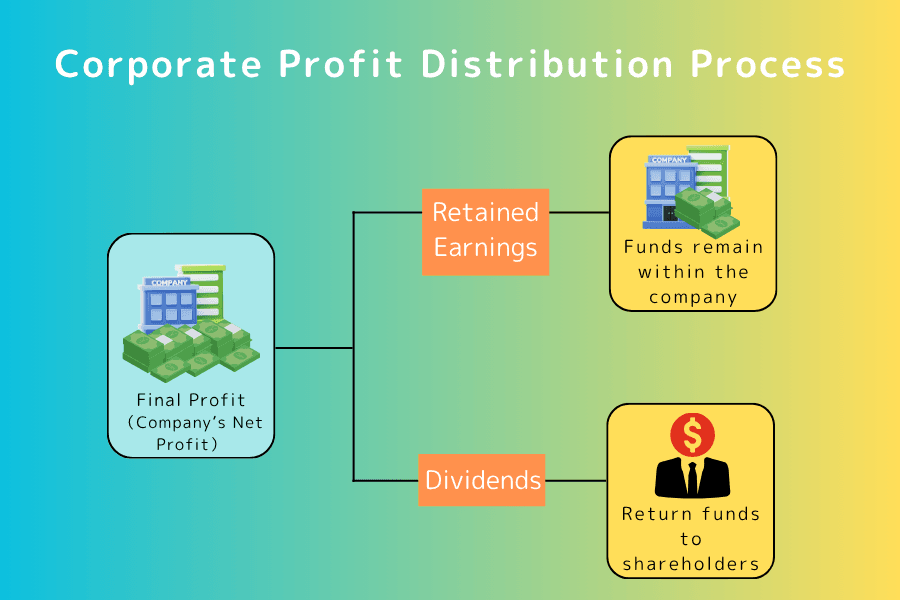
In plain terms, the payout ratio shows how much of the profit is handed back to shareholders versus how much is retained for reinvestment or reserves.
For example, if a company earns USD 1 billion in net income and pays USD 700 million in cash dividends, the payout ratio is 700M ÷ 1B = 70% — 70% returned to shareholders, 30% kept inside the company.
What the level of the payout ratio implies
Growth or startup firms: low payout, or even none — capital is funnelled into expansion and new-product development.
Mature firms or those with limited investment opportunities: high payout, sometimes close to 100% — distributing most of the earnings to shareholders.
Differences across markets
Dividend conventions vary by market:
| Market | Dividend form | Notes |
|---|---|---|
| Taiwan equities | Cash + stock dividends | Both cash and stock dividends are common; some firms favour stock dividends. |
| U.S. equities | Almost exclusively cash | Cash is the norm; stock dividends are rare. Share counts are usually adjusted via stock splits. |
| Hong Kong equities | Mostly cash | Cash dividends with occasional scrip-dividend ("shares in lieu of cash") options. |
| Japan equities | Almost exclusively cash | Cash-only model and historically lower overall payout ratios. |
2. How to Calculate It, with Examples
The payout ratio measures the share of current-period profit that goes to shareholders. There are two common methods — by totals or by per-share figures — and they give the same answer.
Method 1: Aggregate basis
- Total dividends: the sum of dividends paid to all shareholders for the period
- Net income: after-tax profit for the period
Example 1:
Company A has net income of 100 million and pays 30 million in dividends.
Payout ratio = 30M ÷ 100M × 100% = 30%
Thirty percent of the period's earnings was returned to shareholders.
Method 2: Per-share basis
- DPS: cash dividend paid per share
- EPS: net income per share
Example 2:
Company B has an EPS of 10 and pays a DPS of 4.
Payout ratio = 4 ÷ 10 × 100% = 40%
The company returns 40% of each share's earnings to investors.
Differences in Taiwan vs U.S.
- Taiwan dividends include both cash and stock dividends, but the payout ratio is typically computed from cash dividends only.
- U.S., HK, and Japanese dividends are mostly cash, so the calculation is straightforward.
Can the payout ratio exceed 100%?
Some companies report a payout ratio above 100% in a given period, usually because:
- Retained earnings from prior years fund the current dividend
- A one-off special dividend is paid
A payout ratio above 100% means current dividends exceed current profits; investors should review cash-flow durability and whether the company can sustain this dividend pace.
3. What the Payout Ratio Reveals
The payout ratio is more than an arithmetic result — it surfaces the company's dividend policy, growth strategy, and financial health.
3-1. Dividend policy
The payout ratio shows how the company distributes earnings. From it, you can read:
- Whether the company has a stable dividend habit
- Whether it leans high-payout or low-payout
- Whether it prioritises shareholder return or internal growth
A payout ratio that stays stable for years usually signals a long-term, shareholder-friendly dividend policy.
3-2. Link to the company's growth stage
The payout ratio typically tracks the growth stage:
| Company type | Payout ratio | Notes |
|---|---|---|
| Growth firms, startups | Low or none | Reinvest into expansion, R&D, and new markets |
| Stable, mature firms | Moderate | Steady dividend, with retained earnings to support operations |
| Firms with limited investment opportunities | High | Most earnings distributed; sometimes near 100% |
Reminder:
A high payout ratio isn't always "good," and a low one isn't always "bad." Read it together with the industry and the company's growth profile.
3-3. A read on capital planning
Changes in the payout ratio often reflect changes in the company's capital needs:
- If a firm expects large future investments or expansion, it may lower the payout to retain more cash internally.
- If cash flow is stable and large investments are not on the agenda, the firm may keep or raise the payout.
3-4. When a high payout becomes a warning
When the payout ratio stays above 100% for long, or clearly exceeds a reasonable level:
- The company may be paying dividends out of retained earnings or borrowing — a level that probably can't last.
- Some companies use high payouts to court investors while operating cash flow is actually under pressure. Read with caution.
4. Is a Higher Payout Always Better?
Many investors equate "high payout" with "good company," because high payouts mean more cash returned to shareholders.
But there's no absolute benchmark for a "good" payout ratio — it depends on industry, growth stage, and capital strategy.
Firms with stable cash flow such as utilities and consumer staples tend to run higher payout ratios, since their investment opportunities are limited and returning earnings to shareholders is conventional.
Growth firms and emerging-industry players, on the other hand, tend to retain earnings for reinvestment, R&D, or expansion, so payout ratios are low — sometimes zero.
A high payout does not always mean a strong company. Some high-payout companies actually have a high payout because they lack growth opportunities and cannot deploy capital productively.
A low- or no-dividend company can be the opposite: if retained earnings are used to compound shareholder value, the long-term outcome may be more favourable.
Reasons for not paying dividends include reinvestment, share buybacks, and dividend-tax minimisation — not all of which work against shareholders.
In short, the payout ratio carries no inherent "good" or "bad" judgement. Read it with industry characteristics, financial structure, cash flow, and long-term dividend policy in mind, and choose stocks that fit your strategy.
5. Frequently Asked Questions (FAQ)
Q1. Is there a standard reference range for the payout ratio?
No fixed standard — it varies widely by industry.
In general, a payout ratio of 30%–50% is considered a sensible range. Comparing with industry peers and the company's own history is more meaningful than any absolute benchmark.
Q2. What is the difference between payout ratio and dividend yield?
- Payout ratio: looks at the company side — what share of earnings is paid out as cash dividends.
- Dividend yield: looks at the investor side — what cash dividend an investor can collect relative to the share price.
The names look alike but the concepts are entirely different. Payout ratio is a ratio of earnings allocation and is not the investor's actual return — don't conflate the two.
Q3. How does the payout ratio relate to return on equity (ROE)?
There's no direct relationship, but they're useful to read together. Return on equity (ROE) measures how efficiently the company uses shareholder equity to generate returns.
A high payout ratio with a low ROE may signal that the company can't use its capital efficiently. Conversely, a high ROE with a low payout ratio often signals a focus on reinvestment for future growth.
Q4. Which well-known companies don't pay dividends, or only started recently?
Many tech giants have run no-dividend strategies for years, preferring to reinvest earnings.
- Google (Alphabet): no dividend for many years, then announced its first dividend in 2024.
- Meta (Facebook's parent): announced its first cash dividend policy in 2024.
- Amazon: still no dividend; capital is going into logistics, cloud, and new bets.
- Tesla (TSLA): long-time no-dividend, focusing on reinvestment.
These firms tend to push capital into expansion or buybacks, signalling that management believes they can create more shareholder value than a dividend would.
Q5. How is share buyback related to the payout ratio?
Share buybacks (acquiring treasury stock) and dividends are both forms of shareholder return, but they carry different tax and market signals. (1) Dividends are taxed directly at the shareholder level, while buybacks shrink the float and lift EPS, indirectly supporting the share price. (2) When a high-yield company also runs buybacks, the actual Total Shareholder Yield (payout ratio + buyback yield) is meaningfully higher than the payout ratio alone. (3) Mega-cap U.S. tech (Apple, Meta) leans heavily on buybacks, so reading payout ratio in isolation can under-state their shareholder return. Read dividends and buybacks together when judging U.S.-equity payout policy.
6. Conclusion
The payout ratio is a key indicator for understanding a company's dividend policy and how it deploys earnings. There is no absolute standard for what's "good" — read it together with industry characteristics, growth stage, and capital strategy.
When investing, look beyond the payout ratio: combine it with financial structure, cash flow, and the company's future plans for a more reasoned judgement.
Further Reading
Titan FX Research Hub — investor education across foreign exchange (FX), commodities (oil, precious metals, agriculture), stock indices, U.S. equities, and crypto assets.
Primary Sources (by category)
- Accounting and dividend policy: general public knowledge on dividend payout ratio, EPS, ROE, and related accounting and dividend-policy basics
- U.S. equity dividend data: S&P Global Indices — Dividend Data, Bureau of Economic Analysis
- Academic and corporate-finance basics: dividend policy, share buyback, and Total Shareholder Yield in public research