MT4/5 Indicator library
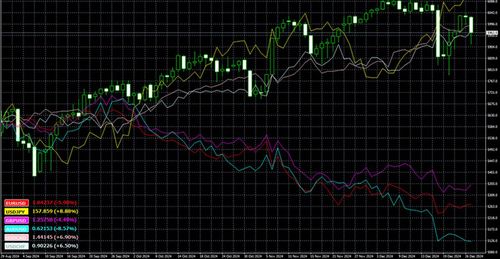
Indicator for Displaying Percentage Changes of Selected Symbols on the Chart (Titan_SymbolCompare)
 Overlay
An indicator that overlays the percentage changes of selected symbols on the chart.
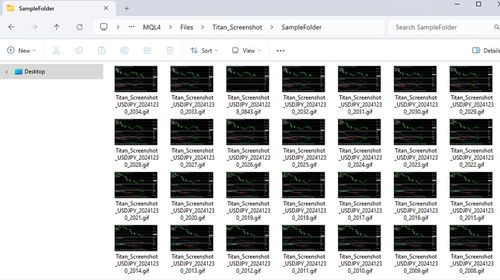
Indicator for Saving Chart Images at Specified Intervals (Titan_Screenshot)
 Others
An indicator that saves screenshots of charts for specified periods.
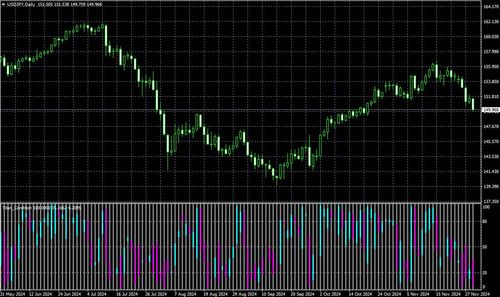
Indicator for Checking the Current Price Level (Titan_Condition)
 Subchart
An indicator that displays the current price level on a sub-chart.
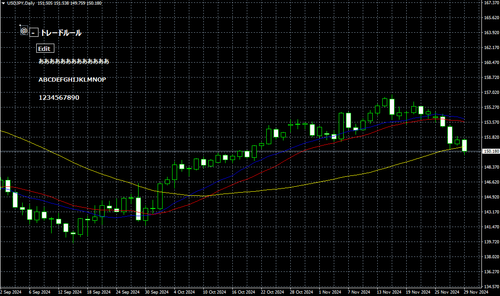
An Indicator for Displaying Notes on the Chart (Titan_Memo)
 Overlay
An indicator that allows you to freely display text notes on the chart.
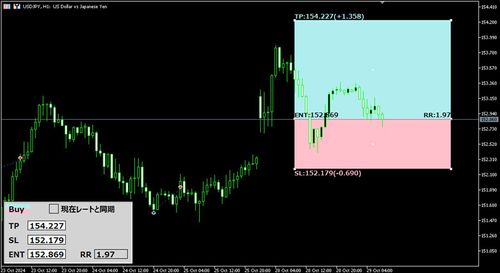
Indicator for Checking Risk-Reward Ratio (Titan_RR_Assist)
 Overlay
This is an indicator that allows you to check the risk-reward ratio on the chart.
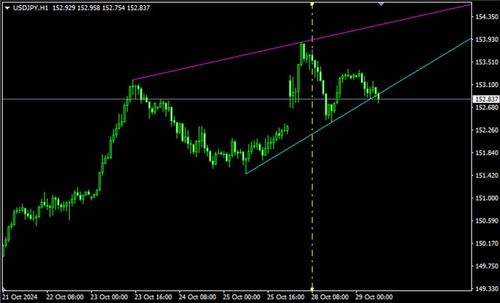
Indicator for Drawing Trendlines Based on ZigZag (Titan_ZigZag_Trend)
 Overlay
This is an indicator that draws trendlines based on ZigZag patterns.
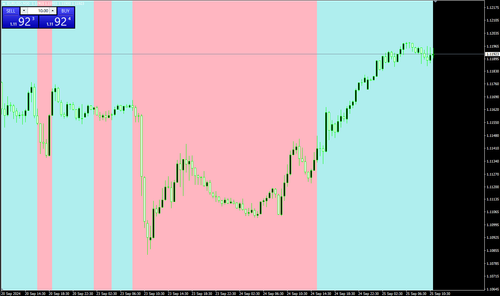
Indicator Displaying MA Slope with Background Color (Titan_MA_Trend)
 Overlay
This is an indicator that displays the slope of the moving average using the chart's background color.
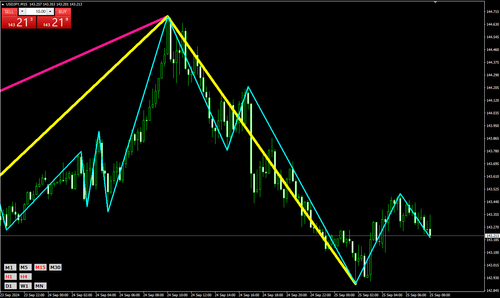
Indicator for Overlaying Multiple ZigZags (Titan_Set_Timeframe_ZigZag)
 Overlay
This is an indicator that overlays multiple ZigZags.
Indicator for Changing Symbols on the Chart(Titan_Change_Symbol)
 Others
This indicator allows you to switch symbols on the chart.
Indicator Displaying Stochastics Across Multiple Timeframes (Titan_Set_Timeframe_Stochastics)
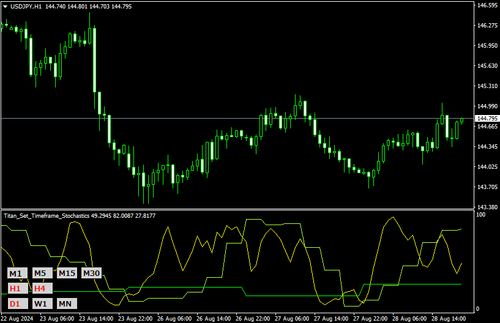 Subchart
This indicator displays multiple stochastics with different timeframes.
Indicator to draw candlesticks on the subchart (Titan_Candle_Draw)
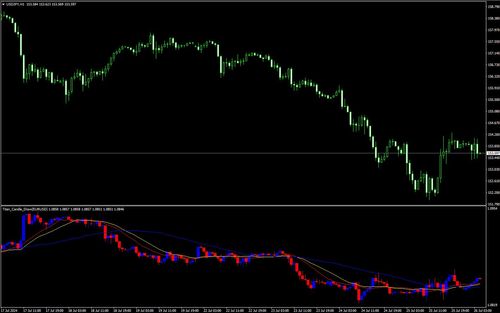 Subchart
This is an indicator to display candlesticks on subcharts.
An indicator to display the Heikin-Ashi status of up to five timeframes (Titan_Heikinashi_checker)
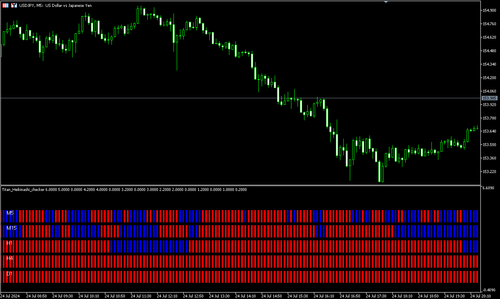 Subchart
This is an indicator to display the status of up to five Heikin-Ashi candles.
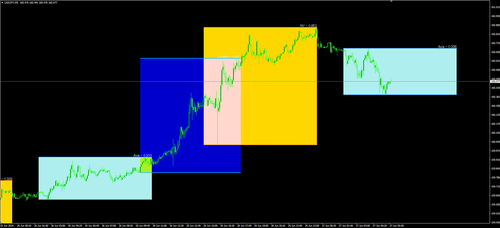
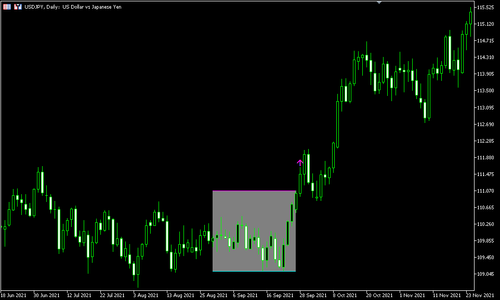
Specified Time High and Low Enclosing Indicator (Titan_Time_Range)
 Overlay
An indicator that encloses the high and low of specified times in a box.
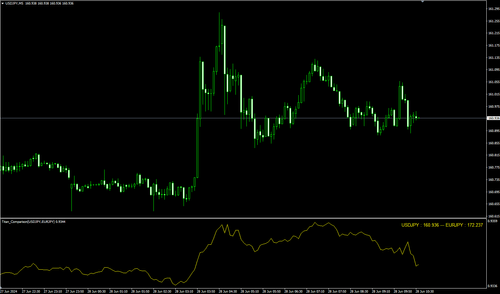
Indicator to Display the Ratio or Difference Between Two Symbols (Titan_Comparison)
 Subchart
An indicator that displays the price ratio or the price difference between two specified symbols.
Indicator alerts on ADX-based range/breakouts (Titan_ADX_Range)
 Overlay
An indicator that notifies the occurrence of ranges and range breaks based on the ADX value.
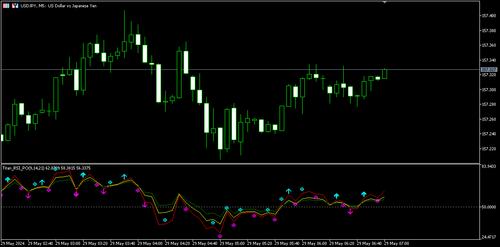
Indicator that displays three RSIs (Titan_3RSI)
 Subchart
This indicator displays three RSIs and notifies when their sequence and slope align.