MT4/5 Indicator library
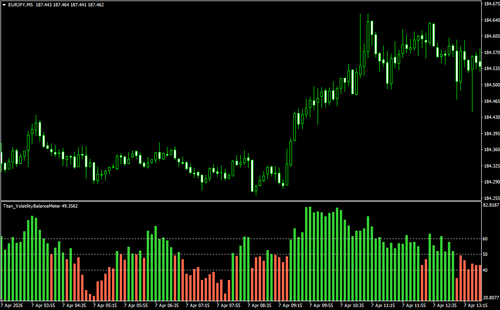
Indicator for Checking Buying and Selling Momentum (Titan_VolatilityBalanceMeter)
 Subchart
An indicator that visualizes in numerical form which has stronger momentum: buying or selling.
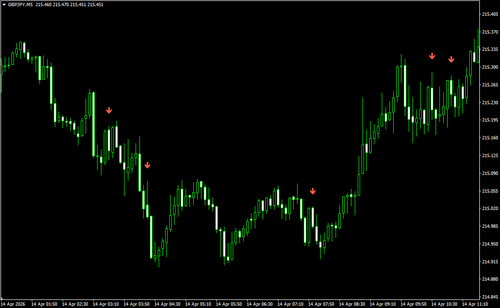
Indicator that signals a slowdown in trend momentum (Titan_MomentumFadeSignal)
 Overlay
It is an indicator that signals with arrows when buying or selling momentum is weakening.
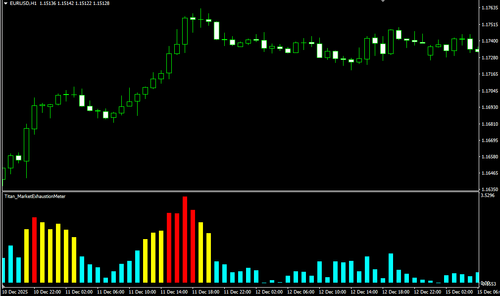
Indicator for Visualizing Market Overextension (Titan_MarketExhaustionMeter)
 Subchart
An indicator that visualizes market overextension.
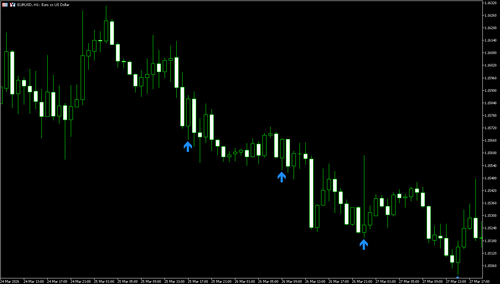
Indicator for Identifying False Breakouts (Titan_LiquiditySweepDetector)
 Overlay
An indicator that detects potential false breakouts.
An indicator for identifying reversals in range-bound markets (Titan_Range_Rebound)
 Overlay
An indicator that displays signs of potential reversals within a price range.
An indicator that allows you to monitor market compression conditions (Titan_Trend_Compression_Index)
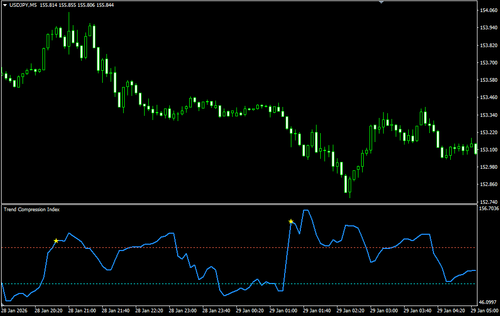 Subchart
An indicator that allows you to check market compression conditions in numerical form.
Trend Fatigue Level Indicator (Titan_FatigueLevel)
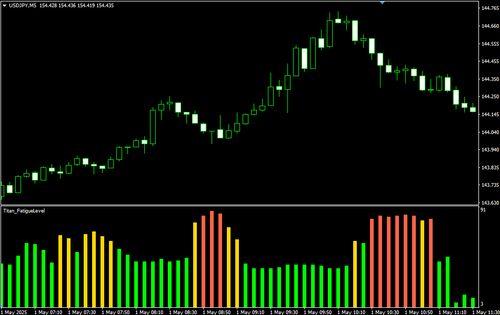 Subchart
This is an indicator designed to assess the "fatigue level" of a trend.
An indicator that signals a rebound after reaching a moving average line (Titan_RepulsionSign)
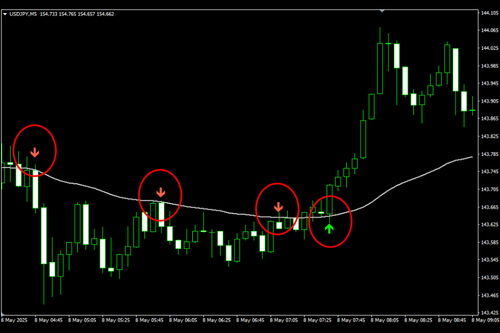 Overlay
Indicator That Signals Rebounds Near the Moving Average (MT4/MT5)
Indicator for Checking Trend Conditions Across Multiple Timeframes (Titan_Multi-Time_Trend_Panel)
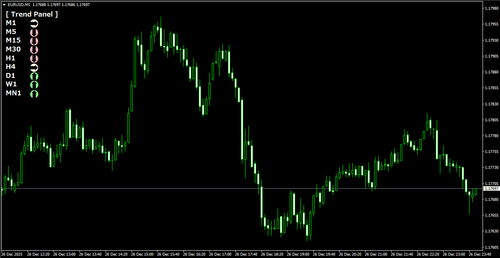 Overlay
This indicator checks trend conditions across multiple timeframes.
Indicator to Determine Volatility Conditions (Titan_Volatility_Meter_ATR_Light)
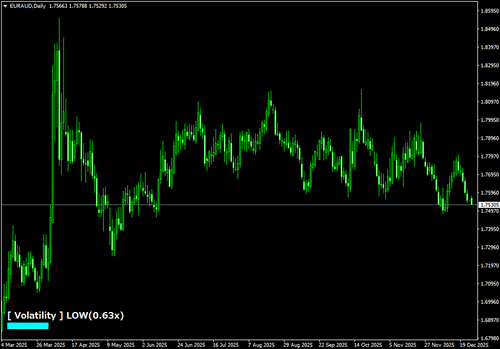 Overlay
This indicator determines market volatility in three levels.
Indicator to identify trend formation (Titan_RegimeDetector_Hybrid)
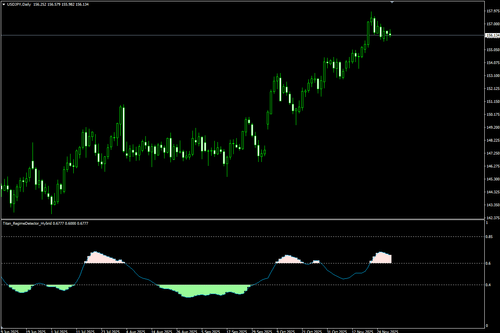 Subchart
Indicator to identify trend formation (for MT4 & MT5)
RSI with adaptive response speed based on volatility (Titan_AdaptiveRSI)
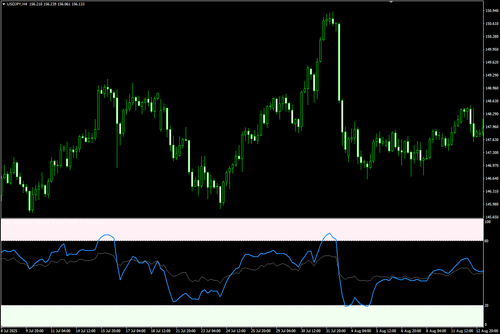 Subchart
This indicator displays an RSI with a response speed that adapts to market volatility.
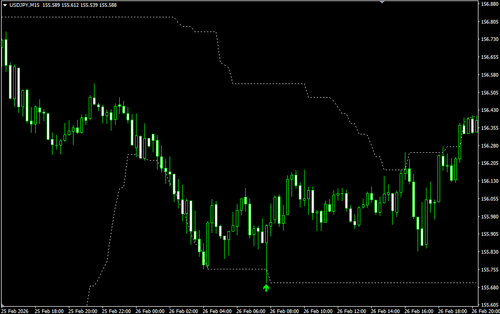
Parabolic SAR Signals with MA Filter Indicator (Titan_Parabolic_MA_Filter)
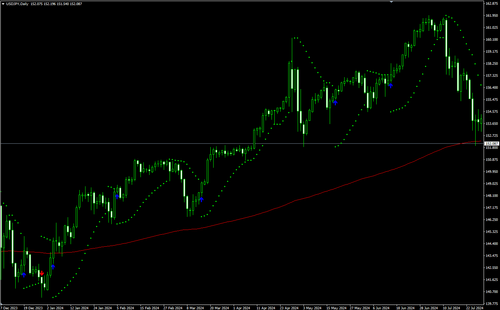 Overlay
This indicator displays Parabolic SAR buy/sell signals with a moving average filter.
Indicator Showing the Thickness of the Ichimoku Cloud (Titan_Ichimoku_Cloud_Thickness)
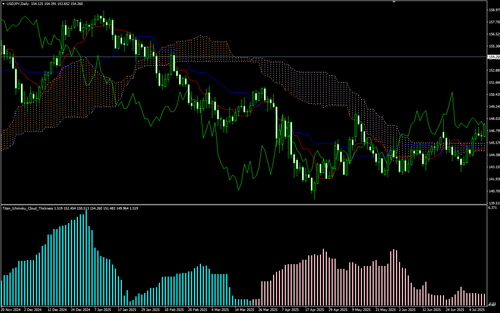 Subchart
This indicator displays the thickness of the Ichimoku Cloud as a histogram.
Indicator to Draw Auxiliary Lines at a Specified Angle to a Trendline (Titan_TrendAngleLines)
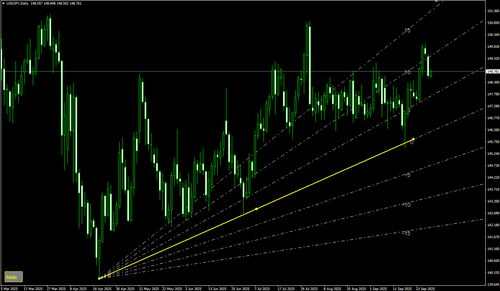 Overlay
An indicator that automatically draws auxiliary lines (angle lines) at specified angles to a trendline.
Indicator to Display Remaining Bar Time (Titan_Candle_Countdown)
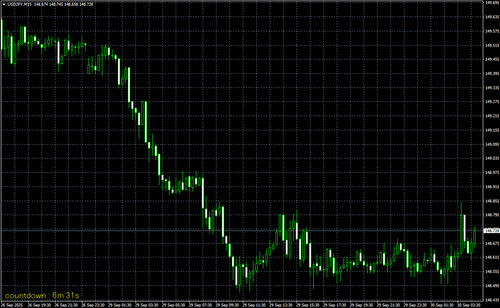 Overlay
Indicator to Display Remaining Time of the Bar (for MT4/MT5)