

What Is Agricultural Seasonality? Crop Cycles, the Seasonal Calendar, and How to Use It
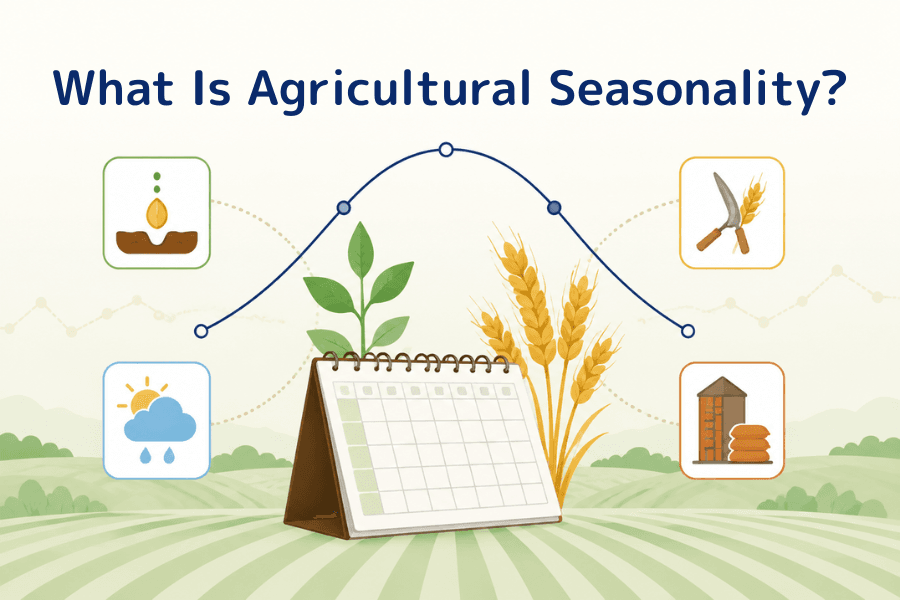
Agricultural seasonality is the tendency for crop prices to repeat a pattern within the calendar year, driven by the planting, growing, and harvest cycle. Its cause is not market psychology but the physical rhythm of farming: a crop is harvested once or twice a year, while consumption never stops.
That mismatch in timing makes agricultural prices more calendar-dependent than most other markets. From the first acreage estimates, through the weather risk of the growing season, to the stock pressure that follows the harvest, each stage has a character of its own.
This article covers how seasonality forms, the seasonal calendar for seven major crops, the three price phases of a crop year, the data that lets you track it, and — most important of all — the conditions under which seasonality stops working.
- Agricultural seasonality is the tendency for prices to repeat within a year, rooted in supply that arrives in bursts against demand that runs continuously
- Northern and southern hemisphere seasons are offset, so one crop can have two harvest peaks in a calendar year and the pattern is rarely a single wave
- A crop year splits roughly into three phases: acreage estimates at planting, the weather market during growth, and stock pressure at harvest
- Tracking it mainly means the USDA calendar — Prospective Plantings, Acreage, Grain Stocks, and the monthly WASDE
- Seasonality is a statistical tendency, not a rule. Sample period, southern-hemisphere expansion, policy, and macro forces can all override it
- 1. What is agricultural seasonality?
- 2. Where seasonality comes from: burst supply, continuous demand
- 3. The seasonal calendar for seven major crops
- 4. The three price phases of a crop year
- 5. What data should you track?
- 6. When does agricultural seasonality break down? Five reasons
- 7. FAQ: Common questions about agricultural seasonality
- 8. Conclusion: Use seasonality as context, not as a signal
1. What is agricultural seasonality?
Agricultural seasonality is the tendency for crop prices to repeat a pattern within the calendar year, driven by the planting, growing, and harvest cycle. In the same month, at the same growth stage, prices often show a similar direction or a similar volatility profile.
The effect is far more pronounced in agriculture than in other asset classes. Seasonality in equities or currencies mostly comes from fund flows and institutional convention, and it is correspondingly weak. Agricultural seasonality is tied directly to land and climate, so as long as the growing cycle stays the same, the rhythm repeats year after year.
It is worth stressing that seasonality describes a tendency, not a rule. It tells you what has historically been more likely during a given window; it does not promise that this year will follow.
2. Where seasonality comes from: burst supply, continuous demand
The root of agricultural seasonality fits in one line: supply is discontinuous, demand is continuous.
Wheat is harvested once a year. So is corn. But flour mills and feed plants take delivery every day. A full year of consumption has to be carried by one harvest — or by a small number of them — with inventory filling the gap in between. Stocks drain from their post-harvest peak down to a trough just before the next crop comes in, and prices move along that same inventory curve.
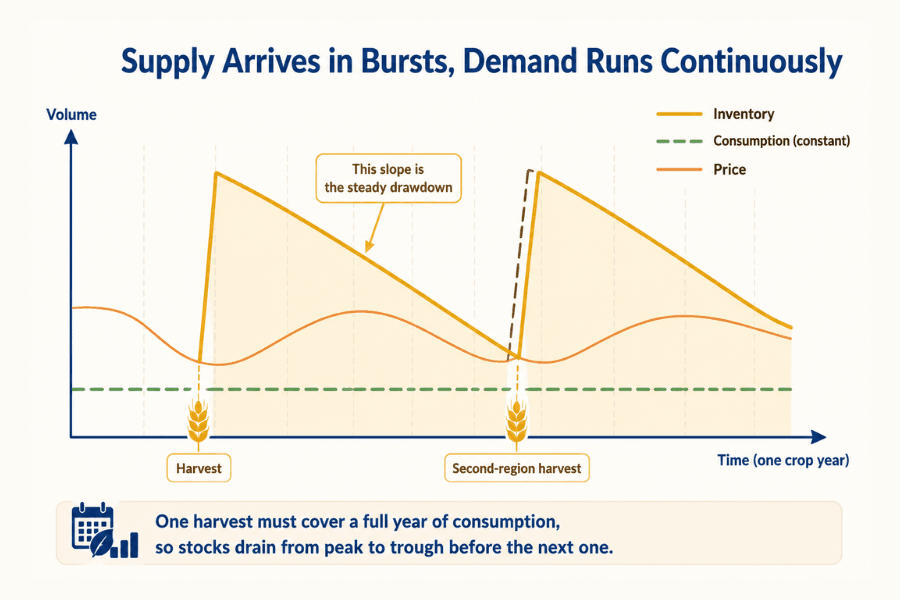
Three structural consequences follow.
-
① A supply shock at harvest: a large volume of new crop reaches the market in a short window and physical pressure concentrates. This is where seasonal pressure is most visible, though the actual price direction still depends on the size of the crop relative to what the market already expected — a harvest that disappoints can send prices up during harvest.
-
② A risk premium during the growing season: while the crop is still in the field, final yield is unknown. Any weather anomaly can rewrite the balance sheet, so the market pays up for that uncertainty and volatility widens noticeably.
-
③ Carrying costs accumulate: post-harvest stocks require storage, insurance, and financing. Those costs show up in the spread between nearby and deferred contracts. When stocks are ample and carry dominates, the futures curve tends to sit in contango, with deferred months above nearby ones; once the physical market tightens and the front is bid up, the curve can flip into backwardation.
One variable is easy to overlook: the hemispheres are offset. A crop harvested in the northern autumn is often planted in the southern spring. Soybeans are the clearest case — the US harvest runs September to November, Brazil's runs January to April of the following year — so a single calendar year contains two supply peaks. Agricultural seasonality is therefore usually several cycles layered on top of each other rather than a single wave.
3. The seasonal calendar for seven major crops
The table below sets out the rhythm for the main crops. It is the starting point for understanding seasonality; each crop's varieties, growing regions, and demand structure are covered in its own guide.
| Crop | Main regions and season | Price-sensitive window |
|---|---|---|
| Wheat | Northern winter wheat sown in autumn, harvested Jun–Jul; spring wheat sown in spring, harvested Aug–Sep | Overwintering; heading and grain fill in May–Jun |
| Corn | US planted Apr–May, harvested Sep–Nov; South America adds a second crop | Pollination in July |
| Soybeans | US planted May–Jun, harvested Sep–Nov; Brazil planted Sep–Dec, harvested Jan–Apr | Pod fill in August; South America in Jan–Feb |
| Cotton | US planted Apr–Jun, picked Sep–Dec; India and China are the other two major producers | Boll set in Jun–Aug |
| Sugar | Brazil Center-South crush Apr–Nov; India and Thailand Oct–Apr | Start of the Brazilian crush; the Asian monsoon |
| Coffee | Brazil picked May–Sep; Vietnam Oct–Jan | Brazilian frost risk in Jul–Aug; rainfall at flowering |
| Cocoa | West African main crop Oct–Mar, mid crop May–Aug | The dry Harmattan wind season in West Africa |
Two things to keep in mind when reading it. First, harvest months are the range under normal climate conditions; the actual timing shifts from year to year. Second, because the same crop has offset seasons in different regions, what a "harvest window" does to the global price depends on that region's share of world supply, not on the month alone.
Where these contracts trade is worth knowing too. Corn, soybeans, and soft red winter wheat (SRW) are listed on the Chicago Board of Trade (CBOT). Wheat has two other major contracts: hard red winter (KC HRW), also part of CME Group, and hard red spring wheat on MIAX Futures, the exchange formerly known as MGEX. Cotton, sugar, coffee, and cocoa are softs and trade mainly on ICE Futures U.S. Before looking up a futures quote, check which exchange and which contract you actually want.
4. The three price phases of a crop year
Laid out across a full crop year, the price rhythm falls into roughly three stages.
-
① Planting: acreage sets the ceiling How many acres go in the ground caps this year's supply. In this stage the market trades planting intentions and actual acreage, and prices are unusually sensitive to the relevant reports. Planting delays, or farmers switching crops on relative prices, get priced in here.
-
② Growing: the weather market Once the crop reaches its critical growth stage the market enters what traders call a weather market. For US corn, July pollination matters most; for soybeans it is pod fill in August. Every forecast can move the price during this window, and volatility usually reaches its annual high. Note that a weather market cuts both ways — when conditions turn favorable, the accumulated risk premium unwinds quickly and the fall can be just as sharp.
-
③ Harvest: stock pressure New crop arrives in volume, physical supply concentrates, and prices tend to carry seasonal pressure through this window. Once harvest ends, attention shifts from yield to demand and the pace of stock drawdown, and the tempo slows.
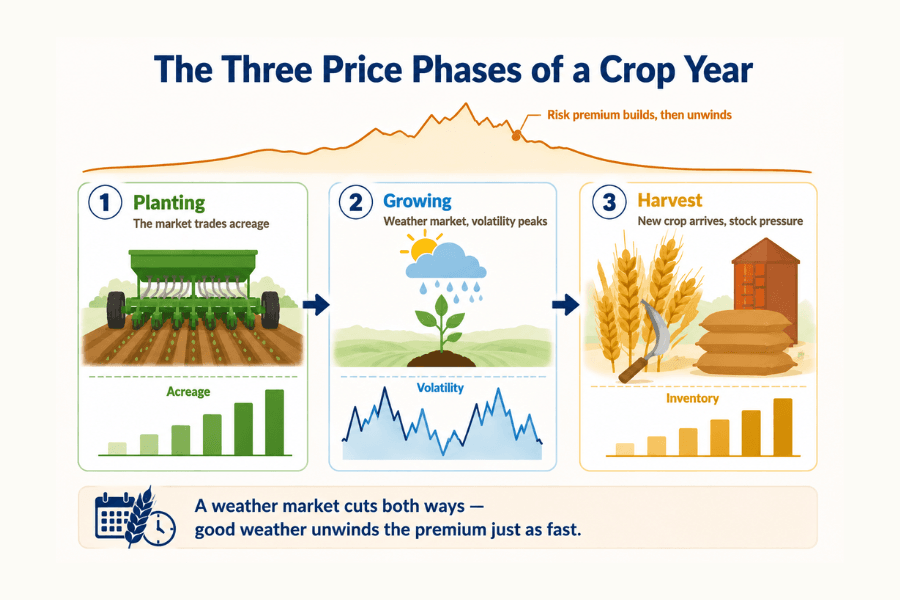
There is no clean line between the stages, and the handover varies by crop and by region. What it gives you is a framework for locating where the market currently sits.
5. What data should you track?
Seasonality is trackable because the key information arrives on a fixed schedule. Taking the most globally influential source, the US Department of Agriculture (USDA):
-
Prospective Plantings: released at the end of March, surveying what farmers intend to plant and how much. It is the first pricing anchor of the new crop year.
-
Acreage: released at the end of June, correcting the March intentions with actual data. A large gap between the two frequently moves the market.
-
Grain Stocks: quarterly, revealing actual volumes held at each point in the chain — the check on whether demand is as strong as assumed.
-
WASDE: the monthly World Agricultural Supply and Demand Estimates, updating production, consumption, and ending stocks for the major crops worldwide. It is the single most watched report at monthly frequency.
How the market reacts to any of these depends on the gap between the number and what was expected beforehand, not on whether the number went up or down. Ending stocks can be revised higher and the price can still rally, if the revision was smaller than the market had already priced.
Release dates and market expectations can be checked ahead of time on the economic calendar, and prices themselves against instrument pages such as live corn quotes.
Beyond the official data, two other inputs belong in the picture: medium-range weather forecasts for the main producing regions, particularly the current phase of El Niño or La Niña, and policy changes in exporting countries — an export tax or ban interrupts the seasonal rhythm immediately.
6. When does agricultural seasonality break down? Five reasons
This is the section that matters most when you actually use seasonality.
-
The sample period decides the shape: a seasonality chart is an average of prices over some number of past years. Ten, twenty, or thirty years can produce visibly different curves. When you see an attractive seasonal chart, check which window it used.
-
The average hides the dispersion: an average showing a gain in a given month does not mean every year gained. It can be six small up years and four large down years and still average positive. Reading only the average badly understates the risk.
-
The production map is changing: southern-hemisphere capacity has expanded enormously over the past two decades, and Brazil now exports more soybeans than the United States. As supply sources spread out, the classic northern-hemisphere-centered patterns get diluted.
-
Macro and policy are stronger forces: the dollar, energy and freight costs, biofuel policy, export controls, geopolitical conflict — any one of them can override seasonality completely. Crude oil alone affects grains through two channels at once, transport costs and biofuel demand; for background, see crude oil CFDs.
-
Known information gets priced early: the crop calendar is public and every participant can see it. The better known a seasonal pattern becomes, the more likely it is to be anticipated or arbitraged away.
Trade Agricultural CFDs with Titan FX
Titan FX offers wheat, corn, soybean, sugar, coffee, cocoa and cotton CFDs with up to 50:1 leverage and the flexibility to go long or short without holding the physical commodity.
7. FAQ: Common questions about agricultural seasonality
Q1: Can you trade agricultural seasonality? Can it be used as a buy or sell signal on its own?
It works as a framework for trading, but not as a standalone signal. Seasonality describes a historical tendency, and the average conceals wide year-to-year variation.
In practice you use it as a starting point: establish which stage of the crop year you are in, which reports are coming, and what the market is currently sensitive to — then check this year's stocks, weather, futures spreads, and positioning data to confirm whether the historical setup actually holds. When those conditions do not line up, seasonality is not a reason to enter.
Q2: Do all agricultural commodities have the same seasonality?
No. Grains harvested once a year — wheat, corn, soybeans — have the clearest patterns. Perennials such as coffee and cocoa are more complex, because tree condition carries across years; Brazilian arabica also alternates between higher and lower yielding years. Sugar sits under two influences at once, the agricultural season and energy policy, because Brazilian cane can be switched between sugar and ethanol.
Q3: What is a "weather market"?
It is the state of the market during the window when a crop is at a critical growth stage and final yield is still unknown, leaving prices highly sensitive to forecasts. For northern-hemisphere grains it usually falls between June and August. The window is characterized by wider volatility and strong news sensitivity, and it moves in both directions — when the weather improves, the risk premium unwinds just as quickly.
Q4: What does the hemisphere offset mean in practice?
It gives global supply more than one refill point in a year, and it means there is more than one seasonal low. Practically, two things follow: you cannot watch a single producing region, and a shortfall in one region may be partly offset by a good crop in another. South America's rising share is actively reshaping patterns that were originally built around the northern hemisphere.
Q5: How does seasonality relate to contango and backwardation?
They are connected but not the same. Contango — deferred above nearby — reflects storage, insurance, and financing costs, and is the normal structure when stocks are ample. Backwardation, with the nearby month above deferred, usually appears when the physical market is tight. After harvest, as stocks rebuild, the curve tends to return to contango; if yield concerns emerge during the growing season and the front is bid up, it can flip. The spread structure is the live check on whether a seasonal assumption is actually holding.
Q6: Where should a beginner start?
Pick one crop, put its seasonal calendar and key report dates on your calendar, and watch a full year. Building a feel for one crop's rhythm is far more effective than tracking seven at once. The grains — corn, soybeans, wheat — have the most transparent data and the most regular reporting, which makes them a good starting point.
Q7: Is agricultural seasonality the same as "sell in May" in equities?
No. Calendar effects like "sell in May" come mainly from fund flows and trading behavior, have no clear physical cause, and their robustness has been debated for years. Agricultural seasonality has a physical constraint behind it — the growing cycle. Even so, it remains only a tendency, and it can be overridden by larger forces just the same.
8. Conclusion: Use seasonality as context, not as a signal
The value of agricultural seasonality is that it hands you a map of the year. Knowing whether you are in the planting window, the weather market, or the harvest tells you what the market is trading, which headlines it is sensitive to, and roughly where volatility should sit.
What it cannot tell you is whether this year will follow the pattern. The choice of sample period, the expansion of southern-hemisphere capacity, policy and macro variables can all strip the historical average of its value. The workable approach is to use seasonality to form an expectation, then use this year's actual data — acreage, stocks, spread structure — to confirm or reject it.
For those who want exposure to agricultural markets, contracts for difference such as soybean CFDs offer two-way participation without handling physical delivery, though leverage and overnight costs belong in the plan as well. Whichever instrument you use, read the calendar first and talk about entries second.
Further Reading
- Wheat CFD Trading Methods and Advantages
- Sugar CFD Trading Methods and Advantages
- CFD (Contract for Difference): what it is
- What is leverage trading? Types, calculation methods, and strategy
- ETF (Exchange-Traded Fund): what it is
Titan FX's financial-markets research and analysis team. We cover foreign exchange (FX), commodities (oil, precious metals, agricultural products), stock indices, U.S. equities, crypto assets and other major asset classes, producing educational content for investors.
Primary Sources (by Category)
- Official statistics: USDA World Agricultural Supply and Demand Estimates (WASDE), USDA National Agricultural Statistics Service, USDA Foreign Agricultural Service
- Exchanges: CME Group — Grain and Oilseed, ICE Futures U.S. — Softs
- Climate data: NOAA Climate Prediction Center — ENSO
- Investor education: Regulator materials on commodity futures, spread structure, and event risk management