
 Home
Home- Investment Guide: Strategies for Stocks, Forex, and Metals
- Which Instruments Move Together? 171 Pairs Measured
The Correlation Matrix Measured: Which Instruments Move Together, and Which Do Not Hold
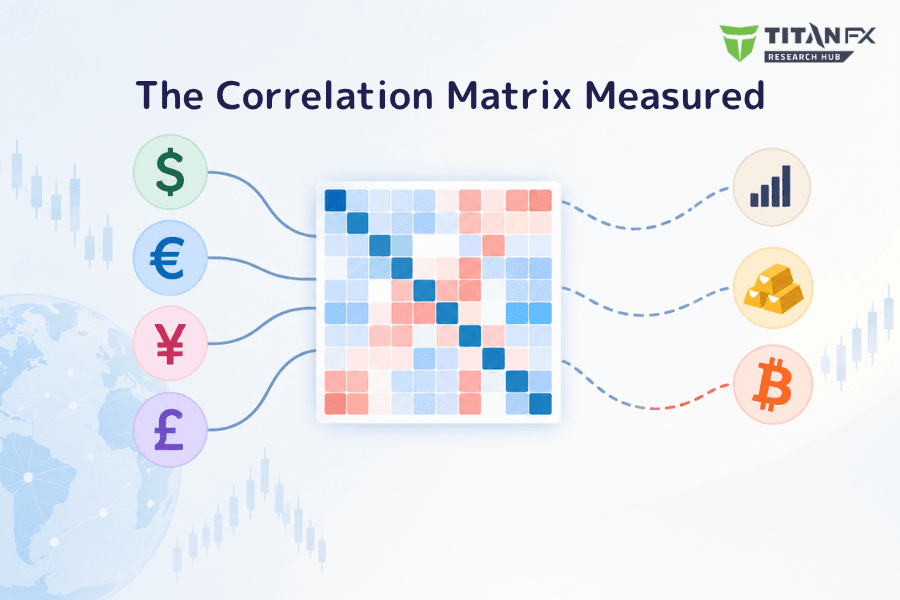
The pairs that do move together double as a list of what not to hold in the same direction at once: gold and silver stay above +0.83 across all five periods, US500 and NAS100 above +0.83, the Australian and New Zealand dollars above +0.77. At the other end the gaps are wide enough to flip the sign — the Dow against Brent crude runs from +0.10 to -0.67.
- Pairs that hold across all five periods: gold × silver (+0.83 to +0.93), US500 × NAS100 (+0.83 to +0.94), AUD × NZD (+0.77 to +0.84)
- The use for that list is direct: holding these in the same direction at once is running the same trade twice
- Pairs that do not hold: the Dow × Brent crude moves from +0.10 to -0.67 across the five periods, so even the direction changes
- 44 of the 171 pairs flip sign at least once — when you read a coefficient, switch the period once before you act on it
- Relationships that cross asset classes are on average less stable than those inside one class
- Low correlation is a clue for diversification, but assets that look unrelated in calm markets can fall together under stress
- A correlation coefficient describes how closely two things move, never which one is driving the other
1. What the Correlation Matrix Is, and When You Need It
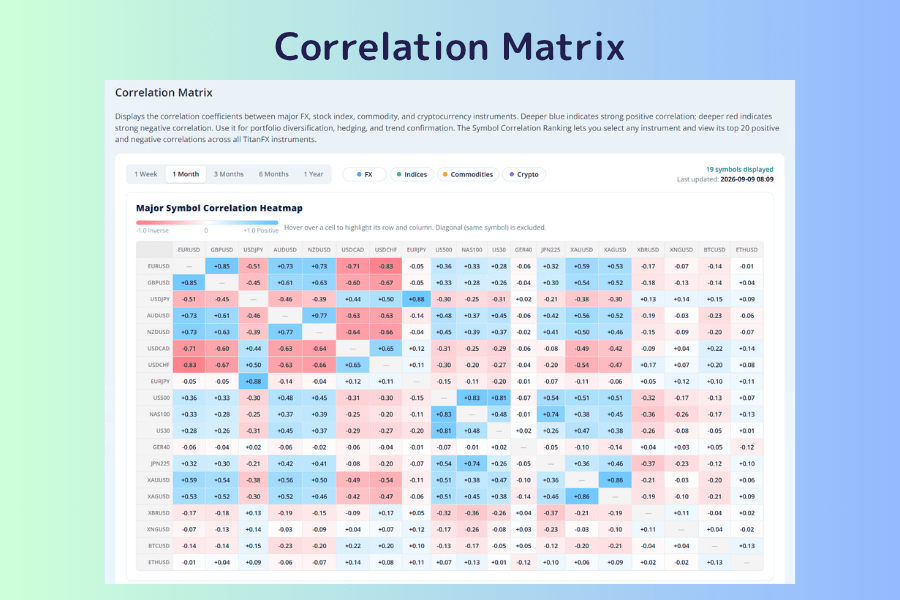
The Correlation Matrix is a grid of colored cells showing how closely each pair of 19 major instruments moves together, across FX, indices, commodities and crypto. Every cell holds a correlation coefficient: a value from -1 to +1, calculated from the rate of change over the selected period. Near +1 the two move in the same direction, near -1 in opposite directions, near 0 there is no clear relationship between them. Deeper blue means stronger positive correlation, deeper red stronger negative.
Below the grid sits the Symbol Correlation Ranking, which takes any instrument and lists its twenty highest correlations across all TitanFX symbols, as separate positive and negative lists.
Four Situations That Call for It
| Where you are | What you want to know |
|---|---|
| You hold a position and want to open another | Whether the new one is a repeat of the old |
| You hold three or four instruments and feel diversified | Whether they share a common factor |
| You want a hedge for an existing position | Which instruments move the opposite way |
| An instrument is moving and you want corroboration | Whether the things that usually track it are following |
The tool page calls these four avoiding overlapping positions, diversification and risk management, hedging, and trend confirmation. All four are asking the same question: do these two instruments move alike?
A full guide sits at the bottom of the tool page: the definition of the coefficient and the instruments covered, the color scale (deep blue above +0.7, white between -0.3 and +0.3, deep red below -0.7), and how to apply the four uses above. For the theory, the recurring patterns and the hedging applications, see What Is Currency Correlation? Patterns, Risk & Titan FX Tools. None of that is repeated here — what follows is the measured figures.
Open the Correlation Matrix2. Which Instruments Really Do Move Together
The pairs below hold the same direction and a similar strength across all five periods — 1 week, 1 month, 3 months, 6 months and 1 year. The right-hand column is the gap between the highest and lowest of the five values; the smaller it is, the more the five periods agree.
| Pair | 1W | 1M | 3M | 6M | 1Y | Spread |
|---|---|---|---|---|---|---|
| XAUUSD × XAGUSD | +0.93 | +0.86 | +0.90 | +0.86 | +0.83 | 0.10 |
| US500 × NAS100 | +0.90 | +0.83 | +0.92 | +0.92 | +0.94 | 0.11 |
| US500 × US30 | +0.85 | +0.81 | +0.83 | +0.86 | +0.85 | 0.05 |
| AUDUSD × NZDUSD | +0.77 | +0.77 | +0.77 | +0.84 | +0.84 | 0.07 |
| USDCAD × USDCHF | +0.59 | +0.65 | +0.66 | +0.69 | +0.67 | 0.10 |
| USDJPY × USDCHF | +0.50 | +0.50 | +0.57 | +0.61 | +0.60 | 0.11 |
| GBPUSD × USDCAD | -0.63 | -0.60 | -0.61 | -0.60 | -0.60 | 0.03 |
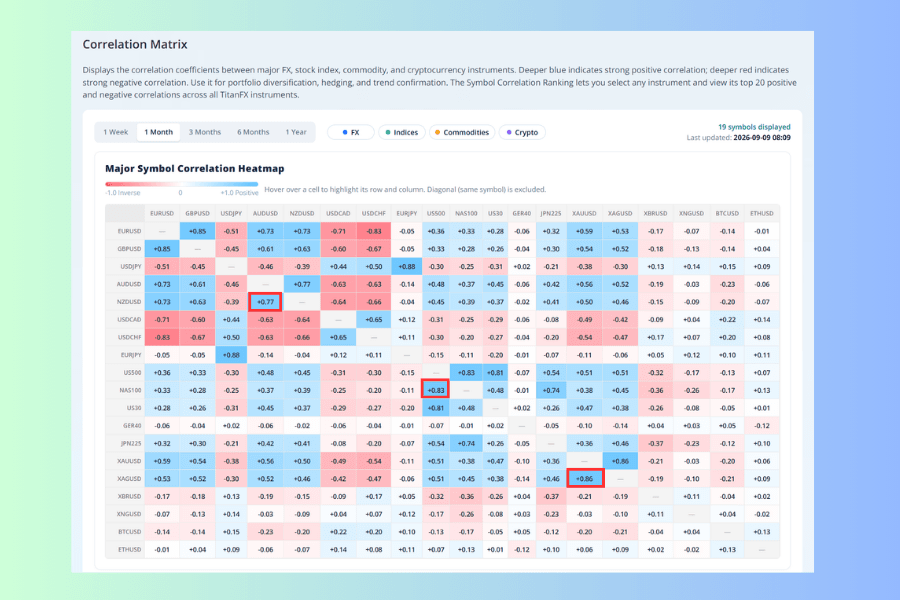
The first six are positive, the last one negative. Holding the positive pairs in the same direction at once is running the same trade twice; holding the negative pair in the same direction cancels one against the other.
Most of these have a common factor that explains the link:
- Gold and silver are both precious metals sharing the same real-rate and safe-haven line, though silver also carries industrial demand, which is why the coefficient never reaches +1
- US500, NAS100 and US30 are different slices of one equity market, driven by the same overall risk appetite, with heavily overlapping constituents
- The Australian and New Zealand dollars both contain a dollar factor, and the two economies are structurally close
- GBPUSD and USDCAD are negatively correlated in large part because the dollar sits on opposite sides of the two quotes
A common factor can explain the consistency, but the coefficient itself proves nothing about causation — sterling and the Canadian dollar each have their own drivers, and the dollar line is simply the stronger one.
These figures were read on 9 September 2026, and a pair only made the list after all five periods were checked. That does not mean the consistency lasts forever; the method and its limits are in section 4.
3. Which Ones Do Not Hold
At the other end, changing the period changes the answer:
| Pair | 1W | 1M | 3M | 6M | 1Y | Spread |
|---|---|---|---|---|---|---|
| US30 × XBRUSD | +0.10 | -0.26 | -0.67 | -0.53 | -0.35 | 0.77 |
| US500 × XBRUSD | +0.14 | -0.32 | -0.51 | -0.43 | -0.27 | 0.65 |
| AUDUSD × US500 | +0.07 | +0.48 | +0.60 | +0.69 | +0.63 | 0.62 |
| USDCHF × US500 | +0.14 | -0.30 | -0.28 | -0.50 | -0.20 | 0.64 |
| EURUSD × XAUUSD | -0.02 | +0.59 | +0.54 | +0.31 | +0.19 | 0.61 |
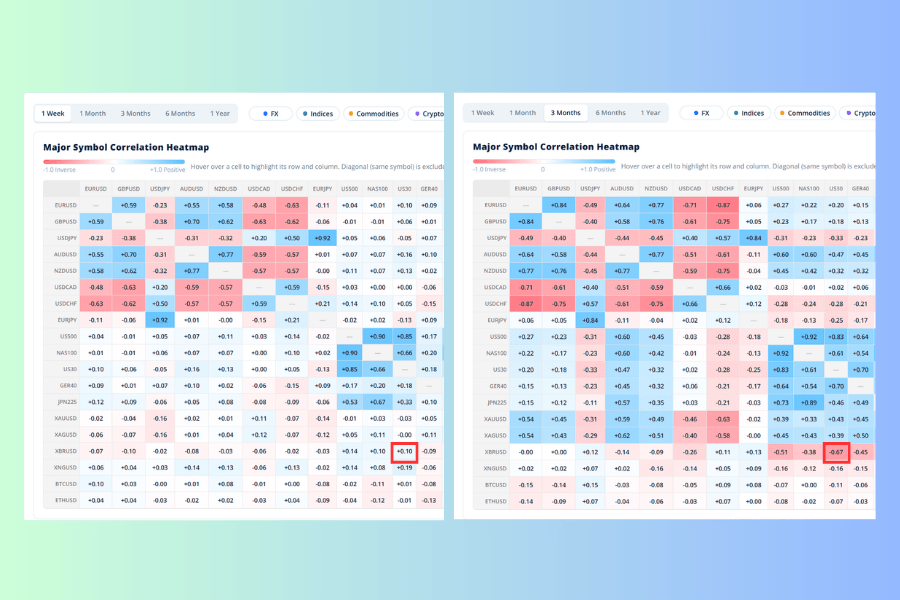
The Dow against Brent crude is the clearest case: +0.10 over one week, -0.67 over three months. The same question — does the Dow move with oil or against it — gets opposite answers from two periods. The euro against gold behaves similarly: barely related over one week (-0.02), moderately positive over one month (+0.59), and back down to +0.19 over a year.
What marks this group out is that the common factor driving the two changes with the market environment. Take equity indices and oil: when the market is watching demand growth the two can rise together, and when the focus shifts to a supply shock or to inflation pressure from higher oil, the direction can reverse.
Of the 171 pairs, 44 flip sign at least once — one pair in four can be read as pointing the opposite way depending on which period you chose. Relationships crossing asset classes are less stable still: the 45 same-class pairs average a spread of 0.24, the 126 cross-class pairs 0.31.
The Most Extreme Pair
BTCUSD and ETHUSD have the widest spread of all 171:
| Period | 1W | 1M | 3M | 6M | 1Y |
|---|---|---|---|---|---|
| BTCUSD × ETHUSD | +0.86 | +0.13 | +0.90 | +0.89 | +0.91 |
Four of the five sit between +0.86 and +0.91; only the one-month reading is +0.13. The ranking makes it plainer still. With BTCUSD as the base symbol, ETHUSD sits second over one week and drops to nineteenth over one month, while XRPUSD and BCHUSD stay in the top two on both.
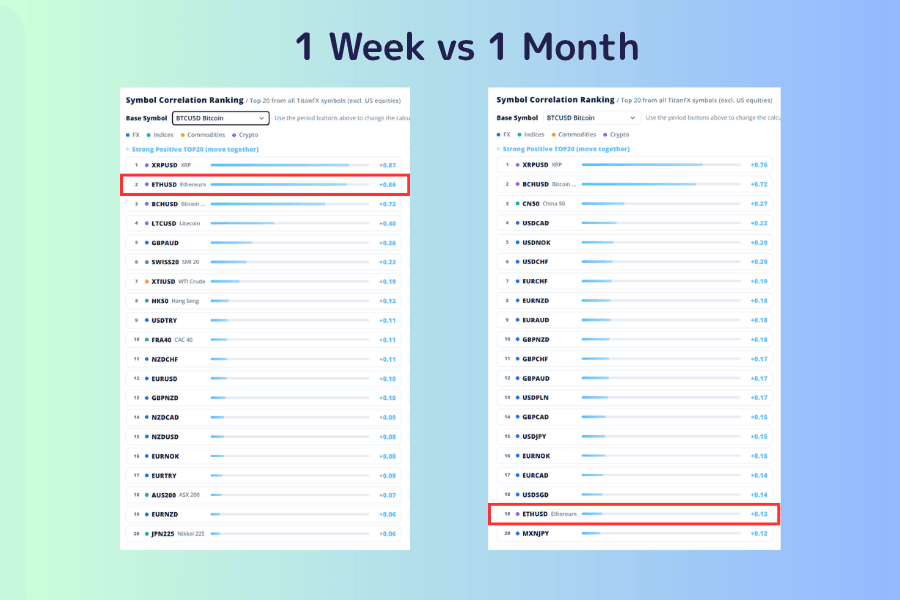
All that establishes is that over this particular month the two moved together noticeably less. Which side went its own way, whether a handful of large daily moves caused it, and whether the decoupling continues — none of that can be read off a correlation coefficient.
4. Where These Numbers Come From
Nineteen instruments taken two at a time without repetition gives 19 × 18 ÷ 2 = 171 pairs. Each was recorded once at each of the five periods, and the highest of the five values minus the lowest was used as the comparison figure. For BTCUSD and ETHUSD, +0.91 minus +0.13 gives a spread of 0.78.
Across all 171:
| Pairs | Share | |
|---|---|---|
| Flip sign at least once | 44 | 26% |
| Spread above 0.5 | 27 | 16% |
| Spread above 0.3 | 65 | 38% |
The Limits of This Comparison
The figures were read off the tool rather than recalculated from raw prices, so this is a comparison, not an independent verification.
The sampling has a limit too. All five periods run back from the same end date, so the samples overlap heavily — the week sits entirely inside the month, and the month inside the three months. The spread therefore measures only how closely periods of different lengths agree right now; it cannot establish that any relationship is stable over the long run. Judging stability properly calls for rolling correlations taken from different end dates.
The coefficient itself also carries no causation, says nothing about the size of the moves, and does not cover tail risk in extreme conditions.
5. Three Things to Do in Practice
Match the Period to Your Holding Time First
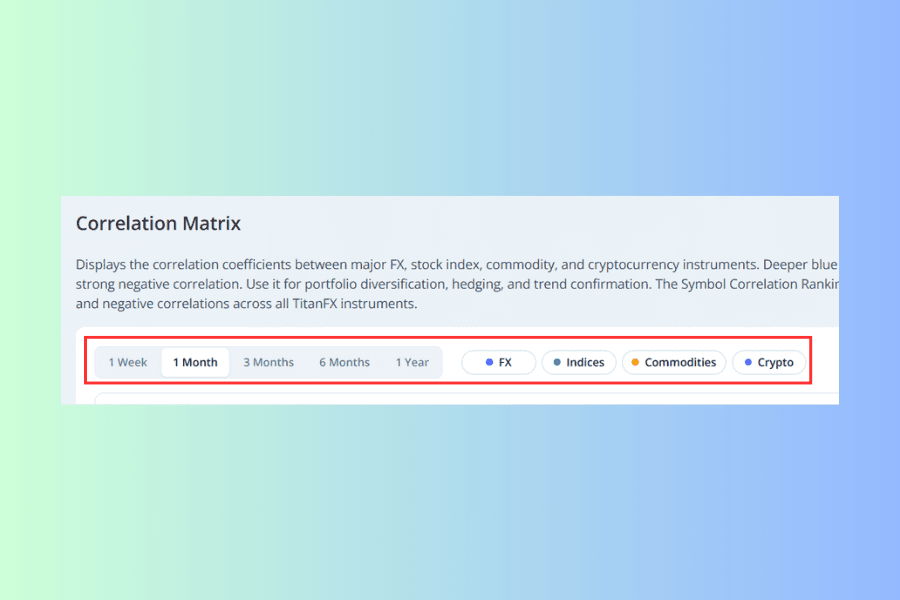
When you read a coefficient, check that its period is close to how long you intend to hold, then switch to one period longer and see whether the direction survives. That step exists to screen out the 44 pairs that flip. A -0.6 at your main period against a +0.3 one step longer is not a negative correlation solid enough to carry a hedge for several weeks.
Low Correlation Is Not a Guarantee of Diversification
The instinct behind diversification is to find instruments whose coefficient sits near zero, and that is only part of the clue. Near zero in calm markets does not mean the same diversification holds under stress — in a liquidity squeeze or a market-wide deleveraging, risk assets that normally have nothing to do with each other tend to fall together. Beyond the coefficient, the size of the moves, the liquidity and the asset type all matter.
Which End of the Ranking to Read
The Symbol Correlation Ranking splits into a positive and a negative list, each sorted by strength. To check for overlapping exposure, what you want is the top of the positive list — those are the instruments least suited to holding in the same direction at once.
To find low-correlation candidates, the ranking is only a starting point: it shows the twenty strongest in each direction, so much of the near-zero middle may never appear. Rather than working backwards from the ranking, confirm a candidate's coefficient directly on the matrix, then switch through a few periods to see whether it suddenly climbs.
The Five-Step Screen6. FAQ
Q1: How high does a coefficient have to be to count as high?
The tool page's color scale gives a reference: above +0.7 is strongly positive, +0.3 to +0.7 moderately positive, and -0.3 to +0.3 weak. The level alone is not enough, though — check that it matches your holding period and that other periods are not giving the opposite signal. On a two or three day trade, +0.8 over the last week may matter more than +0.6 over a year; for a long-term allocation it runs the other way, and whether the relationship survives the longer periods carries more weight.
Q2: Why does the matrix cover only 19 instruments?
Nineteen is the scope of the main heatmap, chosen to put representative FX, index, commodity and crypto instruments side by side. For anything else, use the Symbol Correlation Ranking below it, which covers all TitanFX symbols excluding US equity CFDs — though only one base instrument at a time.
Q3: Why does the same pair differ so much between periods?
Switching the period changes the stretch of history the calculation draws on, and therefore the market conditions included in it. The same two assets can move together to different degrees in different environments, so a changing coefficient is normal rather than a sign of bad data.
Q4: Can I verify these figures myself?
If you can obtain price data for both instruments over the same period at the same frequency, you can calculate the coefficient yourself and compare. The Titan FX historical data page supplies one-minute bar CSVs covering FX, indices, commodities, US stocks and crypto, but each category's symbol list is limited, so not every pair used here can be downloaded from it. For how to get the files, see How to Download Historical Data: One-Minute Bar CSV, Account Type and Importing into MT4 and MT5.
Q5: Does a high correlation mean one instrument is driving the other?
No. Correlation describes how closely two things move together and says nothing about which influences which; both may equally be driven by a third factor. That is exactly what the tool page's own caveat is pointing at.
Q6: Which is more stable, same-class or cross-class relationships?
Across these 171 pairs, the 45 same-class pairs average a spread of 0.24 against 0.31 for the 126 cross-class pairs, so crossing classes is somewhat less stable. Individual pairs still have to be judged on their actual figures, but working through the same-class relationships first using the category filters, then opening the full set to examine the cross-class ones, is the more efficient order.
7. Summary
The pairs that move together are worth remembering, because the same list tells you what not to hold in the same direction at once: gold and silver, US500 and NAS100, US500 and US30, the Australian and New Zealand dollars all held the same direction and a similar strength across every one of the five periods. GBPUSD and USDCAD are a stable negative pair, so holding both the same way cancels one against the other.
The pairs at the other end are not a basis for anything. The Dow against Brent crude runs from +0.10 to -0.67 across the five periods, so not even the direction agrees; 44 of the 171 pairs flip sign at least once, and relationships crossing asset classes are less stable than those inside one class.
So when you read a coefficient, switch the period once before you use it. The step takes under ten seconds and screens out a quarter of the misreadings.
Every figure here was read on 9 September 2026. The coefficients are recalculated daily, so the values you see will differ from these; the way to read them does not.
Further Reading
- Titan FX Market Analysis Tools: Finding the Right One at Each Step of a Trade
- How to Read the Economic Calendar: Filters, Columns and Post-Release Price Moves
- How to Check Swap Points: Reading the Columns, the Triple-Charge Day and Holding Cost
- What Is Market Sentiment? How It Drives Forex and CFD Markets
- The 2% Rule: Risk Management and Position Sizing for Beginners
Titan FX Trade Strategy Research Lab. We create educational content across a broad range of financial instruments, including forex (FX), commodities (crude oil, precious metals, agricultural products), stock indices, US equities, and crypto assets, for investors.
Primary Sources (by Category)
- Matrix data: Titan FX Research Correlation Matrix, correlation coefficients for 19 instruments across 171 pairs at the 1 week, 1 month, 3 month, 6 month and 1 year settings, read on 9 September 2026
- Ranking data: the same tool's Symbol Correlation Ranking, base symbol BTCUSD, top 20 positive correlations at 1 week and 1 month
- Tool specification: the color scale, period buttons, category filters and usage guide of the Correlation Matrix page as displayed