
 Home
Home- Investment Guide: Strategies for Stocks, Forex, and Metals
- Do Seasonal Patterns Still Hold? Ten Years of Monthly Data
Do Seasonal Patterns Still Hold? Five Calendar Effects Against Ten Years of Data
Seasonality is the idea that certain months have tended to rise or fall, and that the pattern keeps coming back. Sell in May, the January Effect and the Santa Claus Rally have been around for decades, but most of them started in the stock market, and most were drawn from data that is now thirty years old or more.
Markets change. The sayings stay. Titan FX's Seasonality Analysis gives the average return and win rate for every month across 19 instruments, so you can check whether any of these claims still turn up in the past ten years.
This article starts with the two numbers the tool gives you and how to read them, then tests five familiar claims against monthly data from 2016 to 2025, shows why no single month is strong enough to trade on by itself, and finishes with what the numbers are actually good for.
- The tool gives two numbers per month, average return and win rate, and they sometimes disagree
- Sell in May: the US500 averaged +6.9% over ten years in both halves of the year
- The weak month in US equities is September; the strong stretch at year-end lands in November
- Of the five claims, only gold's early-year strength holds up in full over the past decade
- The January Effect is about small caps and the Santa Claus Rally about seven trading days, and monthly data cannot test either
- In every instrument, the strongest month's average is smaller than the range that same month covered over ten years
- 1. What Seasonality Analysis gives you: average return and win rate
- 2. Why average return and win rate have to be read together
- 3. Three equity claims: Sell in May, the January Effect, the year-end rally
- 4. Two claims outside equities: gold in January, the yen in March
- 5. Why no single month works as an entry signal
- 6. What the numbers are good for
- 7. Frequently Asked Questions
- 8. Summary
1. What Seasonality Analysis gives you: average return and win rate
Seasonality Analysis is one of the market analysis tools in Titan FX Research, and it shows how an instrument has behaved in each month of the year. One table does most of the work: twelve months across, years down, and the bottom two rows holding the average return and win rate for the whole period.
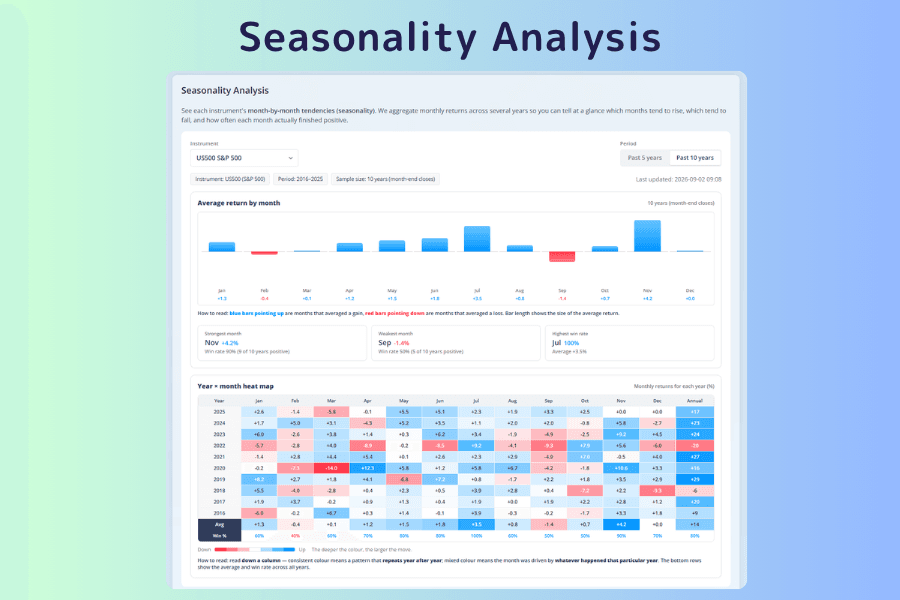
Those two rows look similar and measure different things.
- Average return: the mean move for that month over the period. A couple of extreme years will drag it a long way.
- Win rate: how often that month finished positive. A win rate of 70% over ten years means seven of the ten rose.
Three summary cards sit above the table and name the strongest month, the weakest month and the month with the highest win rate for that instrument. If you would rather not work through the heat map cell by cell, start there.
Nineteen instruments are available, covering equity indices, gold and silver, crude and natural gas, seven currency pairs and crypto. The period switches between Past 5 years and Past 10 years, and every figure below comes from the ten-year view, which means 2016 through 2025.
Open Seasonality Analysis2. Why average return and win rate have to be read together
March in USD/JPY has a ten-year average of +0.5% and a win rate of only 30%. The two numbers point in opposite directions.
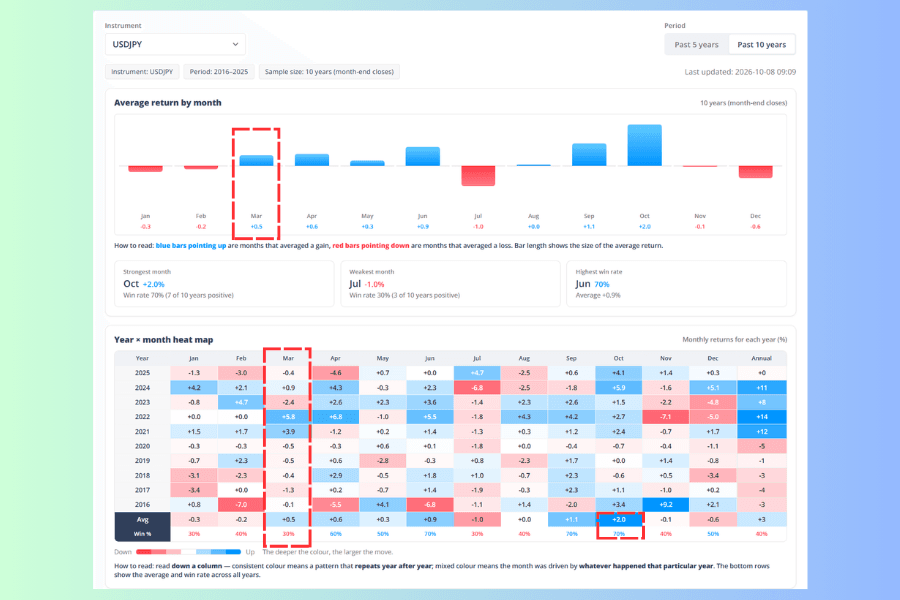
Walk down the March column one year at a time and you can see why. March fell every year from 2016 to 2020, and again in 2023 and 2025. Only three years rose: 2021 (+3.9%), 2022 (+5.8%) and 2024 (+0.9%). All seven declines came in under 2.4%, while the 2021 and 2022 gains ran close to 4% and 6% — enough on their own to pull the average into positive territory.
Read the average alone and March looks like a dollar-strong month. Read the win rate alone and you get the opposite. One counts how often something happens, the other measures how big it is when it does.
| Average return | Win rate | What it means in this data |
|---|---|---|
| Positive | High | More years rose, the size held up, and the decade was fairly consistent |
| Positive | Low | More years fell, but a few large gains pulled the average up |
| Negative | High | More years rose, but a few deep declines pulled the average down |
| Negative | Low | More years fell and the size was genuinely negative |
Only the first and fourth rows have both numbers pointing the same way. Land on either of the middle two and there is no shortcut: you have to go back and read the ten cells in that column.
3. Three equity claims: Sell in May, the January Effect, the year-end rally
All three started in the stock market, so S&P 500 (US500) and Nasdaq 100 (NAS100) are the instruments to check. Here is the result first.
| Claim | What it traditionally says | Monthly data, 2016 to 2025 |
|---|---|---|
| Sell in May | May to October underperforms November to April | Both halves averaged +6.9% over ten years, with no edge visible |
| January Effect | January returns run high | The original claim is about small caps, which the tool does not carry |
| Santa Claus Rally | The seven trading days from late December into early January are strong | Monthly returns cannot isolate those seven days. On a monthly view the strong month is November |
Sell in May: no difference between the two halves
The full version is "Sell in May and go away", and the claim is that May through October does worse than November through April.
To test it you have to compound each half-year, one year at a time. Monthly returns multiply rather than add: +10% followed by -10% leaves you at -1%, while adding the two gives you 0%.
The table below gives the compounded return of each half for the US500. The winter half spans two calendar years and is labeled by the year its November falls in; the stretch that began in November 2025 is still running.
| Year | Summer half (May to Oct) | Winter half (Nov to following Apr) |
|---|---|---|
| 2016 | +3.0% | +12.0% |
| 2017 | +8.0% | +2.8% |
| 2018 | +2.2% | +9.2% |
| 2019 | +2.9% | -4.8% |
| 2020 | +13.7% | +27.5% |
| 2021 | +10.1% | -10.3% |
| 2022 | -6.5% | +7.8% |
| 2023 | +0.2% | +20.2% |
| 2024 | +13.6% | -2.0% |
| 2025 | +22.4% | Still running |
| Average | +6.9% | +6.9% |
| Win rate | 90% | 67% |
The averages are identical. On win rate the summer half comes out ahead. Head to head, the winter half takes five years to four. Three ways of looking at it, three answers — and the only thing they add up to is that neither half has an edge over the other. The NAS100 lines up the same way, with the summer half averaging +11.3% against +9.7% for the winter.
One month in the summer really is weak. September has the lowest average in both indices, at -1.4% for the US500 and -1.7% for the NAS100.
The January Effect and the Santa Claus Rally: the strong month is November
Both of these were defined on a scale that monthly data cannot reach. The January Effect was first described in small caps and in stocks that had lagged the previous year, and none of the tool's 19 instruments is a small-cap index. The Santa Claus Rally covers the last five trading days of December plus the first two of January — seven trading days in all — and the tool works in whole months, so those seven days cannot be pulled out.
Widen it to the large-cap indices and to whole months, and neither end of the year stands out. January in the US500 averaged +1.3% with a 60% win rate, and December averaged +0.0% with a 70% win rate. Neither comes near the top. December in the NAS100 was -0.2%.
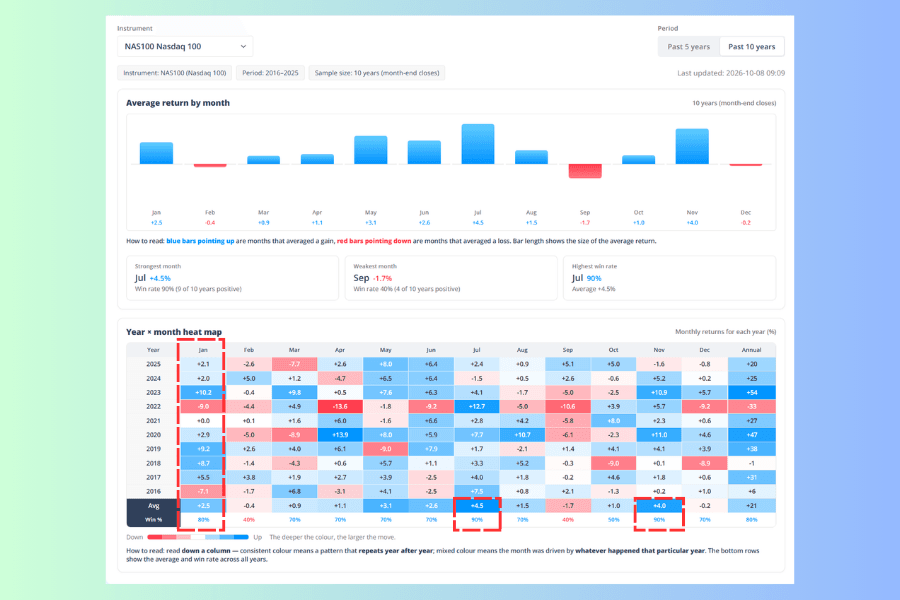
January in the NAS100 looks better at +2.5% with an 80% win rate. Those ten Januaries ran from -9.0% to +10.2%, though, the widest spread of any month in its year. An average over a distribution that loose does not tell you much.
The month that really is strong is November. The US500 averaged +4.2% with a 90% win rate, both the highest of its year. The NAS100 averaged +4.0% with a 90% win rate, tying July for the best win rate and sitting just behind July's +4.5% on average. There is a strong stretch at the end of the year, and it falls a month earlier than the saying suggests.
4. Two claims outside equities: gold in January, the yen in March
Gold's early-year strength: the best supported of the five
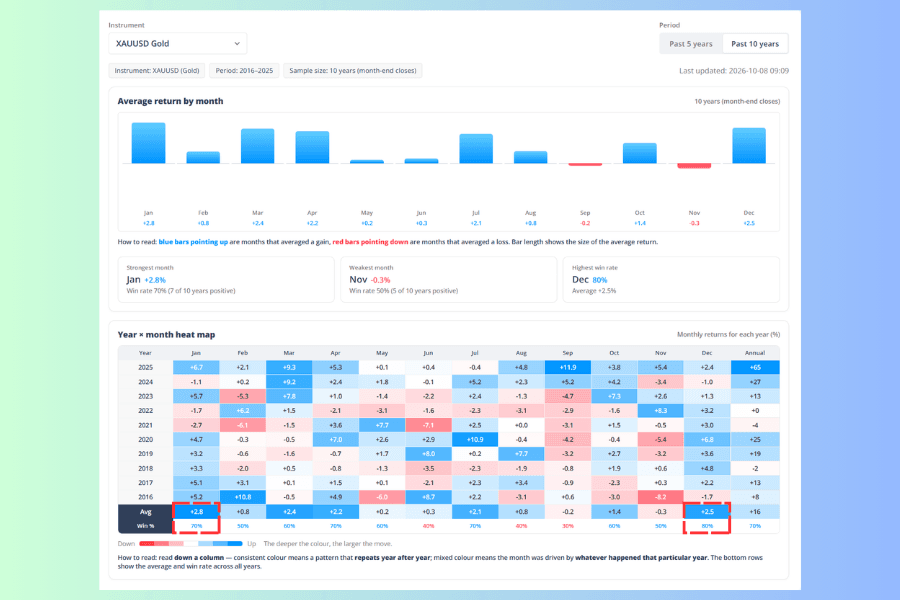
January in gold (XAUUSD) averaged +2.8%, the highest of its twelve months, with a 70% win rate. March (+2.4%) and April (+2.2%) were positive too, so the idea that gold runs strong early in the year holds up in the monthly data of the past decade.
The claim is stated in months and the tool reports in months, so the data answers the question as asked. Gold is the only one of the five where the two line up.
December is better still: an average of +2.5% and a win rate of 80%, the highest of the year. Gold's strong stretch runs across the turn of the year rather than sitting at the start of it. For what actually drives the gold price, see Eight Key Factors Influencing Gold Prices.
The yen in March: the direction fits, late March cannot be tested
The reasoning here is that Japan's fiscal year ends in late March, and companies repatriating overseas earnings create demand for yen.
Repatriation clusters into the last few trading days of the month, and the tool reports whole-month moves, so all you can check is March as a whole.
The direction fits; the size does not back it up. USD/JPY fell in seven of the past ten Marches, which is yen strength, exactly as the claim says. The average is still +0.5%, because March 2021 and March 2022 rose 3.9% and 5.8% — enough between them to outweigh seven declines.
So the monthly data supports the idea that more Marches than not have leaned toward a stronger yen. It does not support the idea that the yen gains across the whole month, and it cannot tell you whether late-month repatriation is the reason.
For what it is worth, the strongest month in USD/JPY over ten years is October, at +2.0% with a 70% win rate, which rarely gets a mention.
5. Why no single month works as an entry signal
November in the US500 averaged +4.2% with a 90% win rate — about as strong as seasonality gets anywhere in this data.
As a number it is convincing. Lay those ten Novembers out one year at a time, though, and the weakest came in at -0.5% while the strongest reached +10.6%, eleven percentage points apart. The +4.2% is just the midpoint of those ten figures, and any given year can land a long way from it.
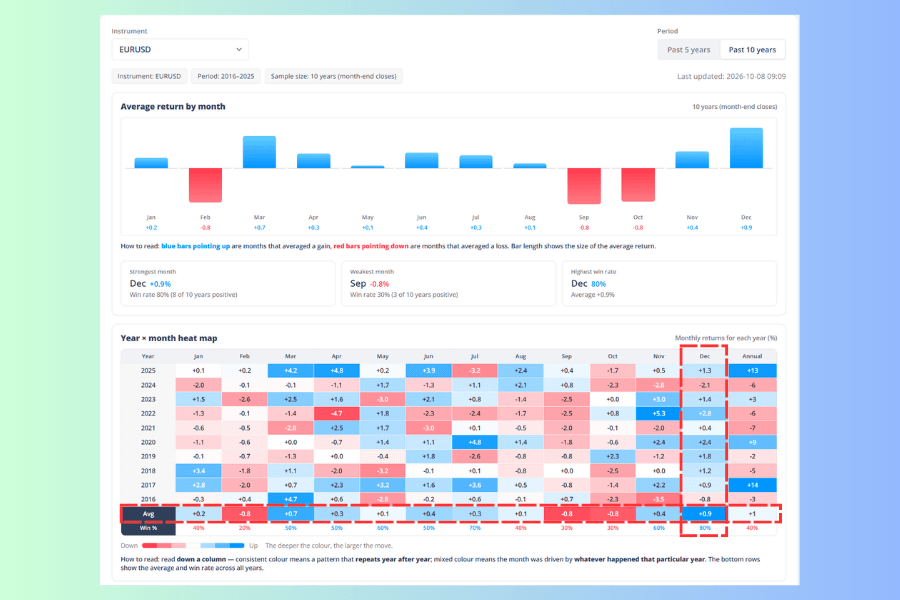
In currencies the size shrinks further. The strongest month in EUR/USD is December at +0.9%, and across those ten years December ran from -2.1% to +2.8%. Whatever edge seasonality is offering comes to less than a percentage point, which almost anything that happens that month will swallow.
All five instruments have the same shape. The average of the strongest month is smaller than the range that same month covered over ten years.
| Instrument | Month with the highest average | That month's ten-year range |
|---|---|---|
| NAS100 | July +4.5% | -1.5% to +12.7% |
| US500 | November +4.2% | -0.5% to +10.6% |
| XAUUSD Gold | January +2.8% | -2.7% to +6.7% |
| USD/JPY | October +2.0% | -0.8% to +5.8% |
| EUR/USD | December +0.9% | -2.1% to +2.8% |
Seasonality is a lean and nothing more. One month on its own will not carry the direction or the size of a position.
6. What the numbers are good for
Ten years gives you ten observations per month. A 70% win rate means seven of ten years rose, and if two of those seven had gone the other way you would be looking at 50%.
Three uses hold up in practice.
-
Treat it as background, not as a reason to enter. The reason comes first, whether that is a trend, a price level, an event or another signal. Seasonality then tells you whether the month has been a tailwind or a headwind. When the two disagree, take that as a reason for more caution. Going to seasonality to find a direction puts the order backwards.
-
Compare Past 5 years with Past 10 years. This is what the period switch is for. If the same month points the same way in both, the recent figures are reasonably stable. If they diverge, or reverse outright, trust the tendency less.
-
Keep it separate from session analysis. Seasonality works in months; forex trading hours work in the active windows inside a single day. The two run on completely different scales.
The user guide below the tool sets out where these tendencies come from — earnings season, fiscal year-ends, energy demand, portfolio rebalancing. Worth adding is that those causes shift as well. The scale of fiscal-year repatriation changes as companies change their overseas footprint, and seasonal energy demand changes with the generation mix. A claim that held thirty years ago need not hold now, which is why this article only uses ten.
For how the January Effect, Sell in May and the rest sit within the wider family of market anomalies, and why they are thought to happen, Market Anomalies covers the theory. Agricultural markets make a useful contrast: monthly tendencies in financial assets come mostly from flows and institutional habit, while agriculture has planting, harvest and inventory cycles behind it, so the mechanism is a different thing entirely. Agricultural seasonality is worth reading alongside this one.
7. Frequently Asked Questions
Q1: Is ten years enough?
Not for settling whether a claim is true. Ten observations can neither prove that a monthly tendency exists over the long run nor overturn something that has been repeated for decades. What this data can answer is whether the claim has turned up again in the past ten years. If a classic effect is weak in a recent sample, that at least means the historical version cannot be carried straight into the present.
Q2: Why do the five-year and ten-year figures differ so much for the same month?
Because the sample is small. Five years gives five observations, and one extreme year rewrites the average. A large gap between the two periods is itself a sign that the tendency is unstable.
Q3: Is a high win rate enough to enter on?
No. A win rate says nothing about size and nothing about the drawdown along the way. March in USD/JPY is the counterexample: seven of ten years fell, giving a 30% win rate, and the average is still positive.
Q4: Are seasonality and market anomalies the same thing?
Seasonality is one category of anomaly, also known as a calendar effect. Anomalies also include event-driven and behavioral types that have nothing to do with the month.
Q5: Why are monthly tendencies harder to read in currencies?
A currency pair is a relative price, so rates, inflation and flows on both sides affect the direction, and seasonal factors can cancel each other out. On top of that the strongest month averages only one or two percent, which leaves the signal easy to bury.
Q6: How often do these numbers change?
Every year. The ten-year window drops a year and adds a year each time, and the win rate has a denominator of ten. Whenever you quote figures like these, say which period they come from.
8. Summary
The five claims split three ways. Gold's early-year strength holds up in full in the monthly data of the past decade. Sell in May can be tested and shows no edge. The January Effect, the Santa Claus Rally and the yen's late-March move were each defined on a scale that monthly data cannot reach — small caps in one case, a handful of trading days in the others.
The method is worth more than the conclusions. Read the average return and the win rate together. Go back to the ten cells in the column whenever they disagree. Compare the five-year view with the ten-year one. And in every instrument, the strongest month is smaller than the range that same month covered over ten years. Seasonality makes a reasonable background condition and a poor reason.
Further Reading
- What is Forex Fundamental Analysis?
- Business Cycle
- How to Choose a Currency Pair: A Five-Step Screen
- What Is the US Dollar Index? Weights, Drivers, Trading
The financial markets research team at Titan FX. We produce educational content for investors across a broad range of instruments, including foreign exchange, commodities such as crude oil, precious metals and agricultural products, equity indices, US stocks and digital assets.
Primary Sources (by category)
- Market data: Titan FX Research, Seasonality Analysis (past 10 years, monthly average returns and win rates for 2016 to 2025)
- Definitions: Stock Trader's Almanac (Yale Hirsch, who has recorded the seven-trading-day Santa Claus Rally window since 1972)
- Editorial calculations: half-year compounded returns and the high-low range of each month, computed from the monthly returns the tool provides