Geopolitical Risk
From the Crimea conflict to U.S.-China tech rivalry, from tanker standoffs in the Strait of Hormuz to the India-Pakistan border crisis, every escalation sends shockwaves through global markets.
Geopolitical risk is no longer just a headline. It is a real variable that investors face daily, influencing energy and food prices, exchange rates, bond markets, global capital flows, and even the trajectory of government policy and industrial development.
This article systematically explains the definition and classification of geopolitical risk, introduces quantitative tools such as the GPR Index, analyzes how different asset classes respond, and examines the latest real-world cases from 2025, including the Strait of Hormuz crisis and the U.S.-China tariff conflict.
- The definition of geopolitical risk and its two main categories: geographical and political
- How to read GPR, CINC, and MID, the leading quantification tools
- The transmission mechanism across gold, crude oil, currencies, equities, and bonds
- Classic case studies including Russia-Ukraine and COVID-19
- 2025 developments: Strait of Hormuz, India-Pakistan, and U.S.-China tariffs
Key Takeaways
- What geopolitical risk is and how it transmits to financial markets
- Quantitative tools: GPR Index, CINC Index, MID Database
- Specific impact patterns on oil prices, safe-haven assets, and equities
- Risk management lessons from historical geopolitical events
1. What Is Geopolitical Risk? Definition and Classification
Geopolitical risk refers to the uncertainty and potential disruption to the global economy and financial markets caused by international or regional political conflicts, military tensions, political instability, terrorism, or policy interventions.
These risks are typically difficult to predict and can rapidly affect equity markets, commodity prices, exchange rates, and investor sentiment. Common scenarios include the outbreak of war, energy supply disruptions, terrorist attacks, and escalating diplomatic confrontations.
For practical analysis, geopolitical risk can be divided into two broad categories.
Geographical Risk
Geographical factors can themselves become the root cause of tension.
- Border disputes and sovereignty conflicts: Examples include the China-India border standoff and territorial disputes in the South China Sea.
- Strategic chokepoint risks: If energy transit corridors like the Strait of Hormuz or the Strait of Malacca are blocked, global oil prices and supply chain stability are directly threatened.
- Natural disaster-prone regions: Earthquake zones or drought-affected areas can trigger food supply problems, indirectly fueling social instability.
Political Risk
Uncertainty in political structures and governance can also translate into significant market risk.
- Regime change and coups: A new government may reverse predecessor policies, prompting foreign capital withdrawal and declining investor confidence.
- Military conflicts and invasions: Russia's invasion of Ukraine immediately triggered surges in global energy and agricultural commodity prices.
- Terrorism and domestic unrest: Attacks and civil disorder affect tourism, finance, infrastructure, and consumer confidence.
- Trade and diplomatic sanctions: The U.S.-China tech rivalry and its impact on the semiconductor industry and supply chains is a prime example.
Geopolitical risk typically spills over across borders. Even when events originate outside major economies, they can trigger chain reactions across global markets.
2. Tools for Quantifying Geopolitical Risk
Geopolitical risk is inherently uncertain and subjective. Traditionally, assessments relied on news events and analyst judgment. In recent years, however, the financial and academic communities have developed quantifiable geopolitical indicators to improve tracking and risk management.
The three most widely used tools are:
- CINC | Composite Index of National Capability
- MID | Militarized Interstate Disputes
- GPR | Geopolitical Risk Index
CINC | Composite Index of National Capability
Proposed by American political scientist J. David Singer in 1963, the CINC index measures a nation's "hard power" using six components:
- Total population share
- Urban population share
- Iron and steel production share
- Energy consumption share
- Military expenditure share
- Active military personnel share
CINC is widely used to assess a country's potential military and geopolitical influence and is applied in war modeling, conflict forecasting, and international relations research.
MID | Militarized Interstate Disputes
MID is a database maintained by the Correlates of War (COW) project that records military confrontations short of full-scale war.
Event types include:
- Threat of force
- Display of force
- Use of force
- Skirmish
MID is a key data source for tracking escalation dynamics in geopolitical hotspots.
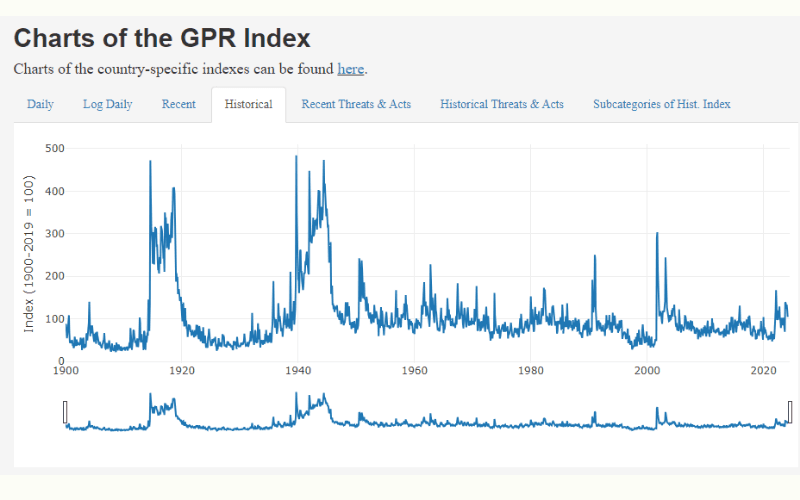
GPR | Geopolitical Risk Index
Developed by IMF economists Dario Caldara and Matteo Iacoviello in 2018, the GPR Index is currently the most widely cited quantitative tool for measuring geopolitical risk.
Key features:
-
It indexes the proportion of geopolitical-risk keywords appearing in 11 major U.S. newspapers.
-
The search scope covers eight core risk categories:
- War Threats
- Peace Threats
- Military Buildups
- Nuclear Threats
- Terror Threats
- Beginning of War
- Escalation of War
- Terror Acts
-
Data extends back to 1985 and is used to model the market behavior of safe-haven assets such as gold, the U.S. dollar, Treasury bonds, and equities.
When the GPR Index rises sharply, it typically reflects heightened risk aversion, with capital flowing into defensive assets like gold, the U.S. dollar, the Japanese yen, and the Swiss franc.
Research shows that the GPR Index is strongly positively correlated with the VIX (volatility index) and negatively correlated with gold prices and U.S. Treasury yields.
3. How Geopolitical Risk Affects Financial Markets
The impact of geopolitical risk on financial markets is far-reaching. It is not confined to a single asset class but permeates the entire market through capital flows, safe-haven demand, and sentiment transmission. Below is a breakdown by asset class.
Gold
Gold is widely regarded as the quintessential safe-haven asset. It carries no credit risk and pays no interest, making it a tangible store of value.
When geopolitical risks such as war or terrorism escalate, investors shift capital into gold for preservation, pushing prices higher. Gold also has inflation-hedging properties, attracting buyers when energy and food prices rise.
Crude Oil
Crude oil, the world's primary energy source, is highly sensitive to geopolitical events, especially when they involve oil-producing regions such as the Middle East or Russia.
When war or blockade threats affect supply, the market prices in reduced production capacity, causing oil prices to spike. These price movements can further accelerate inflation and disrupt monetary policy.
Bonds
When geopolitical risk concentrates in a specific country, its sovereign bonds are typically sold off, driving yields higher and reflecting increased credit risk.
Conversely, capital flows into safe-haven instruments such as U.S. Treasuries and Japanese government bonds, pushing prices up and yields down. This phenomenon is known as a "flight to quality."
Equities
Stock markets tend to react most dramatically and immediately to risk events, particularly in the short term.
When conflicts erupt, markets anticipate declining corporate earnings, regional supply chain disruptions, and international capital flight, causing equity markets in affected countries to drop. If the event has global implications, it can trigger cascading sell-offs.
Currencies
When risk escalates, safe-haven currencies such as the U.S. dollar, the Japanese yen, and the Swiss franc typically appreciate.
However, if the event directly targets the United States (for example, a terrorist attack on U.S. soil), the dollar may weaken as capital moves to other safe assets. Emerging market currencies are often sold off during these episodes, amplifying exchange rate volatility.
Note: In the early days of Russia's 2022 invasion of Ukraine, gold and crude oil surged, the ruble and euro depreciated sharply, and U.S. Treasuries and the dollar strengthened, providing a textbook example of cross-asset dynamics under geopolitical stress.
4. Classic and Recent Case Studies
To illustrate how geopolitical risk affects markets in practice, this section examines the most significant events in recent years, including wars, a pandemic, and the regional conflicts and strategic tensions that emerged in 2025.
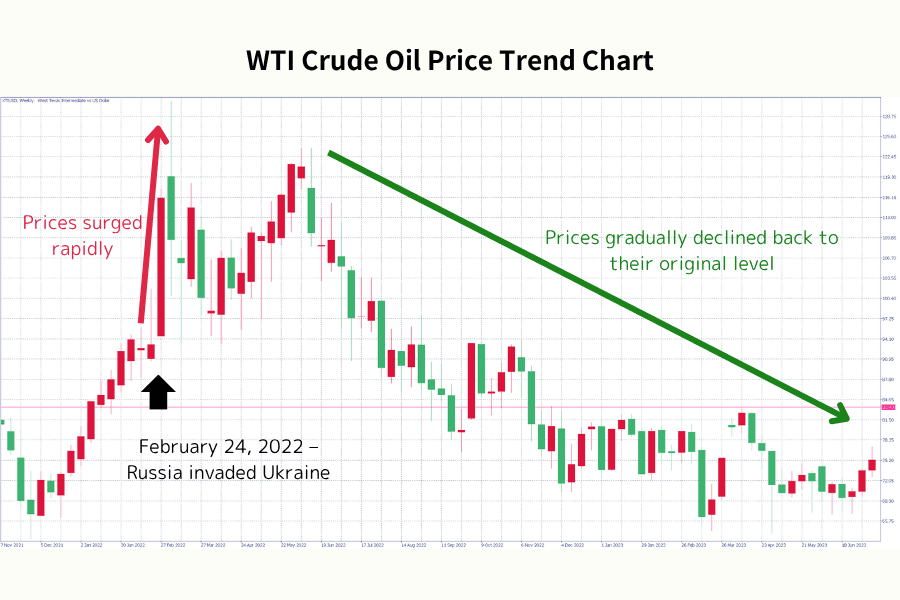
Case 1: Russia's Invasion of Ukraine (2022 onward)
Background
In February 2022, Russia launched a full-scale military invasion of Ukraine, causing a dramatic deterioration in European geopolitical conditions and becoming one of the most severe interstate conflicts of the 21st century.
Commodity Market Impact
WTI crude oil prices surged from around $90 per barrel to nearly $130 per barrel.
As a major global wheat exporter, Ukraine's disruption sent wheat prices soaring, intensifying food inflation pressure worldwide.
Other Market Reactions
European equities fell sharply in the short term, while safe-haven assets such as gold and U.S. Treasuries attracted capital inflows.
Natural gas prices surged, causing lasting repercussions for European energy security and policy.
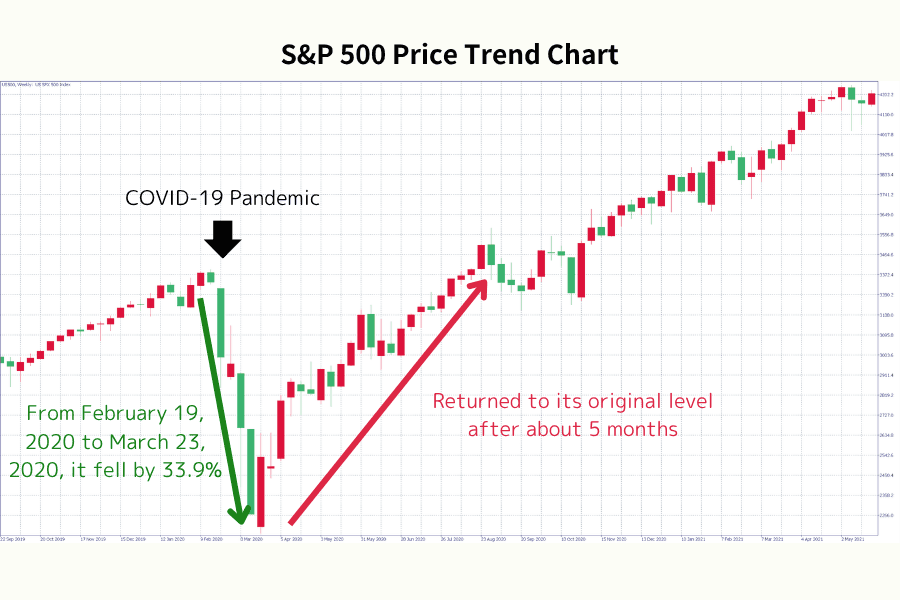
Case 2: COVID-19 Global Pandemic (2020)
Background
In early 2020, the novel coronavirus spread globally, prompting border closures, lockdowns, and stay-at-home orders that disrupted global supply chains.
Market Reaction
The S&P 500 fell more than 30% in the first quarter of 2020, and the VIX hit an all-time high.
Oil demand collapsed, and in April 2020, WTI crude oil futures briefly traded at negative $37, the first negative price in history.
Broader Impact
Central banks worldwide launched ultra-accommodative policies and large-scale quantitative easing (QE), triggering a historic asset price rebound.
Low interest rates and massive fiscal stimulus led to the emergence of asset bubbles and a new inflationary environment.
Case 3: Strait of Hormuz Tensions (May 2025)
Background
In May 2025, Iran threatened to block the Strait of Hormuz, a waterway that handles approximately 20% of global oil shipments, raising immediate energy security concerns.
Market Reaction
Crude oil prices surged, with Brent approaching $110 per barrel.
Capital flowed rapidly into energy stocks and crude oil ETFs, with trading volumes spiking.
Other Effects
European and Asian equity markets experienced heightened volatility, emerging market currencies depreciated, and safe-haven currencies such as the U.S. dollar and Swiss franc strengthened.
Case 4: India-Pakistan Border Conflict (March 2025)
Background
A large-scale border clash erupted in Kashmir, with both sides deploying fighter jets and heavy weaponry, and military tensions escalated rapidly.
Market Reaction
The Indian rupee depreciated sharply in the short term, and foreign capital accelerated its withdrawal from equity and bond markets.
South Asian bond spreads widened, and emerging market assets came under broad selling pressure.
Risk-Aversion Trend
Gold prices rose more than 5% in a single week.
Short-term risk aversion remained elevated as markets continued to monitor the India-Pakistan situation.
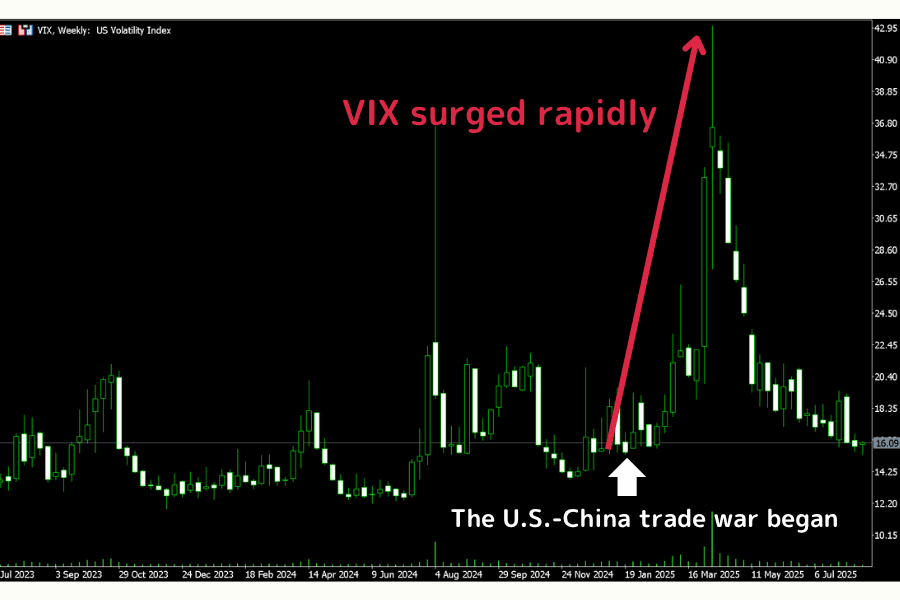
Case 5: U.S.-China Tariff Conflict, New Round (February 2025)
Background
On February 1, 2025, U.S. President Trump signed an executive order imposing an additional 10% tariff on all imports from China, citing the fight against synthetic opioid supply chains, and declared a "trade and national security emergency."
China retaliated by raising tariffs on U.S. goods to 125%, covering agricultural products, semiconductors, and energy commodities, sending shockwaves through global markets.
Market Reactions
Equities:
- The S&P 500 fell more than 2.3% on the announcement day, with tech stocks such as Apple and NVIDIA leading losses due to supply chain risks.
- China's Shanghai Composite dropped more than 4%, with net foreign capital outflows hitting a 12-month daily record.
- Equity markets in countries with high supply chain dependence on Asia (such as South Korea and Taiwan) also fell.
Foreign Exchange:
- The Chinese yuan breached 7.4 to hit a multi-year low, and the U.S. Dollar Index rose in the short term.
- As risk aversion intensified, the Japanese yen and Swiss franc appreciated, while U.S. Treasury yields declined.
Commodities:
- Soybean, wheat, and corn futures fluctuated in the short term, with U.S. agriculture pressured by expectations of export restrictions.
- Copper, rare earth elements, and lithium -- key materials in the U.S.-China tech rivalry -- rose in the short term as supply chain bottleneck concerns deepened.
Capital Flows:
- In the ETF market, capital rapidly shifted into defensive instruments such as gold ETFs (GLD) and VIX-linked products.
- The MSCI Emerging Markets Index fell more than 6% from February to March, reflecting a decline in investor risk appetite.
De-escalation and Subsequent Developments
In May 2025, the two sides reached a preliminary agreement. The U.S. reduced some tariffs to 60%, and China agreed to remove certain restrictions. Markets rebounded promptly:
- The S&P 500 recovered to near all-time highs, the yuan strengthened back within 7.2, and the dollar retreated.
- New negotiations began on lithium battery supply and semiconductor facilities, restoring expectations for longer-term stability.
Summary of Case Studies
These cases demonstrate that once geopolitical risk materializes -- whether through war, a pandemic, or regional conflict -- it is immediately reflected in financial markets.
Gold and crude oil exhibit the most pronounced price movements. Currency markets see capital flowing back into safe-haven currencies, while equity and bond markets are significantly affected by shifts in sentiment and liquidity.
Investors should closely monitor geopolitical hotspots and proactively structure appropriate hedging strategies.
5. Conclusion: Seizing Opportunity Amid Volatility
The unpredictability of geopolitical risk makes it one of the most threatening -- yet also potentially most rewarding -- risk categories in global markets.
From the Russia-Ukraine war to the U.S.-China tariff conflict, market reactions vary, but the underlying logic is consistent: geopolitical events alter supply-demand expectations, disrupt capital allocation and policy direction, and ultimately drive sharp asset price movements.
Investors can strengthen risk management and asset allocation along four dimensions:
- Build an early-warning framework: Regularly monitor the GPR Index, CINC, MID, and geopolitical news.
- Adjust portfolio structure: Include defensive positions such as gold, Treasury bonds, and low-volatility equities.
- Watch regional hotspots and supply chain vulnerabilities: Focus on energy transit routes, food-exporting nations, and technology supply chains.
- Maintain psychological preparedness and trading discipline: Set stop-losses and leverage limits, and avoid emotional decision-making.
Geopolitical risk cannot be eliminated, but preparation and awareness can transform it into a source of opportunity. Continuous analysis of the global landscape is the key to standing firm amid volatility and capturing the capital opportunities created by turning points in our time.
Further Reading
- FX Trading Basics
- What Is FOMC?
- Gold CFD Trading Guide
- Safe-Haven Currencies
- Crude Oil CFD Trading
- Understanding the VIX
Titan FX's financial market research and analysis team produces investor education content across a wide range of financial instruments, including foreign exchange (FX), commodities (crude oil, precious metals, and agricultural products), stock indices, U.S. equities, and crypto assets.
Primary Sources by Category
- Geopolitical risk indices and academic research: Caldara, D. & Iacoviello, M. (2022) "Measuring Geopolitical Risk" American Economic Review; GPR Index Official Site (matteoiacoviello.com/gpr.htm); Correlates of War Project (correlatesofwar.org)
- Energy and commodity market data: U.S. Energy Information Administration (eia.gov); ICE Brent Crude Oil Futures; CME Group WTI Crude Oil Futures
- Financial market and macroeconomic data: CBOE VIX Index; MSCI Emerging Markets Index; Federal Reserve Economic Data (FRED)
Related Articles
Titan FX Research. We produce educational content for investors, covering a wide range of financial instruments including forex, commodities (crude oil, precious metals, agricultural products), stock indices, U.S. equities, and digital assets.
Primary Sources (by category)
- Analysis: Council on Foreign Relations — Geopolitical Risk; IMF — WEO
- Markets: BIS — Geopolitical risk and financial markets