

What Are EIA Crude Oil Inventories? Release Time, Six Key Numbers, and the Price Reaction

It is one of the most reliable scheduled events in the energy market. Same time, same set of numbers, every week — and oil often posts its widest move of the day in the minutes after the release.
That is also where the number gets misread most often. A build does not automatically mean lower prices. The same "crude stocks up three million barrels" can mean refineries are in maintenance, it can mean import cargoes arrived in a cluster, or it can mean demand is genuinely weakening — and those three point in different directions. This guide covers the release schedule, which numbers to read, and how to tell the three apart.
- EIA crude oil inventories are published Wednesday at 10:30 a.m. ET, covering the week through the previous Friday; when Monday is a federal holiday the release usually slips to Thursday
- The American Petroleum Institute (API) publishes its own private version the previous afternoon at 4:30 p.m. ET; the two are sampled differently and frequently disagree
- What moves oil is the gap between the reading and the consensus, not the absolute level of inventories
- When crude builds, read refinery utilization and product inventories alongside it to tell maintenance season from import timing from genuine demand weakness
- Cushing stocks matter specifically for WTI, because Cushing is the physical delivery point for the futures contract
- Releases from and refills of the Strategic Petroleum Reserve distort the commercial inventory reading, so keep the two separate
- 1. What are EIA crude oil inventories?
- 2. Release schedule: the EIA and API numbers
- 3. Crude alone is not enough: six numbers to read together
- 4. Why a build does not always mean lower prices
- 5. Cushing and seasonality: two details that get missed
- 6. How do you read the EIA data? Before, during, and after
- 7. FAQ: Common questions about EIA crude oil inventories
- 8. Conclusion: Find the cause before you read the number
1. What are EIA crude oil inventories?
EIA crude oil inventories refer to the level of US commercial crude oil stocks, compiled and published weekly by the US Energy Information Administration, part of the Department of Energy. It is the single most quoted supply-and-demand indicator in the oil market.
The number comes from a publication called the Weekly Petroleum Status Report. Alongside crude stocks, that report carries product inventories, refinery utilization, production and trade flows — fields that turn out to be necessary for reading the crude number correctly.
Two things make it matter.
The first is the weight of the US. The United States is the world's largest consumer of petroleum and one of its major crude producers, so changes in its inventories reflect a key slice of global supply and demand.
The second is mandatory reporting. Refiners, pipeline operators and terminal owners are required by law to file data with the EIA, which gives the series unusually high coverage — the main thing separating it from private surveys.
For traders there is a practical benefit on top: the timing is fixed. For WTI crude and Brent crude, this is the most predictable volatility window of the week.
2. Release schedule: the EIA and API numbers
The market actually receives two sets of inventory data, a day apart.
| Report | Publisher | Time (ET) | Type |
|---|---|---|---|
| API weekly | American Petroleum Institute | Tuesday 4:30 p.m. | Private survey, voluntary member submissions |
| EIA weekly | US Energy Information Administration | Wednesday 10:30 a.m. | Official statistics, mandatory filing |
Both cover the week through the previous Friday.
US federal holidays push the schedule back. When the Monday of that week is a holiday, the EIA release usually moves to Thursday at the same hour, and the API shifts a day as well. The exact date is whatever the EIA's own release schedule says.
Why the two numbers so often disagree
The API runs a private survey filled in voluntarily by member companies; the EIA collects mandatory filings. The sample coverage and the definitions both differ, so it is not unusual for the two to point opposite ways — API showing a draw, the EIA showing a build the next morning.
In practice, treat the API as a look a day early. The market does react to it on Tuesday evening, but the benchmark everyone works from is Wednesday's EIA print. When the two disagree, Wednesday's move tends to be larger, because the previous day's positioning has to be unwound.
3. Crude alone is not enough: six numbers to read together
Crude stocks are the headline, but on their own they explain very little. Six items in the same report get read together every week, and dropping any of them invites a misreading.
| Group | Number | What it tells you |
|---|---|---|
| Crude | Commercial crude stocks | The headline figure, excluding the Strategic Petroleum Reserve |
| Crude | Cushing stocks | The physical delivery point for WTI futures — see the next section |
| Refining | Refinery utilization | The share of capacity actually running crude; falls sharply during maintenance |
| Demand | Gasoline stocks | The consumer end, and the number that matters most during summer driving season |
| Demand | Distillate stocks | Diesel and heating oil, tied to freight and winter demand |
| Demand | Product supplied | The EIA's proxy for demand, measuring volumes leaving primary storage rather than final consumption |
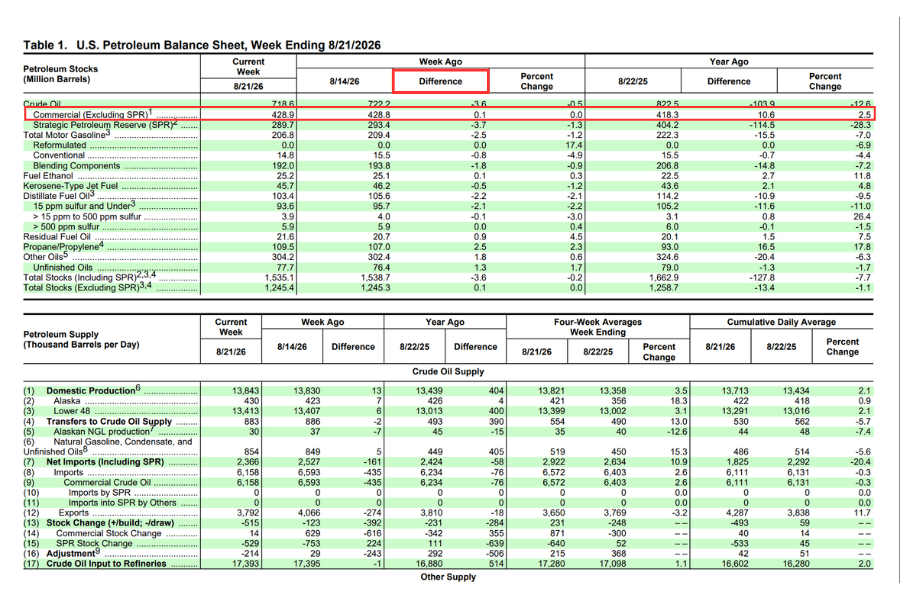
The three groups have to be read together. When refinery utilization falls, crude piles up while products get drawn down, so crude stocks rise and product stocks fall. That combination is a change on the refining side, not weaker consumption.
The reverse pattern — crude and product stocks rising together while product supplied falls — is closer to genuine demand weakness.
The spread between crude and product prices also drives how hard refiners want to run, which is covered in the note on crack spreads; RBOB gasoline has the full background on the product market.
4. Why a build does not always mean lower prices
This is where the report gets misread most often, and getting it right is what makes the data useful.
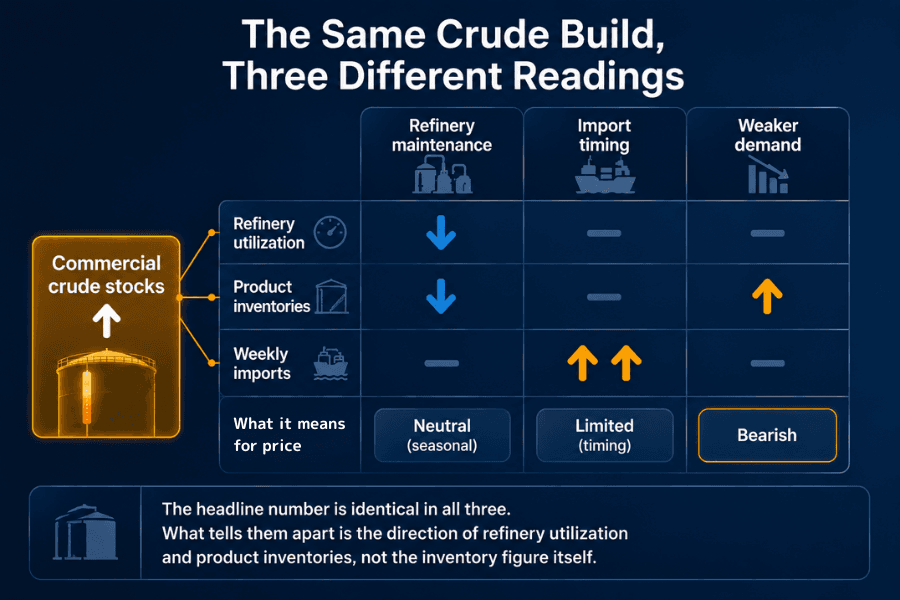
One headline of "commercial crude stocks up three million barrels" has at least three quite different causes behind it.
Cause one: refineries are in maintenance
Refiners schedule turnarounds twice a year, in spring and autumn. Crude runs fall during those windows, so barrels bought earlier sit in tanks instead of being processed, and stocks rise.
You identify it through utilization: if the utilization rate is falling at the same time and gasoline and distillate stocks are drawing down, this is seasonal behavior on the refining side with nothing to do with demand. The price pressure is limited, and the market has usually anticipated it.
Cause two: import cargoes arrived together
Tankers do not arrive on an even schedule. A few cargoes landing early or late shifts barrels between weeks, lifting stocks one week and giving them back the next.
You identify it by checking whether the week's import figure sits well away from its recent range. If it does, the build is a timing artifact that tends to reverse the following week, and it is not a trend signal.
Cause three: demand really is weakening
This is the case worth taking seriously. It shows up as crude and product stocks rising together, product supplied falling, and the same direction repeating over several weeks.
A single week almost never separates the first two cases from the third, which is why more experienced traders read inventories on a four-week moving average; week-by-week readings get pushed around by noise too easily.
One more thing worth remembering: the consensus is already in the price before the release. What gets traded in that moment is the gap between the print and the expectation — the absolute level of inventories stopped being new information long before.
5. Cushing and seasonality: two details that get missed
Why Cushing matters specifically for WTI
Cushing is a small town in Oklahoma, and it is the physical delivery point for NYMEX WTI crude futures. Every WTI contract that goes to physical delivery settles there.
That status gives Cushing stocks a particular meaning. When the tanks there approach full, delivery pressure builds on the sell side; when stocks fall toward operational minimums, deliverable barrels get scarce and the front month can be bid up.
So national crude stocks and Cushing stocks should be read separately. National stocks reflect overall supply and demand; Cushing reflects the delivery situation for this one contract, which can be tracked against price on the live WTI quotes page. It is also why the same report sometimes moves the WTI-Brent spread noticeably.
The rhythm through the year
Inventories follow a reasonably fixed seasonal pattern, and knowing which phase you are in makes the reading far more accurate.
-
Spring (roughly February to April): spring turnarounds, utilization falls, crude stocks tend to build.
-
Summer (roughly late May to early September): US driving season, gasoline demand rises, utilization runs at its annual peak and crude stocks tend to draw.
-
Autumn (roughly September to October): the second round of turnarounds, utilization drops again.
-
Winter: heating demand pulls distillate down, and a cold snap can drain diesel and heating oil stocks quickly.
These are tendencies rather than rules. During hurricane season, roughly June to November, a storm tracking toward the Gulf Coast can shut refineries and offshore platforms at the same time, and inventories swing violently against the seasonal pattern for a few weeks.
6. How do you read the EIA data? Before, during, and after
Before: confirm the timing and the consensusStart with this week's release time, particularly during holiday weeks; the EIA posts its own release schedule in advance. Note the consensus figure at the same time — without an expectation as a baseline, the print that arrives cannot be judged bullish or bearish at all.
It is also worth checking what else lands on the same day. When an FOMC decision or a CPI print falls on the same Wednesday, crude follows the macro event and the inventory numbers count for less. The schedule for those releases is on the economic calendar.
During: do not trade the headline figureIn the first minutes after the release, volatility expands sharply and spreads can widen with it. The most common pattern is a run in one direction followed by a reversal a few minutes later, because the market needs time to read all six numbers.
The steadier approach is to wait for the volatility to settle before taking a view. Chasing price the instant the figure prints usually means trading noise.
After: put the number in contextA single week carries a lot of noise. Set it against the previous weeks as a four-week moving average, check which seasonal phase you are in, and confirm whether utilization and product stocks point the same way. Only after those three steps do you know what this week's figure actually said.
Inventories are also just one variable in the oil price. OPEC and OPEC+ production decisions, geopolitics and the direction of the US Dollar Index can all outweigh inventories in the same week. Natural gas has its own separate weekly storage report, and the two should not be mixed up.
Last comes position sizing. The volatility expansion on release day is predictable, so leverage and stop distance should be set on that assumption before you enter.
Trade Crude Oil CFDs with Titan FX
Titan FX offers WTI (XTI/USD) and Brent (XBR/USD) crude oil CFDs with up to 100:1 leverage, tight spreads, and the flexibility to go long or short without holding the physical commodity.
7. FAQ: Common questions about EIA crude oil inventories
Q1: When are EIA crude oil inventories released?
Wednesday at 10:30 a.m. ET, covering the week through the previous Friday. When the Monday of that week is a US federal holiday, the release usually moves to Thursday at the same hour; the exact date is whatever the EIA announces.
Q2: Does a build always send prices lower?
No. A build has at least three causes: refinery maintenance cutting crude runs, import cargoes arriving together in one week, and genuine demand weakness. The first two carry limited price pressure; only the third is a real bearish signal. You separate them by reading refinery utilization and product inventories alongside the crude number.
Q3: Why do the API and EIA figures often differ?
They are sampled differently. The API runs a private survey filled in voluntarily by member companies, while the EIA collects mandatory filings with much broader coverage. Given the differences in sample and definitions, the two pointing opposite ways is not unusual. The market works from the EIA figure and treats the API as a look a day early.
Q4: Why should Cushing stocks be read separately?
Cushing is the physical delivery point for NYMEX WTI crude futures. When the tanks there approach full, delivery pressure builds on the sell side; when stocks fall toward operational minimums, deliverable barrels get scarce and the front month can be bid up. National stocks reflect overall supply and demand, while Cushing reflects the delivery situation for this one contract.
Q5: Does the Strategic Petroleum Reserve affect this data?
Yes, and it needs to be kept separate. The commercial crude stocks the market quotes exclude the Strategic Petroleum Reserve (SPR), but SPR releases and refills feed through market supply and change commercial inventories indirectly. The SPR appears as its own line in the report, and separating the two avoids reading a policy action as a shift in supply and demand.
Q6: Can a beginner trade the release?
Yes, provided you understand what those few minutes look like first. Volatility and spreads expand together at the print, and a run in one direction followed by a reversal is common. The steadier approach is to wait for volatility to settle before taking a view, and to cut position size and widen stops. Scalping the release is high risk for anyone still building experience.
Q7: Is this the same report as the natural gas storage data?
No. Natural gas has its own weekly storage report, published by the EIA on Thursdays, covering underground gas in storage rather than crude oil. The release times, the subject matter and the instruments affected are all different, and the two should not be mixed up.
8. Conclusion: Find the cause before you read the number
The value of EIA crude oil inventories is that they deliver a consistently defined, broadly covered set of US supply-and-demand data at a fixed time every week. For traders, that is the most predictable volatility window of the week.
It is also the report that gets simplified most easily. Reading "stocks up" straight through to "prices down", while ignoring refinery utilization, product inventories and import timing, means acting on one of the six numbers and none of the rest.
The working sequence is: confirm the release time and the consensus first, resist trading the headline figure at the print, then place the number back into its four-week average and its seasonal phase, and finally check whether utilization and product stocks support each other. Do those four things and the report turns from an event that generates volatility into a tool for reading supply and demand.
To start from the trading instrument itself, see the introduction to crude oil CFDs.
Further Reading
- Global Crude Oil Types: WTI, Brent, and Dubai Key Comparisons
- Dubai Crude Oil: A Benchmark Shaping Asia's Energy Market
- What Is a Barrel of Oil? Definition, Conversions, and Pricing
- CFD (Contract for Difference)
- Live Brent crude quotes
The Titan FX financial market research team. Covering FX, commodities (oil, precious metals, agricultural products), stock indices, US equities, and crypto assets, the team produces educational content for investors across a wide range of financial instruments.
Primary Sources (by Category)
- Official statistics: The US Energy Information Administration's Weekly Petroleum Status Report, including its release schedule, reported series and definitions
- Private survey: General descriptions of the American Petroleum Institute's weekly petroleum statistics, its schedule and its sampling method
- Exchange rules: NYMEX WTI crude futures contract specifications covering Cushing as the physical delivery point
- Investor education: Regulator materials on commodity CFD leverage, volatility around data releases and risk management