Bar Chart
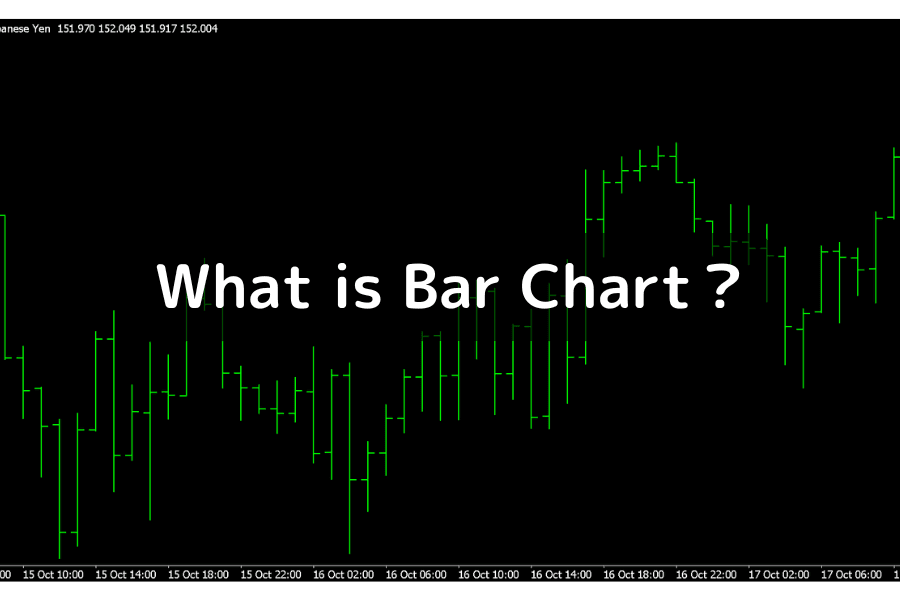
The same price action can tell traders very different stories depending on the chart you use. Even in an age dominated by candlesticks, the clean, structural bar chart remains a powerful tool for reading price.
This article covers how a bar chart is built, how it differs from other chart types, how to use it in real trading, and how to set it up in MT4/MT5.
- Definition: Bar Chart (OHLC) = vertical line + two horizontal ticks displaying open / high / low / close in a single time period
- vs Candlestick: No body / wick distinction. Same information, simpler visual structure
- vs Line Chart: Full OHLC vs close-only. Suited for short-to-medium-term trading
- 4 Strategies: Trend identification / Support-resistance / Breakout signals / Combining with indicators (MA / MACD / RSI)
- MT4/MT5 setup: Press
Alt + 1to switch to bar chart instantly
1. What is a Bar Chart?
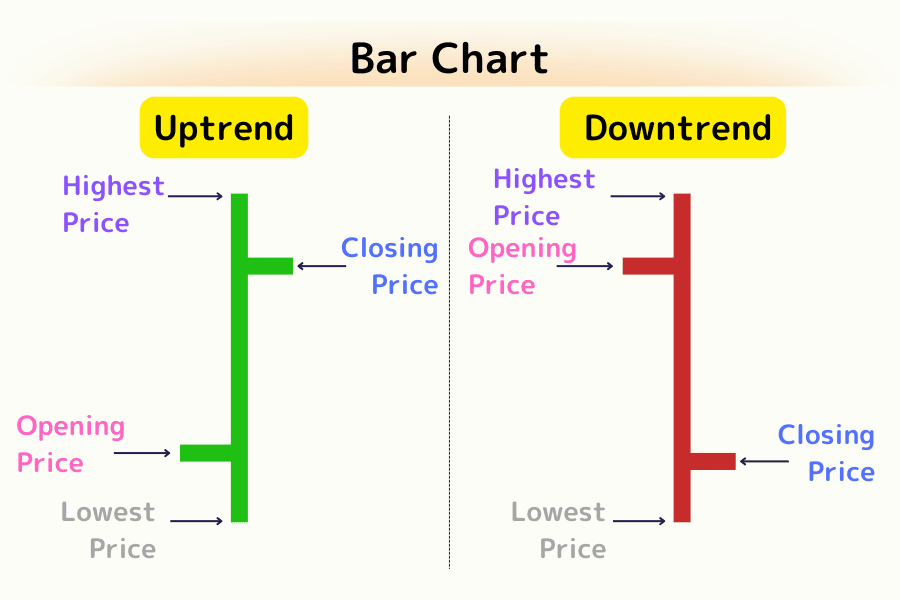
A bar chart consists of a vertical line and two horizontal lines. The observation method is as follows (with rising and falling bars differentiated by color):
Reading a Bar Chart
| Item | Position |
|---|---|
| Opening Price | Left horizontal line |
| Closing Price | Right horizontal line |
| Highest Price | Top of the vertical line |
| Lowest Price | Bottom of the vertical line |
In a single-color bar chart, the market trend is determined based on the position of the opening price (left) and closing price (right). If the closing price is higher than the opening price, it indicates an uptrend; otherwise, a downtrend.
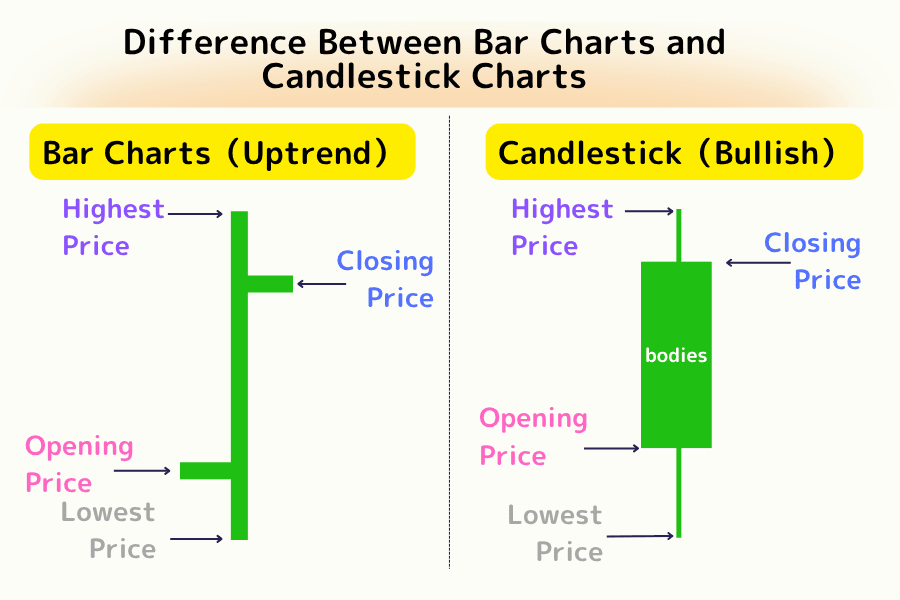
Difference Between Bar Charts and Candlestick Charts
Compared to candlestick charts, bar charts do not show "bodies" (the rectangular area between opening and closing prices). They offer a simpler visual representation focused on price range fluctuations.
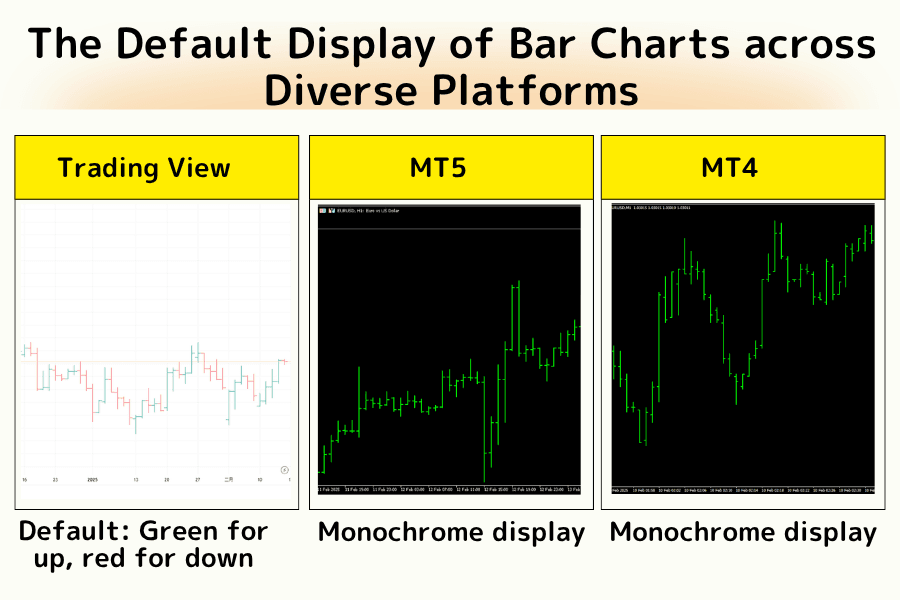
In some trading platforms, bar charts use different colors to indicate price movement: green for upward movements and red for downward, while platforms like MT4 and MT5 use a single color.
2. How to Use Bar Charts in Trading
Bar charts are commonly used in technical analysis to observe market price fluctuations and trend changes. While bar charts themselves don't directly provide trade signals, they help traders identify market trends, key price zones, and potential reversal points.
1. Trend Identification
Uptrend: When most bars show the closing price higher than the opening price (bullish), and the bar length gradually increases, it indicates an uptrend. Traders may consider buying on dips or holding long positions.
Downtrend: If most bars show the closing price lower than the opening price (bearish), and the bar length gradually increases, it suggests a downtrend. Traders may consider selling on rallies or holding short positions.
Range-bound Market: If the range of fluctuations in the bars shrinks, with no clear uptrend or downtrend, the market might be in a consolidation phase. Traders should wait for a breakout before acting.
2. Support and Resistance
Bar charts help identify support and resistance levels. A support level is a price zone where the price may rebound when falling, while a resistance level is where the price may pull back when rising.
When the price repeatedly touches and reverses at a certain level, it can be considered an important support or resistance level. Traders might buy near support or sell near resistance, with stop-loss placed just outside the level.
3. Reversal / Breakout Signals
When the market price breaks above the highest price or below the lowest price of the previous bar, it may signal a potential reversal:
Breakout to the Upside: If the price breaks above the highest point of the previous bar and is accompanied by increased volume, it may signal the continuation or reversal into an uptrend.
Breakout to the Downside: If the price falls below the lowest point of the previous bar and is accompanied by increased volume, it may signal the continuation or reversal into a downtrend.
4. Combining with Other Technical Tools
Bar charts are often combined with other technical analysis tools to improve the accuracy of trade decisions:
- Moving Average (MA): Track medium-to-long-term trends
- MACD: Observe momentum shifts and divergences
- RSI: Identify overbought / oversold conditions
3. How to Set Up Bar Charts on MT4 / MT5
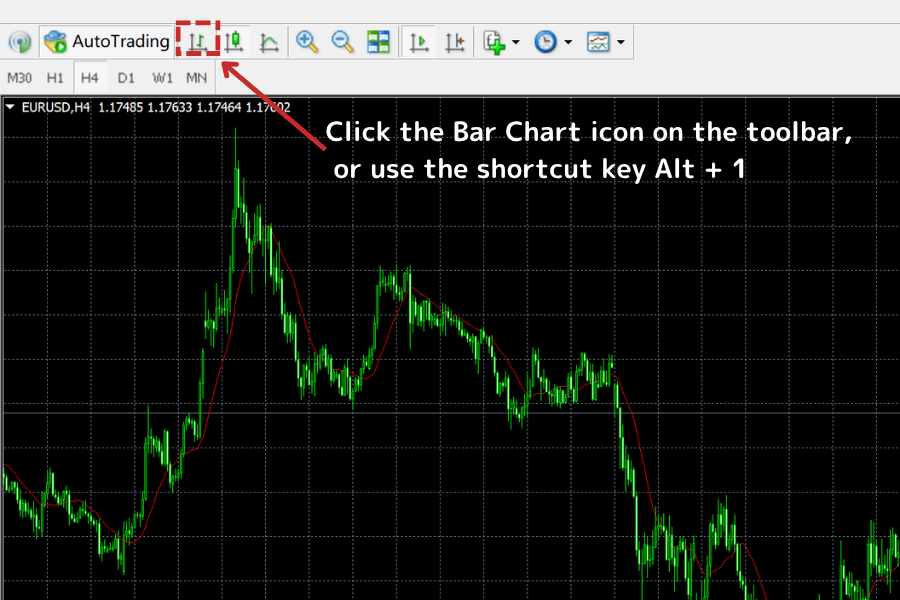
Setting Up a Bar Chart in MT4 (MetaTrader 4)
- Click on the bar chart icon in the toolbar.
- In the menu bar, select "Chart," then choose "Bar Chart."
- Alternatively, select the chart and use the shortcut Alt + 1 to quickly switch to the bar chart.
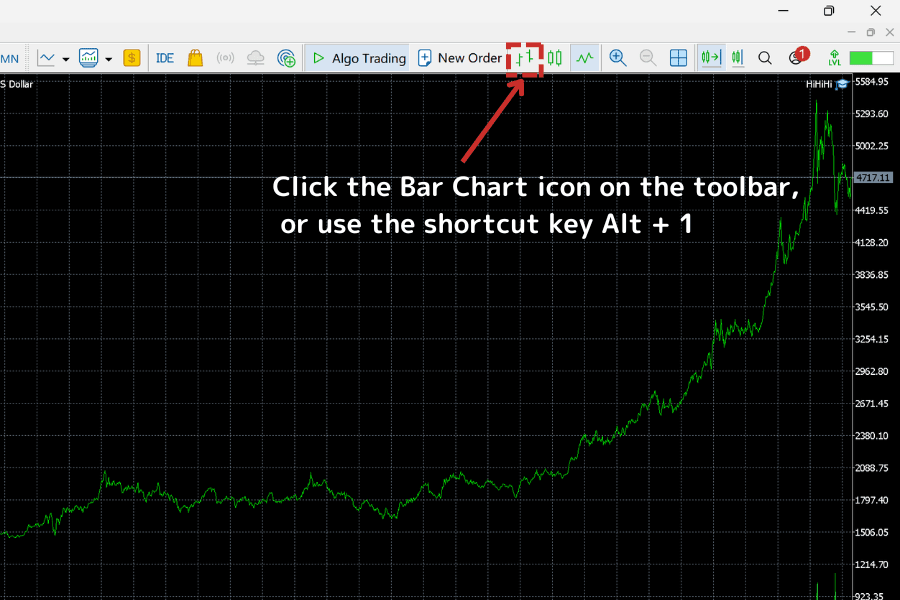
Setting Up a Bar Chart in MT5 (MetaTrader 5)
- Click on the bar chart icon in the toolbar.
- In the menu bar, select "Chart," then choose "Bar Chart."
- Alternatively, select the chart and use the shortcut Alt + 1 to quickly switch to the bar chart.
4. Other Types of Charts
Candlestick Chart
Candlestick charts provide a more intuitive representation by showing the "body" between the opening and closing prices, and the wicks represent the highest and lowest prices. Candlestick charts clearly indicate price trends and reversal signals.
Line Chart
Line charts connect the closing prices of each period to form a continuous line. They are mainly used to show price trends but do not display the specific price changes within each period. Line charts are simpler and better suited for observing long-term trends.
5. FAQ
Q1: Which financial markets is the bar chart suited for?
Bar charts are widely used in forex, indices, futures, and commodity markets — particularly suited to tracking price ranges and capturing short-term trends. Useful across day trading, swing trading, and longer-term analysis.
Q2: What blind spots should I watch for when using bar charts?
Bar charts clearly show the price range but lack the visual "body" of candlesticks, making it harder for beginners to quickly judge trend strength. Combine with volume, technical indicators, or support/resistance lines to reduce misjudgment.
Q3: How should I integrate bar charts with technical indicators?
Use bar charts first to identify price structure and trend phase, then add indicators as needed: RSI for overbought/oversold, moving averages for trend direction, MACD for momentum shifts. Keep logic consistent and avoid over-parameterization.
Q4: Are bar charts beginner-friendly?
Less visually striking than candlesticks, so beginners need some time to adapt. Once you master the reading logic, bar charts effectively highlight key price levels and rhythm of price action.
Q5: Are there advanced techniques to improve bar-chart reading?
Yes — multi-timeframe analysis (MTA): observe how the bar structure evolves across timeframes (e.g., daily for long-term trend, 1-hour for entry timing). Combine with price patterns (double tops, head-and-shoulders) for higher-confidence setups.
6. Conclusion
Bar charts are a concise and effective chart type that helps traders quickly understand market price range and movement direction. While they don't visually separate by colors like candlestick charts, observing the bar lengths and opening/closing positions allows traders to make informed judgments about the market trend.
Whether in daily trading or strategy development, bar charts provide clear visual information and are a fundamental tool that all traders should master. Combine bar-chart reading with disciplined risk management — set stop-loss, follow the 2% risk rule, and the bar chart becomes a reliable foundation for your trading system.
Further Reading
- What is a Candlestick Chart?
- What is Moving Average (MA)?
- What is MACD?
- What is RSI?
- Forex Trading Basics
- What is Stop Loss?
Titan FX Trading Strategy Lab. We produce investor-education content covering forex, commodities (crude oil, precious metals, agricultural goods), stock indices, U.S. equities, and digital assets.
Primary Sources (by category)
- Historical context: Charles Henry Dow (1900) — early use of OHLC bars in Wall Street Journal market analysis
- Methodology: Murphy, J. J. (1999) Technical Analysis of the Financial Markets, NYIF — Bar Chart vs Candlestick structural comparison
- Indicator literature: J. Welles Wilder Jr. (1978) New Concepts in Technical Trading Systems — RSI / ATR built on OHLC bars
- Platform docs: MetaQuotes — MT4/MT5 chart-type documentation