BDI (Baltic Dry Index)
The Baltic Dry Index (BDI) is a daily shipping-freight index compiled by the Baltic Exchange in London that tracks the cost of moving dry bulk cargo across the Capesize, Panamax, and Supramax ship classes; because it reflects real demand to ship iron ore, coal, and grain, it is widely watched as a leading indicator of the global economy.
BDI spans freight demand from heavy-industry raw materials to agricultural goods, so when rates climb it usually signals that global industrial output and trade are heating up — which is why markets treat it as a "barometer" for the economic cycle.
BDI is calculated entirely from actual freight quotes in the shipping market and is hard to manipulate through speculation, so it tends to reflect the real state of physical trade and the economy more cleanly than many financial indicators.
Whether you research shipping, trade commodities, analyse raw-material demand, or simply want to catch turning points in the global cycle, BDI is one of the core indicators worth knowing. This guide walks through how BDI works, what makes it up, what moves it, and how to apply it in investing — in a beginner-friendly way.
- Definition: BDI is compiled daily by the Baltic Exchange in London from real freight quotes provided by shipping brokers, which makes it hard to manipulate by speculation
- Composition: A weighted blend of three ship-type sub-indices — Capesize (heavy industry / iron ore / coal), Panamax (grains / energy), and Supramax (regional / short-haul)
- Drivers: Demand side (Chinese industrial activity, global trade), supply side (shipbuilding cycle, scrapping), and external factors (geopolitics, oil prices, natural disasters)
- Cycle signal: BDI often leads manufacturing PMI and export data, making it a forward-looking indicator for global demand turns
- Limits: Short-term volatility from ship routing and shocks is large; read alongside PMI, CPI, and iron-ore prices for a fuller picture
1. What Is the Baltic Dry Index (BDI)?
The Baltic Dry Index (BDI) is a core measure of the global cost of shipping dry-bulk cargo, compiled and published daily by the Baltic Exchange in the United Kingdom.
It tracks the real freight rates for raw materials such as iron ore, coal, and grain in the global seaborne market, and it is one of the most authoritative benchmarks in the shipping industry.
Why BDI matters
BDI moves not from speculative trading but from real quotes provided by global shipping brokers, which gives it strong credibility. Its value rests on three key features:
- ▸It reflects global trade activity in real time: when raw-material demand rises, freight rates rise and BDI responds immediately.
- ▸It is not swayed by financial speculation: BDI cannot be traded directly; it is set by supply and demand.
- ▸An early signal for the business cycle: shifts in manufacturing or construction activity tend to appear in BDI ahead of other data.
How BDI works
BDI is a composite produced by weighting the freight indices of different ship types (Capesize, Panamax, and so on).
When global raw-material demand rises, capacity tightens, or routes face disruptions, BDI rises. The opposite pulls it down.
So BDI is more than a barometer for the shipping industry — it is also a tool investors use to read the global economic cycle, raw-material markets, and manufacturing conditions.
2. Publication Timing and Data Sources
BDI is compiled by the Baltic Exchange every business day and updates during the London trading session.
Because the index is based entirely on real market quotes rather than model estimates or futures, it is treated as one of the most credible real-time indicators in shipping.
How the data is collected
BDI's core data comes from real-time freight information supplied by global shipping brokers, including:
- ▸actual chartering prices that have been transacted
- ▸live inquiries between shipping companies and charterers
- ▸average market quotes across different routes
The Baltic Exchange aggregates, weights, and indexes these inputs to produce the daily BDI value, which reflects the real-time cost of global dry-bulk shipping.
3. Composition and Ship-Type Sub-Indices
BDI is not a single number. It is a weighted blend of sub-indices, each corresponding to a different ship type. The table below is a quick overview:
| Sub-index | Ship type | Notes |
|---|---|---|
| Baltic Capesize Index | Capesize | Very large vessels; carry iron ore and coal; main routes are Brazil—China and Australia—China |
| Baltic Panamax Index | Panamax | Mid-size vessels; can transit the Panama Canal; often carry grain, coal, and general raw materials |
| Baltic Supramax Index | Supramax | Smaller, more flexible vessels; suited to shorter routes and multi-port operations |
Together these three ship types form the core of BDI and let the index reflect long-haul routes, agricultural trade, and short-haul restocking demand in one number.
Ship type 1: Capesize
The Capesize is the most iconic ship type in dry bulk. Too large to pass through the Panama Canal, it has to round the Cape of Good Hope or Cape Horn — hence the name.
Key characteristics:
- ▸carries heavy raw materials such as iron ore and coal
- ▸routes concentrated on deep-sea links like Brazil—China and Australia—China
- ▸highly sensitive to global steel, infrastructure, and raw-material demand
The Capesize index is widely seen as a thermometer for global heavy-industry activity.
Ship type 2: Panamax
The Panamax is sized to transit the Panama Canal, which gives it strong route flexibility and makes it the hub of global grain and energy shipping.
Key characteristics:
- ▸handles diverse cargo such as grain and coal
- ▸covers grain routes across the Americas, Asia, and Europe
- ▸closely tied to global food trade and regional energy logistics
The Panamax index is often used to gauge how agricultural and regional energy demand is evolving.
Ship type 3: Supramax
The Supramax is a smaller, more flexible class that can operate in ports with limited infrastructure, making it suited to multi-port stops and regional trade.
Key characteristics:
- ▸well-suited to shorter routes and multi-stop shipments
- ▸carries a wider range of cargo, including steel, cement, fertiliser, and agricultural goods
- ▸reacts quickly to regional trade, short-term restocking, and demand shifts
The Supramax index is a key gauge of short-term trade momentum.
What the composition tells you
The three ship types map to different demand profiles:
- ▸Capesize: heavy industry and bulk raw materials
- ▸Panamax: agricultural goods and energy logistics
- ▸Supramax: regional economies and short-term restocking
By blending the three with weights, BDI captures:
- ▸whether global manufacturing and construction are accelerating
- ▸the strength of agricultural and energy trade
- ▸whether regional logistics demand is rising
So BDI is not just a shipping indicator — it is a multi-layered gauge of global real-economy momentum.
4. Trends and Drivers of BDI
BDI moves with the live supply-demand balance in global dry-bulk shipping, and the shifts behind those moves are driven by three forces working together: demand, supply, and external factors. Understanding them helps investors read raw-material markets and the global cycle.
Demand drivers: global industry and trade
BDI's strongest driver is the world's demand to ship iron ore, coal, and grain. That demand is anchored in manufacturing, the steel industry, and large infrastructure projects.
Whenever corporate production accelerates or governments push expansionary construction, dry-bulk shipping volume rises and BDI tends to follow.
Among the many sources of demand, China's industrial demand has the biggest impact on BDI.
China is the world's largest steel producer and iron-ore importer. Infrastructure expansion, a stabilising property market, or higher steel-mill output usually lift Capesize demand quickly and produce a clear bounce in BDI. The opposite — a slowing manufacturing or property market in China — typically drags BDI lower in sync.
Watching BDI from the demand side is, in effect, watching whether the global real economy is speeding up.
Supply drivers: fleet capacity and market structure
BDI is also affected by changes in ship supply. When available capacity grows, freight rates tend to fall. Capacity-side factors include:
- ▸new builds being delivered, expanding market supply
- ▸aging vessels being scrapped, reducing effective capacity
- ▸shipowners cutting orders when sentiment is bearish, slowing future capacity growth
- ▸changes in fuel, crew, and maintenance costs that affect willingness to operate
In overly optimistic years, shipyard orders tend to surge, which creates "overcapacity" several years later and drags BDI down over the medium term. When the building cycle contracts, demand recoveries are more likely to run into vessel shortages, sending freight rates up quickly.
Supply-side changes move more slowly than demand-side ones, but their effect is structural and helps determine BDI's medium- to long-term direction.
External factors: geopolitics and logistics shocks
Beyond the supply-demand fundamentals, BDI is influenced by various external events, including geopolitical risk, natural disasters, and fuel costs. Common sources include:
- ▸port congestion that traps vessels and reduces effective capacity
- ▸route blockages or conflict (such as Red Sea or Black Sea tensions) that raise shipping risk
- ▸typhoons, blizzards, and similar disruptions that delay voyages
- ▸a rise in international oil prices that lifts operating costs and indirectly freight rates
These tend to produce short but sharp moves, sending BDI up or down rapidly. For traders and the shipping industry, external factors are a major source of daily volatility.
Historical pattern: a mirror of the business cycle
History shows BDI repeatedly tracking phases of the global cycle.
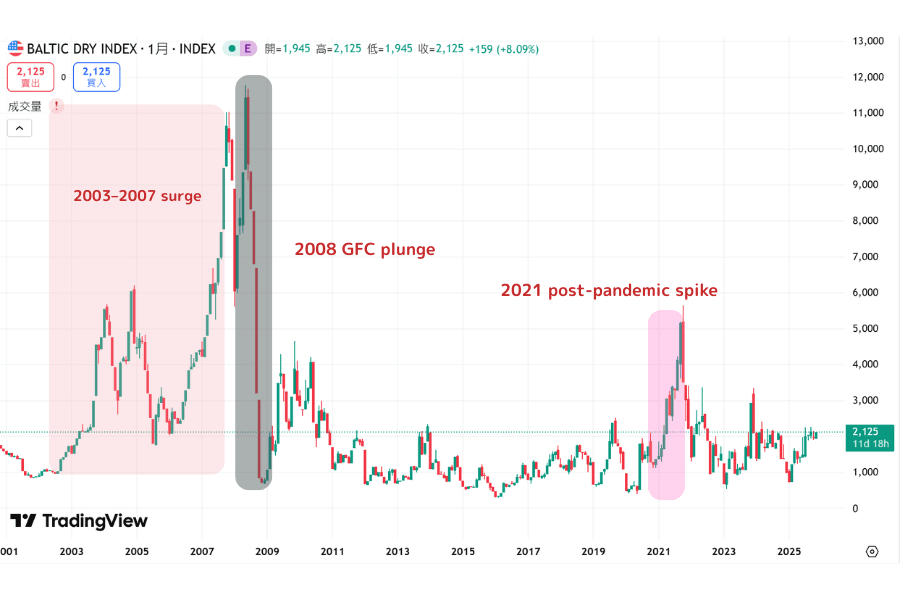
- 2003–2007 surge: driven by China's industrial demand and infrastructure boom, BDI reached record highs.
- 2008 GFC plunge: global trade froze, freight rates collapsed, and BDI fell by more than 90% within months — one of the sharpest drops on record.
- 2021 post-pandemic spike: severe port congestion, broken logistics, and supply-chain reshuffling pushed rates sharply higher in the short term.
- Range-bound at lower levels in recent years: when manufacturing momentum is weak and capacity is loose, BDI tends to look relatively soft.
Overall, BDI's long-run trend mostly reflects global trade conditions, while short-term swings come from capacity and external factors. For investors, understanding BDI's historical cycle helps locate where it sits in the current phase.
5. What BDI Means for Markets
BDI's value comes from reflecting "real global trade activity." Because freight rates cannot be moved by speculation and are not distorted by financial derivatives, the moment a company starts buying raw materials and arranging shipping, the move shows up in BDI. That makes it an important gauge of the global cycle and industrial activity.
BDI's market impact runs on two layers: industry and macro, touching shipping markets, energy demand, global trade, and FX flows.
Industry impact: shipping and energy markets
BDI is directly tied to the shipping industry. When dry-bulk freight rates rise, ship demand grows and charter rates go up — so:
- ▸shipping companies' profitability improves
- ▸ships run more often, raising fuel demand
- ▸demand for shipping equipment, repairs, and ancillary services grows in tandem
Because vessels burn large amounts of bunker fuel, higher volume also tends to push energy-market demand, which shifts oil-price expectations. These traits make BDI an important cycle indicator for shipping equities and parts of the energy complex.
Macro impact: cycle and manufacturing demand
BDI has long been treated as a "leading cycle indicator," because raw-material shipping happens before manufacturing. As a result, BDI moves often precede:
- ▸industrial production data
- ▸manufacturing orders (such as PMI)
- ▸import and export reports
When the global cycle turns up, firms procure iron ore, coal, and grain in advance, pushing freight rates higher and making BDI one of the earliest indicators to signal an inflection. When BDI weakens persistently, it may indicate slowing manufacturing and infrastructure activity.
Macro impact: international trade and FX
BDI is closely linked to FX, especially for countries that depend on raw-material exports. For example:
- ▸Australia is a major iron-ore exporter, so rising BDI often supports the Australian dollar (AUD)
- ▸when global trade slows, emerging-market currencies tend to come under pressure
- ▸falling dry-bulk freight rates can signal weaker global export demand
Analysts therefore use BDI to gauge the health of global trade and to read market risk appetite and capital-flow direction.
In short, BDI is a key indicator for shipping cycles, for global economic momentum, for trade vitality, and for FX trends — its cross-market reach makes it an indispensable tool in macro analysis.
6. How Investors Read and Use BDI
BDI reflects both the supply-demand balance of shipping and the macro reading of "global growth." Used well, it sharpens market sensitivity and helps you make more forward-looking asset-allocation decisions.
Use it to track global growth and raw-material demand
The core value of BDI is its ability to signal turns in manufacturing and infrastructure activity in advance. Investors can read it through these angles:
- ▸whether global manufacturing is turning from contraction back to recovery
- ▸whether demand for core inputs such as iron ore, coal, and grain is heating up
- ▸whether the shipping market is seeing a supply-demand inflection or tightening capacity
A sustained rise in BDI usually means companies are stepping up raw-material procurement; a prolonged decline signals slower trade.
Pairing with the following data improves accuracy:
- ▸manufacturing PMI
- ▸metals prices such as iron ore and copper
- ▸global export and trade-value reports
- ▸industrial data from major economies such as the UK, U.S., and China
Combined with these, BDI gives a more systematic read on cycle direction.
Use it for asset allocation and market strategy
BDI's lead time relative to several markets makes it useful for building a more rounded asset-allocation map, including:
- ▸shipping-related assets (shipping equities and ETFs)
- ▸raw-material equities (miners, energy companies)
- ▸foreign exchange: commodity-export-driven currencies such as AUD
- ▸commodities markets: futures in iron ore, coal, grain, and similar
A prolonged uptrend in BDI tends to indicate both raw-material demand and industrial activity strengthening together, supporting the assets above. A persistent decline often pressures related supply-chain equities and currencies.
Know the limits
Useful as it is, BDI comes with caveats:
- ▸short-term swings are large, often driven by ship routing and one-off events
- ▸BDI alone cannot predict the full path of equities or the global cycle
- ▸when shipping supply is heavily oversupplied, the index can stay low even when demand isn't weak
- ▸it reflects "freight rates," not "commodity prices" — the two do not always agree
So BDI works best as "one part of a broader macro framework" and should be read together with other mainstream indicators.
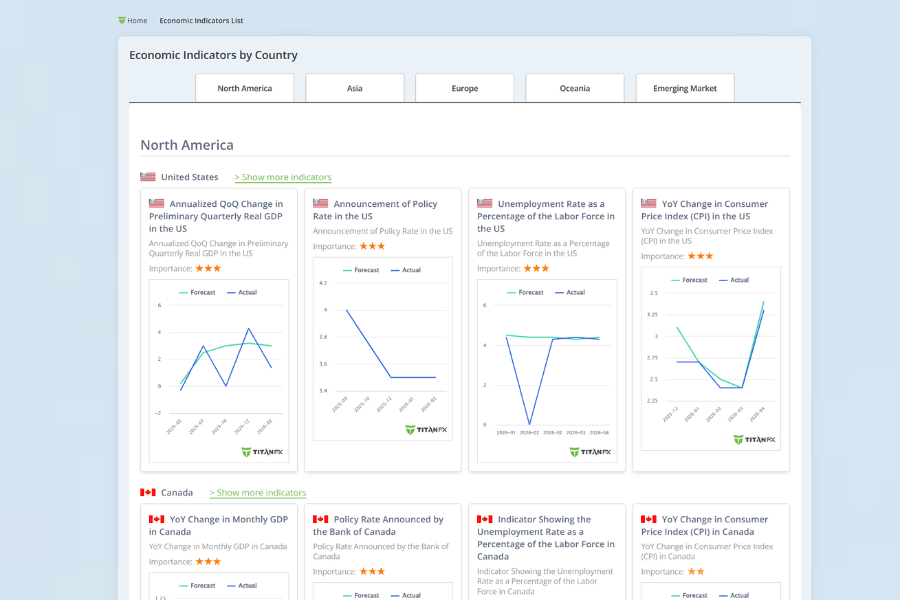
Titan FX's economic-indicator calendar lets you check these key data points for free:
- PMI (manufacturing and services): reflects firm orders and underlying demand
- GDP and industrial production: measure economic growth and manufacturing activity
- Trade balance: closely linked to exports, shipping volume, and global demand
- CPI / PPI and other price gauges: signal inflation pressure and raw-material cost moves
Like BDI, these data help investors read the global cycle and form a view on market direction.
7. Frequently Asked Questions (FAQ)
Q1. How should I read BDI together with global growth data?
BDI is best read alongside manufacturing PMI, iron-ore prices, copper, and global trade value. If BDI rises while PMI stays weak, the move often reflects restocking or short-term supply bottlenecks; if both rise together, the recovery signal is more convincing.
Q2. Is BDI affected by speculation?
No. BDI is calculated from actual freight quotes provided by shipping brokers, with no futures or derivatives in the picture, so it is rarely distorted by speculation — one of the few real-economy indicators that is hard to manipulate.
Q3. Is BDI a good short-term trading signal?
Not really. BDI reflects the macro trend in shipping and raw-material demand. Short-term swings often come from ship routing, weather, or port conditions and don't always sync with equities or FX. It's better suited to medium-to-long-term analysis.
Q4. Does BDI affect every industry?
No. BDI is most relevant to sectors tied to physical trade and raw-material demand — shipping, steel, energy, mining. Its direct impact on tech, financials, or services is weaker, so read it through an industry-specific lens.
Q5. How is BDI different from BDTI?
Both are important shipping indicators, but they reflect entirely different industries and economic angles.
BDI tracks freight for dry bulk — iron ore, coal, grain — and is closely linked to global manufacturing, infrastructure, and raw-material demand, making it a forward-looking indicator for the cycle and the real economy.
BDTI (Baltic Dirty Tanker Index) reflects tanker freight rates for liquid cargo such as crude oil and heavy fuel. It is driven mainly by oil prices, crude supply-demand, refinery demand, and geopolitics, and is closer to the energy market's supply-demand picture.
In short: BDI is about raw materials and the cycle; BDTI is about energy and geopolitics. They serve different purposes and should not be conflated.
8. Conclusion: How to View BDI
The Baltic Dry Index (BDI) is one of the most representative indicators in global shipping, reflecting dry-bulk freight rates, raw-material demand, and the momentum of international trade. Because its data comes from real market activity, it is widely viewed as a key reference for the business cycle and manufacturing activity.
For investors, BDI's value lives at three layers:
- ▸Cycle angle: BDI leads manufacturing and infrastructure activity and is useful for judging whether global demand is rebounding or cooling.
- ▸Industry angle: BDI is highly correlated with raw-material-intensive industries such as shipping, steel, mining, and energy.
- ▸Market angle: BDI shifts help inform medium-term trend judgements across FX, commodities, and equities.
BDI is not a standalone tool, though, because short-term swings are easily influenced by ship routing, weather, and one-off events. It should be paired with PMI, CPI, iron-ore prices, export data, and other macro indicators to get a fuller picture.
In sum, BDI is a key tool for understanding global demand, raw-material costs, and the shipping cycle — best treated as one component of macro analysis rather than as a direct trading signal.
Further Reading
- What Is the Business Cycle?
- Crude Oil CFD Trading
- What Are Commodities?
- What Is the Australian Dollar (AUD)?
- What Is a CFD?
Titan FX Research Hub — investor education across foreign exchange (FX), commodities (oil, precious metals, agriculture), stock indices, U.S. equities, and crypto assets.
Primary Sources (by category)
- Shipping exchange and industry benchmarks: Baltic Exchange, Baltic Exchange — Indices
- Business cycle and manufacturing data: S&P Global PMI, FRED economic data
- Academic and commodity-market basics: general public knowledge on dry-bulk shipping markets, the Capesize/Panamax/Supramax ship-type classification, and the framework of leading economic indicators