Maximum Drawdown (MDD)
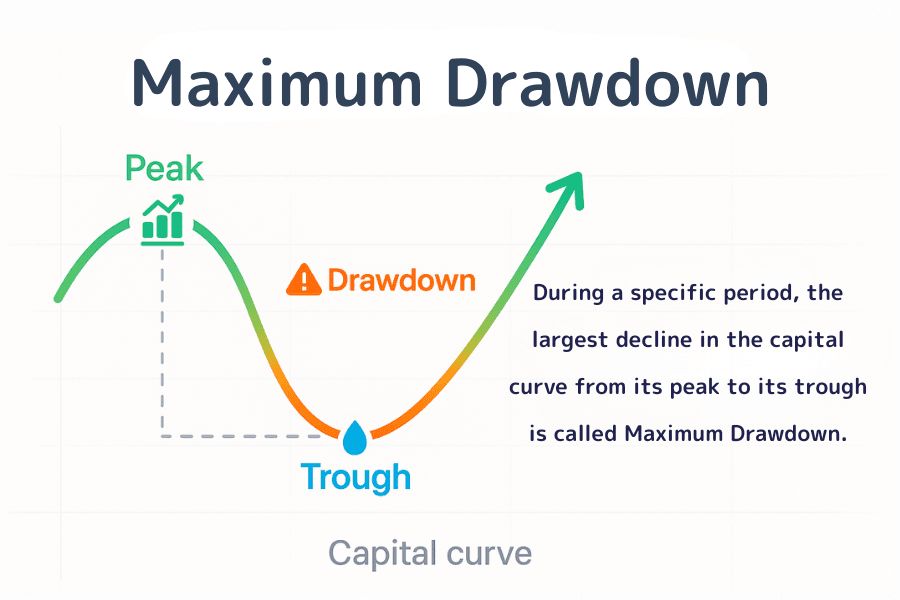
Maximum Drawdown (MDD) is the largest peak-to-trough decline of an equity curve, calculated as (Peak − Trough) ÷ Peak × 100%, and it measures the worst-case risk a strategy may incur.
In investing and trading, Maximum Drawdown (MDD) is one of the indicators that most directly reflects risk tolerance.
It reveals the worst-case loss a strategy might experience and dictates how hard it will be to recover. For new traders, understanding MDD is a critical first step toward stable profitability.
This article walks through the MDD definition, calculation, interpretation, and how money management and strategy adjustments can lower MDD and improve long-term return stability.
- MDD is the largest peak-to-trough drop on the equity curve. Formula: (Peak − Trough) ÷ Peak × 100%.
- Lower MDD usually means a steadier strategy. Above 30% often signals heavy leverage or weak risk control.
- The bigger the MDD, the harder to recover — non-linear: an MDD of 50% requires a 100% return to break even.
- Five ways to cap MDD: stops with per-trade risk limits, dynamic leverage and sizing, diversification, real-time risk monitoring, drawdown tolerance zones.
- Pair MDD with Sharpe Ratio, Sortino Ratio, and Calmar Ratio for full evaluation.
1. What Is Maximum Drawdown (MDD)?
Maximum Drawdown (MDD) measures the largest peak-to-trough drop in an equity curve for a portfolio or trading strategy over a given period. It captures the deepest funding loss that could occur over the path of investment and is a core metric for evaluating risk and stability.
By observing both the depth and the duration of a drawdown from peak to trough, MDD reflects a strategy's resilience under market stress more accurately than headline returns alone.
In professional investing and trading, MDD is used widely to:
- Measure how a strategy performs under adverse market conditions
- Evaluate the effectiveness of money management and risk control
- Compare the robustness of different strategies or portfolios
From a risk-management standpoint, smaller MDD generally means a steadier strategy and a smoother equity curve. Conversely, large drawdowns — even when paired with impressive returns — may reveal hidden risk or potential crash potential. Understanding and monitoring MDD therefore underpins a sustainable long-term trading mindset.
2. The Formula and Its Application
2.1. Formula
The standard MDD formula is:
MDD = (Peak − Trough) ÷ Peak × 100%
Where:
- Peak: the highest point of the equity curve
- Trough: the lowest point after that peak
The formula expresses the percentage drop from peak to trough — i.e., the maximum loss the investor could face in the worst case.
2.2. Plain Example
Suppose you are running an account.
- During a period, the account peaks at USD 100,000 (the Peak).
- It later drops to USD 80,000 on market moves (the Trough).
Applying the formula: MDD = (100,000 − 80,000) ÷ 100,000 = 20%
So during that period, the account experienced a maximum drawdown of 20%. Even if equity later recovers, that 20% drop remains the MDD for the window in question.
2.3. Analytical Points
MDD is not just a math figure — it is a real-world reflection of risk tolerance. For example, two strategies may both deliver 20% annual returns, but one with MDD 5% and the other with MDD 30% are very different in stability and risk.
MDD lets you:
- Gauge a strategy's resistance during downturns
- Estimate the maximum loss an investor can bear, psychologically and financially
- Inform decisions on position sizing and capital allocation
2.4. Companion Metrics
In professional analysis, MDD is commonly paired with:
- Average Drawdown: the mean magnitude across multiple drawdowns
- Drawdown Duration: time required to fall and then recover the peak
- Calmar Ratio: return ÷ MDD, capturing risk-adjusted return
Together they give a fuller picture: not only how much was earned, but the risk profile behind it.
3. How to Interpret MDD
The level of MDD directly reflects a strategy's risk tolerance and stability. Differences in MDD across strategies often reveal differences in money management, leverage ratio, and the risk profile of the underlying trading logic.
3.1. MDD Levels and What They Imply
| MDD range | Risk level | Typical strategy type | Reading |
|---|---|---|---|
| Below 10% | Low risk | Conservative, long-term allocation | Steady performance, low variance but limited returns. |
| 10%–30% | Moderate risk | Swing trading, quant trend strategies | Common range, with relatively balanced risk/return. |
| Above 30% | High risk | High leverage, short-term or speculative | High return potential but heavy capital and psychological stress. |
These numbers are guidelines — the ideal MDD varies by market and trading style. FX and crypto markets are more volatile, so tolerated MDDs are typically higher than for equities or mutual funds.
3.2. MDD and Return
High returns and large drawdowns often go together. A strategy that posts large short-term returns alongside an MDD above 40% likely relies on heavy leverage or large risk exposure. A strategy that holds MDD at 8% while delivering a steady 15% annualized return looks less flashy but tends to be more sustainable.
So focus on the return-to-drawdown ratio, not return alone. The ideal strategy balances growth and capital stability so that it can recover from consecutive losses.
3.3. MDD vs Other Performance Metrics
MDD typically sits inside a broader evaluation framework:
| Metric | What it measures | Relationship to MDD |
|---|---|---|
| Sharpe Ratio | Return per unit of volatility — return stability | Complements MDD's narrow focus on extreme down-moves. |
| Sortino Ratio | Downside-only volatility | Closer to real-world loss risk. |
| Calmar Ratio | Annualized return ÷ MDD | Direct measure of return efficiency relative to drawdown — the natural complement to MDD. |
In short, MDD captures worst-case risk, while the others capture different angles of volatility and efficiency. A strategy with low MDD, high Sharpe, and high Calmar typically combines strong risk control with stable performance — and tends to win over the long run.
4. Strategies to Control MDD
MDD cannot be eliminated, but reasonable money management and strategy adjustment can shrink it materially and smooth the equity curve. The following methods are widely used.
4.1. Stops and Per-Trade Risk Limits
Predefine a stop on every trade and cap per-trade loss at 1%-2% of total capital. Even during a losing streak, MDD cannot expand explosively, and the account avoids falling into a "no return" loss zone.
4.2. Dynamic Leverage and Position Sizing
Adjust leverage and exposure in step with market volatility. When volatility rises, lower leverage and trim positions to limit potential drawdown depth. When volatility compresses, scale back up to improve return efficiency.
4.3. Diversification and Correlation Control
Allocate across asset classes and markets — FX, stock indices, precious metals — to lower single-direction risk. With lower cross-market correlation, portfolio-wide volatility falls and MDD stays in a controllable range.
4.4. Drawdown Monitoring and Real-Time Risk Control
Track current drawdown continuously. When it crosses a preset threshold (e.g., 15%), pause trading or reduce positions. Titan FX's backtesting and risk-report tools let you observe MDD in the development phase and tune parameters before going live.
MT4 (Windows) Backtesting Guide MT5 (Windows) Backtesting Guide4.5. Set a "Drawdown Tolerance Zone"
Decide on the maximum drawdown you can accept and align it with your risk preference. A short-term trader might cap MDD at 10%; a long-term strategy might tolerate 20%–25%. This keeps you psychologically anchored and avoids emotional reactions to short-term losses.
In short, controlling MDD is about discipline and dynamic risk management, not after-the-fact patches. A stable equity curve improves long-term survival and supports consistent decision-making through market noise.
5. Applying MDD in FX Trading and Money Management
In FX markets, MDD is more than a statistic — it is a core indicator of strategy stability and risk control. For traders chasing steady long-term returns, managing and applying MDD is essential.
5.1. Evaluating Automated Trading Systems (EAs) and Strategy Performance
In automated FX trading, MDD is a key benchmark for stability. From the MDD in a backtest report, you can judge how the system would have behaved in past stress conditions.
- If MDD is too high (e.g., above 30%), the strategy likely depends on leverage or has weak risk control.
- If MDD sits in a reasonable range with a sensible return-to-drawdown ratio (e.g., 20% annual return at 10% MDD), the risk-return structure is healthy.
That is why MDD is one of the first filters when screening automated strategies or EAs.
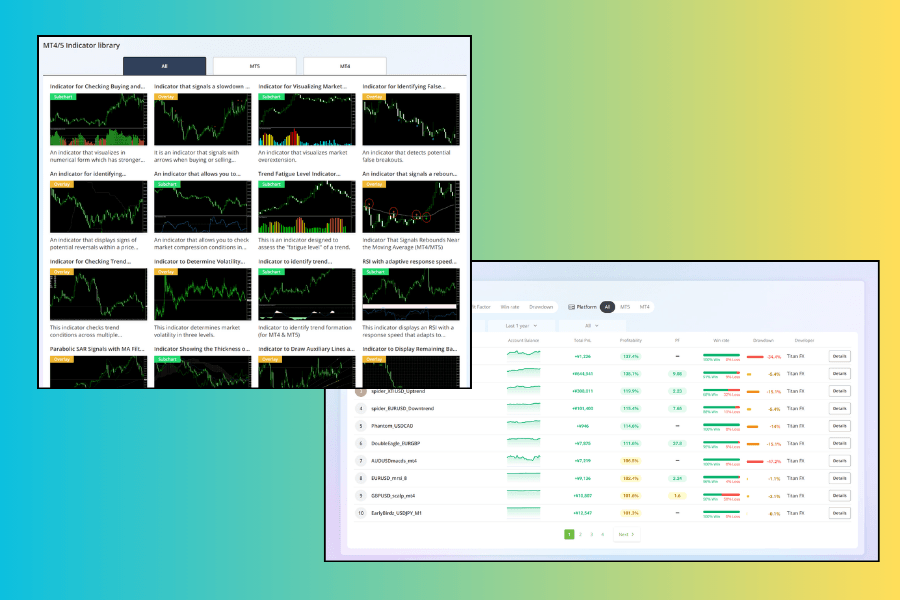
Titan FX Provides Free Trading Tools (Custom Indicators and EAs)
Titan FX offers free trading tools — including custom indicators and EAs (automated trading programs) — designed to improve trader efficiency and strategy precision. Custom indicators help analyze market trends more accurately and spot potential opportunities. EAs execute predefined strategies automatically, removing emotional interference and ensuring consistent execution.
5.2. Building a Money-Management and Recovery Plan
MDD does not just measure the loss — it dictates the return needed to recover.
- An MDD of 10% requires roughly an 11% return to recover.
- An MDD of 50% requires a 100% return to recover.
That asymmetry is why controlling drawdown matters so much. In practice, traders back out an appropriate leverage level and per-trade risk from their acceptable MDD ceiling, building a more resilient money-management framework.
5.3. Integrating Platform Tools and Performance Monitoring
Many professional FX platforms (including Titan FX) provide backtest reports, real-time risk monitoring, and statistics. Traders can track MDD, profit factor, volatility, and tune trading parameters and position allocation against historical MDD.
This data-driven approach helps:
- Spot rising risk earlier
- Build an MDD-centred risk model
- Maintain a stable equity curve across market regimes
Overall, MDD is the most practical "defensive metric" in FX. It measures loss risk and helps balance stability and growth in strategy optimization and asset allocation.
6. FAQ
Q1. Is "Maximum Drawdown" the same as "max equity drop"?
The concepts are the same — both describe the largest peak-to-trough fall in equity. The difference is usage. Maximum Drawdown (MDD) dominates in FX, fund, and systematic-trading analysis; "max equity drop" tends to appear in general retail-investment or equity discussion. Professional reports usually standardize on MDD.
Q2. Does MDD change over time?
Yes. MDD is computed over a specific window — peak and trough within that window. Different periods give different results. A strategy might show MDD 5% over the short term, but 15% or more over six to twelve months as volatility builds. Always state the window when analysing MDD.
Q3. Does MDD fully capture trading risk?
MDD is one of the most intuitive risk indicators, but it cannot cover every risk. Liquidity risk, sudden black-swan events, or systems errors can produce losses beyond the historical MDD. Pair MDD with volatility, Sharpe Ratio, and other tools.
Q4. Why is real-trading MDD often worse than backtest MDD?
The usual culprits are out-of-sample regime changes and simulation gaps. Backtests rarely fully model slippage, execution delay, and liquidity shifts. In live trading these factors amplify losses, pushing MDD above the backtest reading. Professionals typically add a safety buffer (for example +30%) on top of the backtest MDD when planning live risk.
Q5. Is a lower MDD always a safer strategy?
Not necessarily. Low MDD typically points to lower volatility and a steadier strategy, but if returns are also too low, capital efficiency suffers. The ideal state is MDD within a tolerable band (say 10%–20%) and returns high enough to cover risk and sustain growth. "Stable" is not always the same as "safe" — control drawdown while preserving profit potential.
7. Conclusion
Maximum drawdown is not just a number — it is a mirror reflecting trading discipline and psychological resilience. Whether a trader can manage drawdown often determines whether they stay in the market long enough to compound. In practice, the goal is not to avoid losses entirely, but to keep them controllable, bearable, and recoverable. A stable equity curve does not mean never falling — it means recovering quickly when it does. For traders aiming to strengthen risk control, observing, computing, and managing MDD builds a more scientific capital-planning mindset and the discipline to maintain a calm, accurate, and consistent return rhythm through market volatility.
Further Reading
- What Is the Sharpe Ratio?
- What Is the Sortino Ratio?
- What Is the Profit Factor?
- What Is Volatility?
- What Is a Black Swan Event?
Titan FX Research Hub — investor education across foreign exchange (FX), commodities (oil, precious metals, agriculture), stock indices, U.S. equities, and crypto assets.
Primary Sources (by category)
- Standard risk-metric definitions: CFA Institute Investment Performance Standards; Investopedia "Maximum Drawdown" public materials
- Academic background: Calmar Ratio (Young 1991), Sharpe Ratio (Sharpe 1966), and related risk-adjusted return measures
- Practical analysis framework: Titan FX Risk Indicators and systematic-trading backtest standards